Introduction
Streams in the McMurdo Dry Valleys, Antarctica have been investigated since the IGY in 1957–58. The Onyx River in Wright Valley has the longest flow record of any Antarctic stream (Chinn Reference Chinn1993, McKnight et al. Reference McKnight, Niyogi, Alger, Bomblies, Conovitz and Tate1999), but up until the beginning of the McMurdo Dry Valleys Long-Term Ecological Research program (MCM-LTER) in 1993, biogeochemical and geochemical data had only been collected from the Dry Valley streams on an irregular basis. Although many significant observations were obtained on the geochemistry of these streams prior to the establishment of the MCM-LTER (e.g. Howard-Williams et al. Reference Howard-Williams, Vincent, Broady and Vincent1986, Reference Howard-Williams, Priscu and Vincent1989, Vincent & Howard-Williams Reference Vincent and Howard-Williams1986, Green et al. Reference Green, Angle and Chave1988), there were not sufficient data to evaluate long-term differences in stream chemistries related to geographic and biological differences in the streams themselves. This is particularly true in Taylor Valley where a large number of streams exist that vary in slope, landscape position, substrate type, amount of biomass present and other attributes (McKnight et al. Reference McKnight, Niyogi, Alger, Bomblies, Conovitz and Tate1999).
In general, solute concentrations increase downstream due to salt dissolution, evaporation, cryoconcentration and chemical weathering (Lyons et al. Reference Lyons, Welch, Neumann, Toxey, McArthur, Williams, McKnight and Moorhead1998, Gooseff et al. Reference Gooseff, McKnight, Lyons and Blum2002). Chemical weathering of both carbonates and silicate minerals occurs primarily in the hyporheic zones of stream channels and the rates can be quite high (Nezat et al. Reference Nezat, Lyons and Welch2001, Gooseff et al. Reference Gooseff, McKnight, Lyons and Blum2002, Maurice et al. Reference Maurice, McKnight, Leff, Fulghum and Gooseff2002, Green et al. Reference Green, Stage, Preston, Wagers, Shacat and Newell2005). Biogeochemical processes primarily occurring in microbial mats and in the hyporheic zone can be extremely important in regulating nutrients and trace metals within these streams (Howard-Williams & Vincent Reference Howard-Williams and Vincent1989, Howard-Williams et al. Reference Howard-Williams, Vincent, Broady and Vincent1986, Reference Howard-Williams, Priscu and Vincent1989, Vincent & Howard-Williams Reference Vincent and Howard-Williams1986, Reference Vincent and Howard-Williams1989, McKnight et al. Reference McKnight, Gooseff, Vincent and Peterson2008, Fortner Reference Fortner2008). Ion exchange reactions within the hyporheic zone can also be an important geochemical process in these streams (Gooseff et al. Reference Gooseff, McKnight and Runkel2004).
Because of the MCM-LTER, we now have longer geochemical records of the streams in Taylor Valley. In this paper we will examine these records, especially the spatial variability, in order to assess better the role that landscape position plays in controlling the geochemistry of these streams. The MCM-LTER has routinely measured a suite of inorganic constituents (major element ions: Na+, K+, Mg2+, Ca2+, Cl- and SO42-; nutrients NO3- and PO43-; as well as H4SiO4 and titration alkalinity (Alk)). All of the solutes have potentially variable sources (i.e. Na+ could be derived from snowmelt, from dissolution of previously precipitated salts such as NaCl or Na2SO4, or from the weathering of Na-rich alumino-silicate minerals such as plagioclase). Our goal in this manuscript is not to ultimately quantify the source of each solute, but rather to examine differences in stream geochemistry among the streams in Taylor Valley and to evaluate the importance of landscape position on stream water geochemistry. This will be done using 16 years (1993–2009) of MCM-LTER data. There is also a relatively high degree of temporal variability, both at seasonal and inter-annual time scales in each stream (http://mcmlter.org). This variability is thought to be primarily related to hydrologic variability such as changes in stream discharge, hyporheic zone exchange and freeze-thaw events. In addition, some of the temporal variability observed may be related to changes in solute sources such as changes in dust flux. Examination of the temporal variability at each stream is beyond the scope of this paper and will not be addressed in detail. Although this work does not address any of the Latitudinal Gradient Project (LGP) key questions directly it does address the issue of local variability at one particular latitude, which has been an acknowledged complication to the LGP concept (Howard-Williams et al. Reference Howard-Williams, Peterson, Lyons, Cattaneo-Vietti and Gordon2006).
Site description
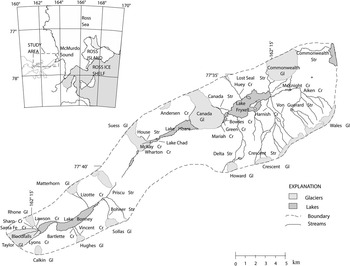
The McMurdo Dry Valleys (76°30′–78°00′S, 160°00′–165°00′E) comprise the largest ice-free area of Antarctica (4800 km2). Taylor Valley has been the primary site of on-going investigation since its establishment as a Long-Term Ecological Research (LTER) site in 1993 (Fig. 1).
Map of Taylor Valley showing location of streams and lakes discussed in the text.

Physical processes dominate ecosystem function in this polar desert environment. The mean annual temperature at various sites on the valley floors ranges from -15°C to -30°C with precipitation of less than 3 cm yr-1 water equivalent (Doran et al. Reference Doran, McKay, Clow, Dana, Fountain, Nylen and Lyons2002, Fountain et al. Reference Fountain, Nylen, Monaghan, Basagic and Bromwich2009). Liquid water is very limited on the landscape surface for most of the year due to the cold winter temperatures. However, during the summer air temperatures reach and exceed 0°C, resulting in meltwater generation from glaciers and snow packs. The availability of liquid water on the landscape is one of the most important limitations for life (Kennedy Reference Kennedy1993), and hence the routine monitoring of the hydrology and chemistry of streams has been undertaken as part of the on-going ecological studies. Prior to the establishment of the MCM-LTER, limited studies of the Dry Valley streams established the variability of the stream hydrology and chemistry over time and illustrated the sensitivity of the hydrologic system to climate variability (Chinn Reference Chinn1993).
There are subtle spatial differences in the current climate of the Dry Valleys as well as in the climate-related evolution of the lakes (Lyons et al. Reference Lyons, Fountain, Doran, Priscu, Neumann and Welch2000). The climate of the Lake Bonney basin tends to be influenced more by continental air masses and therefore it is warmer, sunnier, and drier than the Lake Fryxell and Hoare basins, which are located closer to the ocean (Fig. 1). The eastern Taylor Valley is subjected to marine air masses coming from the coast, particularly in the summer months when the streams are flowing (Lyons et al. Reference Lyons, Fountain, Doran, Priscu, Neumann and Welch2000). Precipitation generally sublimates rather than melting and running off or recharging, resulting in salt accumulation in the soils. The distribution of salts in the soils varies with location in relation to airmass trajectory, landscape position and surface age (Keys & Williams Reference Keys and Williams1981).
Stream descriptions
Streams in the McMurdo Dry Valleys are an important link transferring water and solutes from alpine glaciers to the closed-basin lakes on the valley floors. The stream water is derived from glacial melt during the summer months and in Taylor Valley is the primary source of water to the lakes. Glacial meltwater flows through stream channels with unconsolidated alluvium composed primarily of sand-sized particles (Conovitz et al. Reference Conovitz, McKnight, Macdonald, Fountain and House1998). The variations in stream hydrology are related to weather and climate on a daily, seasonal and inter-annual time scale (Conovitz et al. Reference Conovitz, McKnight, Macdonald, Fountain and House1998, Ebnet et al. Reference Ebnet, Fountain and Nylen2005). This hydrological variability has major implications for water and solute input into closed-basin lakes on the valley floor. The response of the Dry Valley ecosystem to this variability is an ongoing theme of the MCM-LTER research.
Most of the stream and lake names referred to in the text have been approved by the US Board on Geographic Names. However, there are a few names that are commonly used in the text that are not official approved names including, Santa Fe, Mariah and Blood Falls.
Lake Fryxell (Fig. 1) is the easternmost lake in Taylor Valley. The gauged streams in the Lake Fryxell basin range in gradient from 0.02 m m-1 on the valley floor up to 0.55 m m-1 in the steep upper reaches. The streams vary in length from 1.0 km to 11.2 km (Conovitz et al. Reference Conovitz, McKnight, Macdonald, Fountain and House1998) with streams on the north and south side of the basin being longer than those on the east and west. The streams in the southern part of the Lake Fryxell basin are among the longest in the Taylor Valley and drain glaciers in the Kukri Hills (Fig. 1).
Andersen Creek (Fig. 1) is the only stream that flows directly into Lake Hoare. Andersen Creek is a proglacial stream that flows along the margin of Canada Glacier into the north-east end of the lake. The Lake Hoare basin has three short streams, Wharton, House and McKay, each c. 0.5 km in length, that flow from the Suess Glacier into Lake Chad, a shallow lake to the west of Lake Hoare (Fig. 1). At times, Lake Chad spills over to Lake Hoare and provides another source of water and solutes to the lake.
Lake Bonney is divided into two lobes and each lobe has several streams flowing into it (Fig. 1). The streams in the Lake Bonney basin tend to be steep, rocky and transport more sediment than those of the Fryxell and Hoare basins and consequently algal mats tend to be sparse (Alger et al. Reference Alger, Mcknight, Spaulding, Tate, Shupe, Welch, Edwards, Andrews and House1997). Priscu Stream in the east Lake Bonney basin is one of the few second order streams in Taylor Valley. Other streams drain the alpine glaciers on the steep slopes on the south side of the east Lake Bonney basin. The streams flowing from the Taylor Glacier, Santa Fe and Lyons, flow into the west lobe of Lake Bonney and are relatively saline compared to the other glacial melt streams in the Taylor Valley. There are thought to be relict salt deposits under the terminus of the Taylor Glacier (Lyons et al. Reference Lyons, Welch, Snyder, Olesik, Graham, Marion and Poreda2005). The area on the terminus of the Taylor Glacier is known as Blood Falls due to the iron-rich saline water that discharges from below the glacier and creates a distinctive rusty red colour on the glacier surface when the iron is oxidized (Mikucki et al. Reference Mikucki, Foreman, Sattler, Lyons and Priscu2004). The proglacial streams on the north and south of the Taylor Glacier are also relatively saline. However, their ion ratios differ from that of Blood Falls and may reflect an input of salt at a different stage of brine evolution (Lyons et al. Reference Lyons, Welch, Snyder, Olesik, Graham, Marion and Poreda2005). (All stream data collected by the MCM-LTER can be found on the website at www.mcmlter.org).
Methods
Sampling
The sampling of the streams has been conducted by the MCM-LTER field teams from 1993 to present. Most streams are sampled on a weekly basis during the flow season starting at the end of November until the end of January. However, ungauged streams are sampled less frequently. Stream flow can be variable and intermittent, so streams are not always sampled on a regular schedule. Samples are collected just upstream of the stream gauge, or close to the mouth of the stream if the streams are not gauged. Stream water samples are filtered at the field camps within hours of collection using Nuclepore™ polycarbonate membrane filters with 0.4 μm pore size. Anion and H4SiO4 samples are filtered into HDPE bottles that have been rinsed five times with ultra-pure water. Nutrient and cations samples are filtered into HDPE bottles that have been rinsed with 1% or 10% HCl solution and then rinsed five times with ultra pure water. Cation samples are preserved with acid to a pH of approximately 2–3 by addition of 0.1% Ultrex nitric acid. Major ion and reactive Si samples are stored chilled at approximately 4°C until analysis. Nutrient samples are stored frozen until shortly before analysis.
Chemical analysis
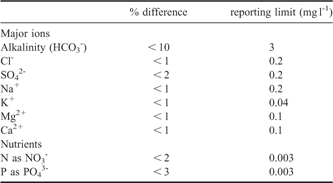
Samples were analysed for major anions and cations by ion chromatography. From the years 2000 to present a Dionex DX-120 (Sunnyvale, CA) was used for the major ion analyses. This instrument uses a single piston isocratic pump with constant flow rate set at 1.2 ml per minute and an electrical conductivity detector. For the cation analyses, a Dionex IonPac CS12A analytical column (4 x 250 mm) and a CG12A guard column (4 x 50 mm) was used. The eluent is 0.13% methanesulphonic acid solution. A CSRS Ultra Cation Self-Regenerating Suppressor was used. For the anions, a Dionex IonPac AS14 analytical column (4 x 250 m) and an AG14 guard column (4 x 50 mm) was used. The eluent is a 1.0 mM NaHCO3 and 3.5 mM Na2CO3 solution. An ASRS Ultra Anion Self-Regenerating Suppressor was used. A measurement of precision and reporting limits for the ions are shown in Table I.
Precision of the major ion and nutrient analytical data is calculated as the average percent difference between duplicate samples. The reporting limit is the lowest concentration that is quantified using our standard methods for each analyte.

Prior to the year 2000, a DX-300 was used for the anion and cation analysis. The details of analysis have been described elsewhere (Welch et al. Reference Welch, Lyons, Graham, Neumann, Thomas and Mikesell1996; Limno Methods Manual, http://www.mcmlter.org/queries/lakes/lakes_home.jsp).
Nutrient analyses were done using a Lachat QuikChem AE analyser prior to 1998 and then a Lachat QuikChem 8000 FIA instrument with Omnion 3.0 software (Loveland, CO) after 1998. The instrument is set up to run four channels simultaneously and methods are optimized for low concentration samples. A measurement of precision and reporting limits for nitrate and soluble reactive phosphorus are shown in Table I.
H4SiO4 was determined using a manual colorimetric method based on the method of Mullin & Riley (Reference Mullin and Riley1955). Details of this method are also described by Pugh et al. (Reference Pugh, Welch, Lyons, Priscu and McKnight2003).
Samples for titration alkalinity were collected in 20 ml plastic scintillation vials with poly-cone caps. Samples were returned to the Ohio State University for analysis. Alkalinity was determined by titration with 0.1 N standard HCl to a pH of 4.5. At the pHs and low dissolved organic carbon concentrations of these streams, titration alkalinities are assumed to be primarily bicarbonate. Charge balance errors were calculated by taking the difference between the total anion equivalents, including alkalinity, and total cations and dividing by the sum of anion and cation concentrations in equivalents. The average percent difference was 5%, with a range from 0.1–20%.
Results
Major ions
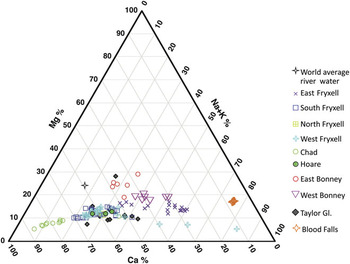
One of the traditional ways to graphically present water quality data is by use of Piper diagrams. Figure 2 shows the percentage of Ca2+, Mg2+ and Na++K+ (in equivalents) in Taylor Valley streams. In the majority of the streams, Mg2+ is less than 20% of the total cation concentration. Only in Priscu Stream samples and one sample draining Santa Fe/Lyons is Mg2+ > 20%. The most apparent trend shown in this figure is the variation between Ca2+ and Na++K+. The streams flowing into Lake Chad and Andersen Creek in the Lake Hoare basin, the majority of streams in the southern, northern and western portion of the Lake Fryxell basin, and most of the Santa Fe and Lyons samples all have > 50% Ca2+. Blood Falls and some of the streams in the eastern and western Lake Fryxell basin have > 50% Na++K+ (Fig. 2). The other streams such as Lawson and Priscu and some of the eastern Fryxell basin streams have cation compositions that are 10–30% Mg2+ and the remainder is divided between Ca2+ and Na++K+.
Cation Piper diagram. Ca2+, Mg2+ and Na++K+ are shown as % by equivalents. Streams are grouped by location. East Fryxell includes Lost Seal, McKnight and Aiken. South Fryxell includes VonGuerard, Harnish, Crescent and Delta. North Fryxell is Huey. West Fryxell includes Canada, Mariah and Green. Chad includes Wharton, House and McKay. Hoare is Andersen Creek. East Bonney is Priscu Stream. West Bonney is Lawson Creek. Taylor Glacier represents Santa Fe and Lyons Creek. Blood Falls is plotted separately. World average river data are from Hu et al. (Reference Hu, Stallard and Edmond1982).

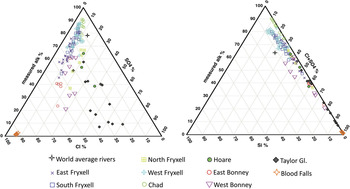
One can also plot the anion data using a Piper scheme and the traditional method, the percentage of Cl-, SO42- and Alk (or HCO3-) (in equivalents), is shown in Fig. 3. There is a much more diffuse pattern than the cation data, because although the majority of samples are dominated by high percentages of alkalinity, there are a few samples with Cl- or SO42- as the most abundant anion. The Blood Falls samples clearly plot separately as Cl- enriched, while many of the Santa Fe and Lyons samples are rich in SO42-. The chemistry of these streams is clearly dominated by evaporite mineral input, especially NaCl and CaSO4•2H2O. Again the Priscu Stream in the east Lake Bonney basin, Andersen Creek at Lake Hoare and Lawson Creek in the east Lake Bonney basin plot along different trajectories. The Huey Creek in the north Fryxell basin samples plot differently as well with slightly higher SO42- than the main trend of samples. The majority of the Lake Chad streams, west Fryxell basin, south Fryxell basin and east Fryxell basin samples plot along a 95% to 45% Alk line with SO42- percentages of < 20%, and most < 10%. In general there is a decrease in alkalinity and an increase in Cl- going from the Lake Chad streams to the west Fryxell basin, to south Fryxell basin to the east Fryxell basin reflecting an increase in Cl- percentages approaching McMurdo Sound.
Two versions of the anion Piper diagram. The first plot shows Cl-, SO42- and Alkalinity in % by equivalents. The second plot shows H4SiO4, Alk and Cl-+SO42- as % equivalents. Symbols and locations are the same as Fig. 2.

A different method of Piper plot using percentage of alkalinity, Cl-+SO42-, and Si (i.e. H4SiO4), at the apexes was first used by Hu et al. (Reference Hu, Stallard and Edmond1982). This plot clearly shows the anionic continuum between Alk and Cl-+SO42- (Fig. 3). In no case is H4SiO4 larger than ∼10% of the total with the highest H4SiO4 percentages in Lawson Creek in the west Lake Bonney basin and some of the west and south Fryxell basin streams. These higher H4SiO4 concentrations reflect enhanced weathering in these streams.
Another way to summarize the data is to calculate the mean percentages in equivalents for all the samples. As the Piper diagrams have already demonstrated, Ca2+ and Alk are the major constituents of the Taylor Valley streams with Ca2+ (55%) > Na+ (28%) > Mg2+ (13%) > K+ (4%) and Alk (65%) > Cl- (22%) > SO42- (12%). Because of its relatively low concentration in seawater, and hence aerosols derived from seawater, the HCO3- (Alk) in the streams is derived from the chemical weathering of carbonate and silicate minerals. Using the seawater ratios and assuming that all the Na+ (for the cations) is derived from a marine aerosol, the non-seasalt derived fractions of the other major ions are Ca2+- 98%, K+ - 83%, and Mg2+ - 57%. Of course, not all of the Na+ is derived from precipitation, so these numbers are the minima contributions for mineral weathering.
Nutrients and H4SiO4
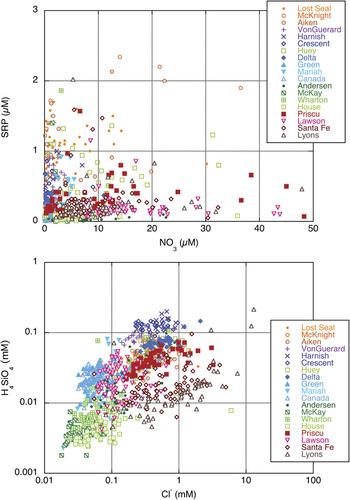
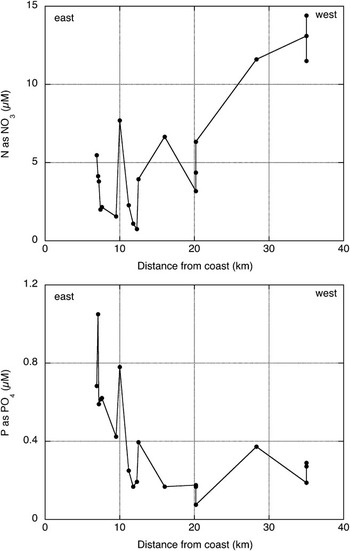
Figure 4 shows the soluble reactive phosphate (SRP) data plotted against the NO3- data. In general the Bonney basin streams are enriched in NO3- and depleted in SRP, while many of the Fryxell basin streams, especially the eastern Fryxell basin, show the opposite trend. This is more readily demonstrated when the data are plotted in a spatial context (Fig. 5).
Plots of soluble reactive phosphorus (SRP) versus nitrate (NO3-) in μM concentrations and log scale plot of H4SiO4 versus Cl- in mM concentrations for selected Taylor Valley streams.

SRP and NO3 variation shown as distance from the coast in kilometers. Concentrations are calculated averages from the available data.

A plot of H4SiO4 versus Cl- is shown in Fig. 4. The pattern from our dataset is that the streams draining the south Fryxell basin have the highest H4SiO4 concentrations (Fig. 4). In general Priscu Stream, the west Fryxell basin streams and some of the east Fryxell basin streams also have relatively high H4SiO4. As noted above, these relatively high H4SiO4 concentrations reflect enhanced chemical weathering, especially in the hyporheic zones of the lower gradient streams such as those in the Lake Fryxell basin. The Lake Chad streams and Andersen Creek in the Lake Hoare basin as well as some of the west Fryxell basin streams and the west Bonney basin streams have some of the lowest H4SiO4 concentrations.
Discussion
Landscape position as a geochemical discriminator
Numerous studies have demonstrated east–west geochemical and biogeochemical trends in the soils, surface waters of the lakes, and glaciers of the McMurdo Dry Valleys (e.g. Keys & Williams Reference Keys and Williams1981, Lyons et al. Reference Lyons, Welch, Neumann, Toxey, McArthur, Williams, McKnight and Moorhead1998, Reference Lyons, Fountain, Doran, Priscu, Neumann and Welch2000, Reference Lyons, Welch, Fountain, Dana, Vaughn and McKnight2003, Burkins et al. Reference Burkins, Virginia, Chamberlain and Wall2000, Witherow et al. Reference Witherow, Bertler, Welch, Lyons, Mayewski, Sneed, Nylen, Handley and Fountain2006, Barrett et al. Reference Barrett, Virginia, Lyons, McKnight, Priscu, Doran, Fountain, Wall and Moorhead2007). The long-term stream data also indicate variations in major ion and nutrient concentrations that reflect landscape position within Taylor Valley. These geochemical gradients within Taylor Valley have been argued to be due to a number of attributes including distance from the ocean, elevation, age of landscape surface, lithology of the tills and soils, and past climate history. For example Keys & Williams (Reference Keys and Williams1981) observed more Cl- salts in the soils closer to the ocean and attributed this to the input of marine aerosols. Barrett et al. (Reference Barrett, Virginia, Lyons, McKnight, Priscu, Doran, Fountain, Wall and Moorhead2007) acknowledge the differences in N and P distribution on the Taylor Valley landscape and attributed this in part to the differences in till types as well as age of the tills in each lake basin. The pattern observed in Fig. 5 has led to different nutrient limitations in the lakes within Taylor Valley. For example, Priscu (Reference Priscu1995) has demonstrated that Lake Fryxell is N-deficient in regards to nutrient availability for phytoplankton, while Lake Bonney is P-deficient. This is clearly related to the difference in total fluxes and stoichiometry of these inorganic nutrients entering the lakes (Barrett et al. Reference Barrett, Virginia, Lyons, McKnight, Priscu, Doran, Fountain, Wall and Moorhead2007), which is observed in the stream data presented in Figs 4 & 5. The impact of such effects as surface age is not subtle in that it has great consequence for the superimposed aquatic ecosystems. This so-called “legacy effect” has been discussed in much detail, primarily for Taylor Valley, and suggests that past events continue to imprint the current ecosystem (Priscu Reference Priscu1995, Moorhead et al. Reference Moorhead, Doran, Fountain, Lyons, McKnight, Priscu, Virginia and Wall1999, Lyons et al. Reference Lyons, Fountain, Doran, Priscu, Neumann and Welch2000, Reference Lyons, Welch, Priscu, Labourn-Parry, Moorhead, McKnight, Doran and Tranter2001).
Lyons et al. (Reference Lyons, Welch, Fountain, Dana, Vaughn and McKnight2003) and Witherow et al. (Reference Witherow, Bertler, Welch, Lyons, Mayewski, Sneed, Nylen, Handley and Fountain2006) have shown that the surficial geochemistry of glaciers in Taylor Valley varies with landscape position and elevation. Therefore, glacier melt chemistry can also differ between glaciers and this melt can be further modified by the presence or absence of cryoconites on the glacier surface (Lyons et al. Reference Lyons, Welch, Fountain, Dana, Vaughn and McKnight2003, Fortner et al. Reference Fortner, Tranter, Fountain, Lyons and Welch2005, Bagshaw et al. Reference Bagshaw, Tranter, Fountain, Welch, Basagic and Lyons2007). Glaciers with elevated dust burdens can contribute higher solute fluxes to the streams and hence the closed-basin lakes. The abundance of cryoconites can lead to variations in nutrient chemistry of water exiting the glacier surface as well (Bagshaw et al. Reference Bagshaw, Tranter, Fountain, Welch, Basagic and Lyons2007). The weathering and dissolution of aeolian materials on the glacier surfaces and in cryoconites vary in time and space, and therefore, add to the variability of stream geochemistry.
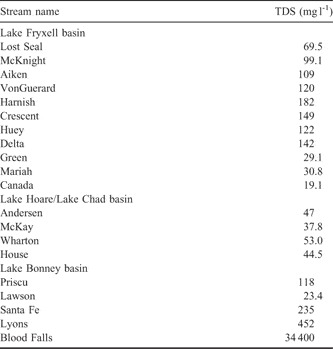
In general, riverine geochemistry can be classified based on the total dissolved solids (TDS) concentration and this, in turn, can be related to watershed bedrock types (Stallard & Edmond Reference Stallard and Edmond1983, Berner & Berner Reference Berner and Berner1996). Rivers and streams in areas with intensively weathered silicate-rich rocks can have TDS of < 20 mg l-1. Silicate-rich igneous rocks and metamorphic rocks and shales normally have rivers and streams with 20–40 mg l-1 TDS, while sedimentary rocks with abundant carbonates have rivers and streams with 40–250 mg l-1 TDS. Rivers and streams draining evaporitic rocks can have TDS > 250 mg l-1. TDS for the Taylor Valley streams range from ∼ 6 to ∼ 4000 mg l-1, but again demonstrate discrete geographic patterns. The highest values of TDS are from Santa Fe and Lyons streams, which are greatly influenced by the saline discharge, Blood Falls (e.g. Lyons et al. Reference Lyons, Welch, Snyder, Olesik, Graham, Marion and Poreda2005). Interestingly, Lyons Creek can have very low TDS values as well depending on the year sampled. This undoubtedly reflects the periodic discharge influence of Blood Falls. Streams with the lowest TDS are ones such as Mariah, Canada and Green in the western Fryxell basin, Lawson in the west Bonney basin, and Andersen in the Lake Hoare basin, and the streams flowing into Lake Chad - House, McKay and Wharton. With the exception of Wharton, all these latter streams have mean TDS of < 50 mg l-1. Only Canada has a mean TDS as low as < 20 mg l-1 (Table II). The south and east Fryxell basin streams such as Delta, Crescent, Harnish, VonGuerard, Aiken, and McKnight, as well as Priscu in the east Bonney basin have relatively high TDS (TDS ≥ 100 mg l-1). Thus the west Bonney basin streams with the strong influence of Blood Falls resemble global streams and rivers draining evaporitic environments or those found in extremely arid regions. The streams with the lowest TDS in Taylor Valley behave like a mixture of crystalline silicate rock-dominated and sedimentary rock watersheds, while streams with intermediate TDS more closely resemble solely sedimentary rock-dominated watersheds. The south and east Fryxell basin streams can have extensive hyporheic zone dynamics (Gooseff et al. Reference Gooseff, McKnight, Lyons and Blum2002) and the increased TDS are due in part to extensive chemical weathering within the hyporheic zones (Gooseff et al. Reference Gooseff, McKnight, Lyons and Blum2002, Maurice et al. Reference Maurice, McKnight, Leff, Fulghum and Gooseff2002) and they are closer to the ocean as noted above.
Average total dissolved solids (TDS) calculated for selected streams in Taylor Valley.

Taylor Valley streams in a global geochemical context
Surprisingly, the stream geochemistries of the Taylor Valley encompass the compositions of a wide range of much larger temperate and tropical river systems. For example, most major rivers of the world have > 50% Alk and between 10–30% Cl-+SO42- (Berner & Berner Reference Berner and Berner1996). The world average river water plots just to the H4SiO4 rich side of the Fryxell basin stream samples (Fig. 3). In fact, when considering the world’s largest rivers, the Taylor Valley streams plot either close to rivers that drain large areas of sedimentary rocks (e.g. Yangtze, Yukon, Danube, Rhine, Mississippi, Huang He and Ohio) or large rivers in arid climates (e.g. Rio Grande, Colorado, Pecos). The former have higher Alk percentages while the latter have higher Cl-+SO42- percentages (Berner & Berner Reference Berner and Berner1996). The only global rivers that are not well represented by the Taylor Valley streams are those that are more enriched in H4SiO4 that drain either old crystalline craton (e.g. Niger, Amazon, Orinoco, Guyana, and Congo) or those draining tectonically active volcanic terranes.
Interestingly, a small number of the Taylor Valley streams would be considered “non-pristine” based on their NO3- and/or SRP concentrations. When looking at large global rivers, concentrations > 25 μM for NO3- and > 1 μM SRP have been determined “non-pristine” (Berner & Berner Reference Berner and Berner1996). As noted above, the NO3--rich streams occur in the Bonney basin (Fig. 4). The Bonney basin tills are older and more NO3- has accumulated there (Barrett et al. Reference Barrett, Virginia, Lyons, McKnight, Priscu, Doran, Fountain, Wall and Moorhead2007). The Fryxell basin streams have the highest SRP, which reflect the youngest tills in the valley (Barrett et al. Reference Barrett, Virginia, Lyons, McKnight, Priscu, Doran, Fountain, Wall and Moorhead2007). Stream nutrient data from Antarctic locations, especially ones that are wetter than the McMurdo Dry Valleys such as Signy Island, are generally equal to or lower than what we report here with the mean values for NO3- ranging from 7.8–9.5 μM and SRP being 0.24 and 2.6 μM (Hodson Reference Hodson2006).
Ca-Mg-Alk dynamics and water evolution
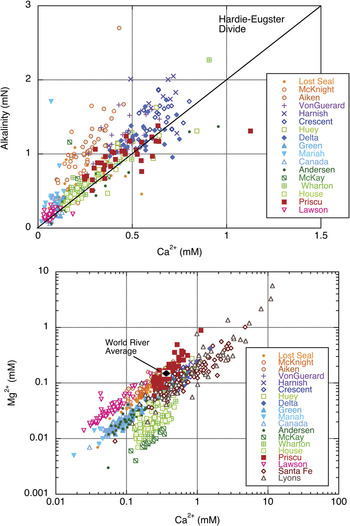
Green et al. (Reference Green, Angle and Chave1988) and Lyons et al. (Reference Lyons, Welch, Neumann, Toxey, McArthur, Williams, McKnight and Moorhead1998) argued that, based on the stream water chemistry entering lakes Hoare and Fryxell and using the evaporitic model of Hardie & Eugster (Reference Hardie and Eugster1970), these two Taylor Valley lakes (Fig. 1) should evolve to HCO3-Na+ rich waters and become depleted in Ca over time due to CaCO3 precipitation. Over 16 years of data support the same conclusion (Fig. 6). The Fryxell basin streams are particularly enriched in HCO3- relative to Ca2+, which according to the model leads to a HCO3- enriched, Ca2+ depleted, water over time.
Plot of alkalinity versus Ca2+ for selected Taylor Valley streams. The solid line represents the Hardie-Eugster divide as described in the text. Plot of Mg2+ versus Ca2+ for selected Taylor Valley streams. The world average river water composition is shown for reference.

In general, the Ca2+ concentrations in these streams are enriched relative to Mg2+ when compared to rivers and streams globally (Fig. 6). The average global riverine Mg/Ca ratio is 0.42, which reflects the overall importance of sedimentary rock dissolution (Berner & Berner Reference Berner and Berner1996). The east Fryxell basin streams along with Lawson Creek fall closest to this 0.42 mean, but all of the other streams are substantially lower than this value implying abundant sources of Ca2+ relative to Mg2+ throughout the rest of Taylor Valley. The streams with the lowest Mg/Ca ratios are the stream flowing into Lake Chad - Wharton, House and McKay. They also have Ca:Alk molar ratios close to 1:2 suggesting that CaCO3 is the primary source of Ca2+ into these streams (Fig. 6). CaCO3 is formed as salt crusts and coatings throughout Taylor Valley (Keys & Williams Reference Keys and Williams1981, Foley et al. Reference Foley, Lyons, Barrett and Virginia2006). Although some of this CaCO3 is formed in place (i.e. pedogenic), much of it was deposited as lacustrine CaCO3 during higher lake stands (Doran et al. Reference Doran, Wharton and Lyons1994). Wetting and sublimation may add additional CaCO3 around the stream margins, which later can be dissolved and transported. The significance of wetting and drying on stream geochemistry has not been investigated in Taylor Valley, but in warm desert regions it can ultimately lead to differential solubilization of ions to stream waters (Smith & Drever Reference Smith and Drever1976).
Stream chemistry and hydrology under future climate change scenarios
Future climate scenarios suggest that Antarctic regions including the McMurdo Dry Valleys will gradually warm (Chapman & Walsh Reference Chapman and Walsh2007). This warming will lead to increased glacier melt, more stream flow and hence higher lake levels. The development of warmer, wetter conditions will have important consequences for the aquatic ecology and geochemistry of these systems, some of which has already been discussed (Lyons et al. Reference Lyons, Laybourn-Parry, Welch and Priscu2006). Increased stream flow has been shown to lead to increased stream bed scouring and loss of benthic algal materials (McKnight et al. Reference McKnight, Niyogi, Alger, Bomblies, Conovitz and Tate1999). Increased volume of stream flow will increase the hyporheic zone and perhaps lead to enhanced chemical weathering and mobilization of salts. These changes, in turn, will affect the geochemistry of the stream water. Increased connectivity between the terrestrial and aquatic portions of the landscape will occur (Harris et al. Reference Harris, Carey, Welch, Lyons and Fountain2007). Hence we predict that solute mobility will increase in a warmer, wetter Taylor Valley with higher fluxes of soluble constituents occurring in these streams. As lake levels rise, stream lengths will decrease and in some cases, some shorter streams could disappear completely so that meltwater would flow directly from the glaciers to the lakes. In this case, direct connection to the terrestrial landscape and its source of solutes would cease, probably decreasing solute fluxes. Therefore, one might envision an increase in TDS then after a time of lake level rise, a decrease in the TDS of the streams and lake surface waters.
Conclusions
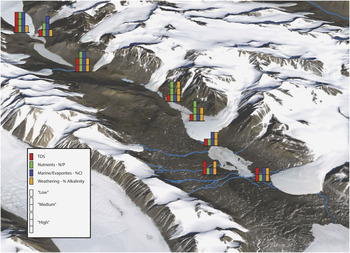
The major differences in the stream geochemistry with landscape position in Taylor Valley are depicted in Fig. 7. A number of general conclusions can also be drawn from our analysis. Although there is not a strong relationship between stream length and TDS, solute concentrations tend to be higher in the longer streams such as those draining the south side of the Lake Fryxell basin and sea-salt derived ions tend to be higher in streams that are closer to the ocean as well as those that drain the Taylor Glacier in western Taylor Valley. Chemical weathering is an important process influencing stream chemistry throughout the Dry Valleys, as evidenced by the presence of H4SiO4, but appears to be particularly important in the lower elevation of the Fryxell basin streams. In these streams, intensive hyporheic dynamics aid in chemical weathering. The dominant cation in the Dry Valley streams is calcium and bicarbonate is the dominant anion on an equivalent basis, although landscape position plays an important role in solute variation. Nutrient availability in streams is dependent on landscape age and varies from the coast/inland with higher N/P ratios in the streams further inland.
Map view summarizing the spatial variation in stream chemistry observed in Taylor Valley.

Acknowledgements
We thank all of the members of the stream team spanning the past 16 years. We would like to thank the two anonymous reviewers whose careful review and comments greatly improved this manuscript. This manuscript is Byrd Polar Research Center contribution number C-1399. This work was supported by National Science Foundation grants, OPP-9211773, OPP-9813061 and OPP ANT-0423595.