


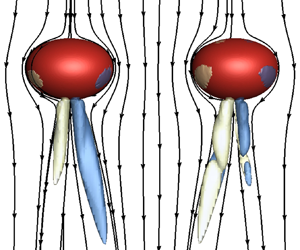

1. Introduction
Bubbly flows are commonly encountered in both metallurgic and chemical engineering applications, where bubbles are generated or injected into the reactors to create a global motion or turbulent mixing in an initially quiescent liquid. Under such circumstances, the flow characteristics are greatly dependent on the bubble distributions and their local volume fractions. In particular, for metallurgical refining or melting operations using bubbly flows, external magnetic fields (MFs) are one of the few potential tools available to control the bubble motion, with the objective of homogenizing the physical and chemical properties of the liquid metal. Consequently, the combination of external MFs and gas bubble injections enables the liquid metal to produce an optimized environment for the final product quality. Nevertheless, to the best of the authors’ knowledge, the understanding of such bubbly flows under magnetohydrodynamics (MHD) effects is far from satisfactory, and more seriously, how an external MF affects the interactions between one pair of bubbles remains unclear.
Early studies (Smereka Reference Smereka1993; Sangani & Didwania Reference Sangani and Didwania1993) regard the irrotational theory as a valid model to compute bubbly suspension within a flow, and the formation of horizontal bubble clusters is obtained. However, this result is contrary to the experimental observations (Lammers & Biesheuvel Reference Lammers and Biesheuvel1996) and the numerical results (Bunner & Tryggvason Reference Bunner and Tryggvason2002; Loisy, Naso & Spelt Reference Loisy, Naso and Spelt2017); they find that the bubbles distribute homogeneously within the flow. This highlights the fact that the bubble interactions inside the plume are highly influenced by the vorticity effects and the bubble deformations, which are neglected in the potential flow assumption. In particular, two bubbles rising side by side, which is viewed as the most simplified configuration for bubble interaction, has been studied to obtain a better understanding of the mechanisms governing the bubble interactions. Legendre, Magnaudet & Mougin (Reference Legendre, Magnaudet and Mougin2003) numerically find that, for a spherical bubble pair, whether they will repel or attract one another depends on the rise Reynolds number ( $Re$), which characterizes the balance between the blocking effect owing to the vorticity diffusion and the attractive force because of the irrotational mechanism. More recently, the influence of the bubble deformation, which beyond a critical value produces an unstable wake, was reported by Zhang, Chen & Ni (Reference Zhang, Chen and Ni2019) such that the double-threaded vortices are found to play a significant role in causing the bubble pair to bounce off. With respect to the experimental studies, Duineveld (Reference Duineveld1998) and Sanada et al. (Reference Sanada, Sato, Shirota and Watanabe2009) find one pair of bubbles rising in water and silicon oils always attract each other after being released, but whether they will coalesce or bounce highly depends on the collision and the rise velocities. Moreover, the visualization technology identifies that the wakes behind the bubbles collide with each other during the bubble collision. Recent experiments conducted by Kong et al. (Reference Kong, Mirsandi, Buist, Peters, Baltussen and Kuipers2019) have also addressed the importance of the bubble wakes because the path instability is triggered in the presence of another bubble.
On the other hand, in the presence of external MFs, although the gas bubble will not experience a direct force due to the electrically non-conducting properties, the rising bubble provokes the flow in an ambient liquid metal which is strongly affected by the induced Lorentz force, and hence indirect MHD consequences are imposed on the bubble motion. However, the relevant studies are relatively scarce, and the reason could be ascribed to two aspects: the first difficulty is due to the opacity of the liquid metal, rendering it very difficult to obtain both qualitative and quantitative experimental results by applying common optical techniques, and therefore, either the developments of the vortex structures or the flow field in the vicinity of the bubble is unclear; the second problem comes from the coupling of the multi-physical fields, including the free surface, the liquid flow and the electromagnetic field, since this adds to the difficulty in solving the governing MHD equations numerically. But, even so, the MHD effects on the motion of an isolated bubble have become clearer in recent years (Zhang, Eckert & Gerbeth Reference Zhang, Eckert and Gerbeth2005; Schwarz & Fröhlich Reference Schwarz and Fröhlich2014; Zhang & Ni Reference Zhang and Ni2014b; Jin et al. Reference Jin, Kumar, Vanka and Thomas2016; Zhang, Ni & Moreau Reference Zhang, Ni and Moreau2016; Richter et al. Reference Richter, Keplinger, Shevchenko, Wondrak, Eckert, Eckert and Odenbach2018), and the main findings are summarized as follows: a streamwise MF is found to make the twisted vortex structures more straight and parallel along the streamwise direction in an isotropic manner, while a horizontal MF produces an anisotropic effect on the flow field and the bubble shape. More recently, Pan, Zhang & Ni (Reference Pan, Zhang and Ni2018) and Delacroix & Davoust (Reference Delacroix and Davoust2018) also found similar anisotropic effects in numerical simulations about the flow past a sphere in the presence of a horizontal MF. Actually, it has been a long time since Sommeria & Moreau (Reference Sommeria and Moreau1982) reported that the vorticity axis tended to align with the MF lines, because a spreading of momentum along the MF lines led to a preferential formation of the flow structures parallel to the MF, yielding a more homogeneous flow field along the MF lines to decline the Joule dissipation. Such an anisotropic effect is also very remarkable in MHD jet flows (Davidson Reference Davidson1995) and MHD turbulence (Krasnov et al. Reference Krasnov, Rossi, Zikanov and Boeck2008a,Reference Krasnov, Zikanov, Schumacher and Boeckb) if the field is transverse to the flow direction.
Things become more complicated in the MHD bubbly flows; most of the experimental studies are reported by the MHD research group in Dresden, Germany (Eckert, Gerbeth & Lielausis Reference Eckert, Gerbeth and Lielausis2000a,Reference Eckert, Gerbeth and Lielausisb; Zhang, Eckert & Berbeth Reference Zhang, Eckert and Berbeth2007; Zhang Reference Zhang2009; Keplinger, Shevchenko & Eckert Reference Keplinger, Shevchenko and Eckert2019), who use the ultrasound Doppler velocimetry measurement to detect the bubble velocities and distributions, and they observe an isotropic distribution of the gas phase under streamwise MFs and an anisotropic distribution under horizontal MFs. Later Miao et al. (Reference Miao, Lucas, Ren, Eckert and Gerbeth2013) confirmed their experimental results numerically by incorporating a turbulent model into the commercial software ANSYS CFX, and so far as the authors know, this is the only numerical study which places attention on more than one bubble rising in MHD flows. Wiederhold, Boeck & Resagk (Reference Wiederhold, Boeck and Resagk2017) also developed a method to detect and to measure the size and velocity of elongated bubbles or drops in a dispersed two-phase flow by using MFs. In addition, some much earlier experiments conducted by Gherson & Lykoudis (Reference Gherson and Lykoudis1984) and Michiyoshi (Reference Michiyoshi1989) also found the anisotropic effect in the presence of a horizontal MF, however, the quantitative results are different. Nevertheless, the interaction between neighbouring bubbles and the corresponding vortex developments are not the focus of their study due to the opacity of the liquid metal; as a consequence, the in-depth mechanisms leading to different bubble distributions under different MFs are unclear yet.
Focusing on the side-by-side configuration, the present study aims to clarify how external MFs, probably varying in magnitude and direction, affect the interactions between a pair of bubbles, and the results can shed some light on more complex situations concerning MHD effects on the bubbly flows. Also, by tracking the evolution of the flow fields and the vortex structures, the numerical results help us comprehend the anisotropic effect of the non-streamwise MF. For this purpose, three-dimensional time-dependent computations are carried out using the open-source code Gerris developed by Popinet (Reference Popinet2009), and the MHD solver developed in our previous studies (Zhang & Ni Reference Zhang and Ni2014b; Zhang et al. Reference Zhang, Ni and Moreau2016) which has been implemented into the code. Note that the complete validation for an isolated bubble rising in liquid metal under MFs could be also found in those references. Moreover, the adaptive mesh refinement (AMR) technique, supported by a specific criterion developed by Zhang et al. (Reference Zhang, Chen and Ni2019), makes it possible to locally refine the meshes inside the thin film between the two bubbles when they get very close, and thus the numerical coalescence could be delayed or prevented to a large extent. This paper is organized as follows. Section 2 states the problem and describes the numerical methods, some important dimensionless parameters are also introduced. Sections 3–5 present the numerical results for a pair of bubbles rising side by side without/with a MF, which is applied in the streamwise or horizontal direction, and the physical mechanisms concerning the MHD effects on the bubble interactions are highlighted from the aspects of vortex developments. Finally, the conclusions and perspectives are presented in § 6.
2. Problem statement and the numerical method
A pair of spherical argon bubbles, with diameters of  $D$, are released side by side in liquid GaInSn near the bottom of the numerical tank, they are initially separated by a distance of
 $S$ between the bubble centroid and then rise and deform under gravity. We choose liquid GaInSn as the working fluid because this is in accordance with most of the available experiments owing to its liquid attribute at room temperature. Note that we do not concern ourselves with the formation of the bubbles in liquid GaInSn; Mirsandi et al. (Reference Mirsandi, Baltussen, Peters, van Odyck, van Oord, van der Plas and Kuipers2020) showed differences of the detached bubbles in a liquid metal–argon system compared with those in a water–air system. Figure 1 specifies a spanwise configuration which means the external MF is parallel to the line connecting the bubble centroid, and the other two situations are that the streamwise MF is parallel with the gravity and the transverse MF is perpendicular to the
 $XOY$ plane. The three-dimensional domain is
 $60D$ high and has a horizontal cross-section of
 $20D \times 20D$; note that such a computational domain was also used in our previous study (Zhang et al. Reference Zhang, Chen and Ni2019).
Sketch of a pair of bubbles rising in a liquid metal under the influence of a spanwise MF.

The rise of an incompressible bubble exposed to an external MF is governed by the combination of the Navier–Stokes equations and the simplified Maxwell equations, given as
 \begin{gather} \rho\left(\frac{\partial {\boldsymbol{u}}}{\partial t}+{\boldsymbol{u}}\boldsymbol{\cdot} \boldsymbol{\nabla}{\boldsymbol{u}}\right)={-}\boldsymbol{\nabla} p + \boldsymbol{\nabla}\boldsymbol{\cdot}\mu(\boldsymbol{\nabla}{\boldsymbol{u}}+ \boldsymbol{\nabla}{\boldsymbol{u}}^{T})+\sigma\kappa\delta_{s}{\boldsymbol{n}}+\rho {\boldsymbol{g}}+{\boldsymbol{F}}_{l} \end{gather}
 \begin{gather}\boldsymbol{\nabla}\boldsymbol{\cdot} {\boldsymbol{u}}= 0 \end{gather}
 \begin{gather}{\boldsymbol{J}} = \sigma_e(-\boldsymbol{\nabla}\varphi + {\boldsymbol{u}}\times{\boldsymbol{B}}) \end{gather}
 \begin{gather}\boldsymbol{\nabla}\boldsymbol{\cdot}(\sigma_e\boldsymbol{\nabla}\varphi) =\boldsymbol{\nabla}\boldsymbol{\cdot}(\sigma_e{\boldsymbol{u}}\times{\boldsymbol{B}}) \end{gather}
where  $\rho$ and
 $\mu$ denote the density and dynamic viscosity of the two fluids and
 $\boldsymbol{g}$ is the gravitational acceleration. Besides,
 $\sigma$ and
 $\kappa$ are the surface tension coefficient and the interface curvature, respectively, while
 ${\boldsymbol {n}}$ is the normal direction of the interface and
 $\delta _s$ the Dirac distribution function;
 ${\boldsymbol {F}}_{l}={\boldsymbol {J}}\times {\boldsymbol {B}}$ represents the Lorentz force with
 ${\boldsymbol {J}}$ denoting the induced current density and
 ${\boldsymbol {B}}$ the external MF. Note that the induced MF can be neglected in the present study because of the very small magnetic Reynolds number (
 $Re_{m} = \mu _m\sigma _eDu_T\ll 1$, with
 $\mu _m$ denoting the magnetic permeability and
 $\sigma _e$ the electrical conductivity,
 $u_T$ is the terminal rise velocity of the bubble) in liquid metal, as indicated by Sommeria & Moreau (Reference Sommeria and Moreau1982). Besides, the induced current density is calculated from Ohm's law as revealed by (2.3), where
 $\varphi$ is the induced electric potential. Due to the conservative property of the charge, a divergence-free condition of
 $\boldsymbol {\nabla }\boldsymbol {\cdot }{\boldsymbol {J}}=0$ should be preserved such that an additional electric potential Poisson equation needs to be solved, given as (2.4). The liquid–gas interface is advanced through computing the volume fraction of the disperse phase by using the volume-of-fluid method, and then the physical properties of the system, i.e.
 $\rho$,
 $\mu$ and
 $\sigma _e$, are updated in the next timestep through a volume averaged scheme (Popinet Reference Popinet2009).
Based on the above governing equations, some dimensionless parameters are defined to govern the rise behaviour of the bubble motion exposed to an external MF, as listed in table 1, where the subscript  $1$ denotes the properties of the liquid metal. Since the Reynolds number (
 $Re$), Weber number (
 $We$), Galilei number (
 $Ga$) and Bond number (
 $Bo$) are well known to this research community and they are already described by many other papers (Tripathi, Sahu & Govindarajan Reference Tripathi, Sahu and Govindarajan2015; Cano-Lozano et al. Reference Cano-Lozano, Martinez-Bazan, Magnaudet and Tchoufag2016), only the interaction parameter
 $N_o$ is new here, which characterizes the ratio between the electromagnetic force and the inertial force. Moreover, since
 $N_o$ depends on the terminal velocity of the bubble which is unknown a priori before finishing the numerical simulation, we thus introduce a variant interaction parameter as
 $N$ by replacing
 $u_T$ with the gravitational velocity
 $\sqrt {gD}$ so that
 $N$ describes the ratio of the electromagnetic force to the gravity. Besides, by introducing different characteristic scales, all the variables are non-dimensionalized throughout this paper, respectively as
 $L^{*}=L/D$,
 $t^{*}=t\sqrt {g/D}$,
 $\textit {u}^{*}=\textit {u}/\sqrt {gD}$ and
 $\boldsymbol {\omega }^{*}=\boldsymbol {\omega } \sqrt {D/g}$. Another important dimensionless parameter is the aspect ratio of the bubble shape, given as
 $\chi =b/a$, denoting the length ratio of the major axis to the minor axis of the bubble, however, note that the bubble becomes less fore-aft symmetric as its size increases and thus a fully ellipsoidal bubble is hardly observed. Table 2 shows the physical properties of the liquid GaInSn–argon system as used by Zhang (Reference Zhang2009) in experiments, and we adopt them throughout the present numerical simulations.
Dimensionless parameters for the description of the bubble motion exposed to an external MF.

Physical properties of liquid GaInSn and gas argon (Zhang Reference Zhang2009).

Then, the investigated rising bubble, with diameter in the range  $2\ \textrm{mm} \sim 4\ \textrm {mm}$, has a terminal
 $Re \simeq (2000\sim 3000)$, a terminal
 $We \simeq (2\sim 4)$ and a terminal
 $N_o$ changing between
 $0$ and
 $1.6$ with the varied external MFs herein; note that the variant interaction parameter is now in a range of
 $0 < N < 2.24$. At the bottom and the lateral walls of the domain no-slip and impermeability conditions are used, while at the top of the domain free-outflow conditions are imposed. When computing the electromagnetic field, the electrical potential is applied with homogeneous Neumann boundary conditions on all walls, given as
 $\partial \varphi /\partial n = 0$ so that the current density cannot penetrate the bottom and lateral walls.
The numerical results to be discussed below, unless otherwise stated, are still obtained by solving the three-dimensional Navier–Stokes equations with the open-source software of the Gerris flow solver developed by Popinet (Reference Popinet2009), which is also used by Zhang et al. (Reference Zhang, Chen and Ni2019) and Tripathi et al. (Reference Tripathi, Premlata, Sahu and Govindarajan2017) to study the hydrodynamic interactions between two bubbles. Moreover, by employing the consistent and conservative scheme developed by Ni et al. (Reference Ni, Munipalli, Morley, Huang and Abdou2007) and Zhang & Ni (Reference Zhang and Ni2014a) to solve the electromagnetic field, a MHD solver has been implemented into Gerris for the simulation of multiphase MHD flows, especially that of an isolated bubble in motion in a liquid metal (Zhang & Ni Reference Zhang and Ni2014b; Zhang et al. Reference Zhang, Ni and Moreau2016). Because numerous tests have been provided in the aforementioned references for validation of the numerical method, now we only focus to two particular aspects arisen from the bubble pair problem; one is the confinement effect of the computational domain and the other is to justify the choice of the spatial resolution when the two bubbles become very close during the collision.
The computational domain is spatially discretized by using a ‘topology based AMR technique’, which indicates the meshes inside the gap between the bubble pair will be refined locally and automatically as the bubbles approach one another, while the mesh sizes are untouched along the bubble interface in other regions. In particular, in the present study, the maximum mesh resolution of  $\varDelta _{gap}=D/800$ based on the topology AMR, together with
 $\varDelta _{bubble}=D/64$ in the vicinity of the bubble interface and
 $\varDelta _{wake}=D/32$ inside the wake region, are adopted to study the interactions between the pair of bubbles. If the thickness of the film between the bubbles is thinner than a prescribed value of
 $\varDelta _{gap}=D/800$, we let them coalesce numerically. Such a strategy of spatial resolution was proposed by Zhang et al. (Reference Zhang, Chen and Ni2019) and we will not provide more details. The numerical validations are presented in the supplementary material available at https://doi.org/10.1017/jfm.2021.695 (§ 1), where we identify that a domain width of
 $20D$ enables the boundary effects to be ignored, and the topology based AMR is also effective to delay or even prevent the numerical coalescence. In addition, the completion of a numerical case usually requires approximately two months on a workstation which has 24 processors (Intel(R) Xeon(R) E5 – 2630 v3) by using the Intel MPI library for parallel computations.
Besides, to qualitatively describe the influence of an external MF upon the flow field, sometimes a frozen bubble may be better because the unsteady spatio-temporal evolutions, i.e. the continuously deforming bubble shape and the varying separation distance, could be eliminated. For this reason, an in-house code, which solves the complete governing equations (2.1)–(2.4) for MHD flow past frozen bubbles, is used as a subsidiary numerical tool to illustrate the MHD effects on the wake behind the bubble and several sketch maps are provided throughout the present study. Moreover, this numerical solver has already been proven to be accurate in simulating the MHD flow past a rigid sphere with body-fitted grids, as presented by Pan et al. (Reference Pan, Zhang and Ni2018) and Pan, Zhang & Ni (Reference Pan, Zhang and Ni2019). Herein, we just replace the rigid sphere by an (two) oblate bubble(s) through imposing the free-slip boundary condition at the bubble interface. The complete validations of this numerical method could be found in the supplementary material (§ 2), and we call it NM2 in the following sections.
3. Bubble interactions without applying MF
As a first step, the hydrodynamic characteristics of different bubble pairs rising in GaInSn are studied. Three different bubble sizes are considered here with  $D=2.0$ mm,
 $D=3.0$ mm and
 $D=4.0$ mm, while the corresponding Galilei numbers and the Bond numbers are
 $\{(Ga,Bo)\sim (809.61, 0.47), (1487.29, 1.05), (2289.78, 1.87)\}$, however, note that we will still use the bubble diameter
 $D$ but not
 $Ga$ or
 $Bo$ to differentiate different pairs in the following study because the bubble size is more intuitive in an unchanged liquid. The initial separation between the bubble pair is fixed at
 $S=2D$, which indicates the gap between the bubble pair has a width of one diameter. The front views (
 $XOY$) of the rise paths, referring to the positions of the bubble centroid throughout the present study, are displayed in figure 2(a,b,c), while their bottom views (
 $XOZ$) before bubble coalescence are shown in panels (d,e,f). Note that, for better illustration, the rise paths of the corresponding isolated bubble (
 $S=\infty$) are also displayed with the black dash-dotted lines, while their vortex structures are portrayed in figure 2(d–f) with the
 $\lambda _2$ iso-surfaces (Jeong & Hussain Reference Jeong and Hussain1995) of
 $\lambda _2=-0.2$ and the streamwise vorticity of
 $\omega _y=\pm 4$. It is clear that, in case of
 $D=2.0$ mm, which corresponds to an oblique rise path for an isolated bubble, the bubble pair coalesce directly once they come into contact with each other at a height of
 $Y=5$. However, when the bubble size increases to
 $D=3.0$ mm, an isolated bubble displays a chaotic motion, a bounce first happens at a height of
 $Y=5.5$ while a coalescence follows at
 $Y=16$. Furthermore, if the bubble size grows to
 $D=4.0$ mm, an oscillatory zigzag motion without bounce is observed between the bubble pair, while the isolated bubble is also found to rise in a zigzag path. This variation tendency reveals two characteristics, in one respect, increasing the bubble size causes the bubble interaction to transition from coalescence to bounce, and on the other hand, the bubble interaction is highly dependent on the rise behaviour of an isolated bubble.
Rise paths of different bubble pairs, whose sizes are varied as (a,d)  $D=2.0$ mm, (b,e)
 $D=3.0$ mm and (c,f)
 $D=4.0$ mm while the initial separation is fixed at
 $S=2D$. (a–c) Front views; (d–f) bottom views. Red and blue lines correspond to the positions of the bubble centroids in one pair, and black dash-dotted line denotes that of the isolated bubble. Iso-contours in (d–f) display the vortex structures behind the isolated bubble, corresponding to the iso-values of
 $\lambda _2=-0.2$ (c) and
 $\omega _y=\pm 4$ (d), respectively.

Snapshots of the three-dimensional streamlines past the two bubbles are plotted in figure 3, which corresponds to a size of  $D=3$ mm, and the contour maps describe the distributions of the streamwise velocity field. It is observed that, when the two bubbles are greatly separated, i.e. at
 $t=1.84$, the streamlines past the left bubble converge to the red dotted line, which is almost coincident with the centre of the bubble rear, and thus an axisymmetrical structure is maintained. However, as the two bubbles get closer, i.e. from
 $t=1.84$ to
 $t=3.33$, the converging line shifts to the interior side gradually, and eventually almost coincides with the edge of the left bubble. Such flow asymmetries, undoubtedly, are the source of the double-threaded streamwise vortices owing to the tilting/stretching term in the vorticity transport equation, given as
 $\textrm {d}\omega _y/\textrm {d}t \sim \omega _\vartheta \partial u_y/\partial \vartheta$. Clearly,
 $u_y$ becomes inhomogeneous in the azimuthal direction (
 $\vartheta$) during the approach of the bubble pair. This effect is also known to be very important in controlling the migration of an isolated bubble in a shear flow, as numerically studied by Adoua, Legendre & Magnaudet (Reference Adoua, Legendre and Magnaudet2009). This also explains why a larger bubble pair more easily bounce off each other, it is because the increased aspect ratio and the enhanced shear flow inside the gap will intensify the strength of the streamwise vortices. Keep in mind that, in experiments (Duineveld (Reference Duineveld1998), Sanada et al. (Reference Sanada, Sato, Shirota and Watanabe2009), Kong et al. (Reference Kong, Mirsandi, Buist, Peters, Baltussen and Kuipers2019), it is also found that such double-threaded vortices are generated during the approach of two bubbles by increasing their size.
Three-dimensional velocity streamlines past the left bubble within one pair at  $D=3.0$ mm in the reference frame of the bubble; the contour maps describe the iso-values of the streamwise velocity field.

After understanding the importance of the collision induced vortices during the bubble interaction, now we come to another problem discovered by Duineveld (Reference Duineveld1998), who find there is a transition state between ‘direct coalescence’ and ‘bounce separation’, known as ‘bounce coalescence’, but it has never been reported in other studies. Then, we investigate the bubbles pairs with  $D=2.5$ and
 $D=3$ mm, and the snapshots of their shapes and the streamwise wake vortices
 $\omega _y=\pm 4$ are presented in figure 4. Note that the displayed time period is very short, i.e. for
 $D=2.5$ mm, the starting dimensionless time moment is
 $t_0=2.90$ with an interval of
 $\Delta t=0.066$ (
 $\Delta Y < 0.13$) between two successive pictures, and they are
 $t_0=2.90$ and
 $\Delta t=0.13$ for
 $D=3.0$ mm. In each panel, the wake vortices are only displayed every two pictures while others just portray the bubble shapes. At
 $D=2.5\ {\rm mm}$, the bubble pair bounce off at the first touch, then they perform shape oscillations and approach again until coalescing at the second touch. On the contrary, a separation follows the second touch in the case of
 $D=3$ mm. Keep in mind that such a process is too short to be distinguished from the full rise path shown in figure 2(b). More quantitatively, Duineveld (Reference Duineveld1998) find that the time between the two touches is very close to one period of the second mode surface oscillation, while this agreement could be also identified from the experiments of Sanada et al. (Reference Sanada, Sato, Shirota and Watanabe2009) (figure 7 in their paper). From figure 4, the calculations reveal that the dimensionless time between the two touches is
 $\Delta t_n = 0.66$ (
 $0.78$) for
 $D=2.5$ mm (3 mm), while the period of the
 $n=2$ shape oscillation is
 $\Delta t_m = 0.55$ (0.66) in theory, and a deviation of
 $20\,\%$ could be estimated from the comparisons. Besides, the entire snapshots using
 $\omega _y$ and
 $\lambda _2$ criteria for all bubble pairs could be found in the supplementary material (§ 3).
Snapshots of the streamwise wake vortices  $\omega _y=\pm 4$ during the bubble collision corresponding to (a)
 $D=2.5$ mm, (b)
 $D=3$ mm. Note that, for better readability, the vortex structures are only displayed every two pictures, and the black dotted boxes indicate those moments when the two bubbles coalesce, bounce and separate. In (a) the first image is at
 $t_0=2.90$ and the time interval is
 $\Delta t=0.066$, and they are
 $t_0=2.90$ and
 $\Delta t=0.13$ in (b).

In order to find a criterion to identify the transition border between different interactive patterns, Duineveld (Reference Duineveld1998) proposed two critical Weber numbers, one is  $We_c = \rho _1\Delta u_x^{2}D/2\sigma$, depending on the collision velocity to distinguish direct coalescence and bounce coalescence, and the other is
 $We_r = \rho _1u_y^{2}D/\sigma$, based on the rise velocity to separate bounce coalescence and bounce separation; their critical values are
 $We_c \approx 0.18\pm 0.03$ and
 $We_r \approx 2.6\pm 0.3$, respectively. Later, by using different liquids in experiments, Sanada et al. (Reference Sanada, Sato, Shirota and Watanabe2009) argued that whether the two bubbles would coalesce or bounce actually depends on the rise Weber number, but they do not distinguish between direct coalescence and bouncing coalescence as Duineveld does. Although the physical properties of the liquid metal differ significantly from those of water and silicon oils, however, we still compute the collision velocity, the rise velocity and the film thickness between the two bubbles, their time histories are illustrated in figure 5. Note that, in the present study, different components of the bubble velocity are estimated though a volume averaged scheme over all discrete cells inside the bubble, for instance
 $u_{\langle x, left\rangle } = \sum u_{\langle x, i\rangle }\gamma _i/\sum \gamma _i$ with
 $i$ the discrete cell inside the left bubble and
 $\gamma$ the gas volume of the cell. In particular, the collision velocity between the bubble pair is defined as
 $\Delta u_x = u_{\langle x, left\rangle } - u_{\langle x, right\rangle }$. In the picture, the embedded iso-surfaces are the bubble shapes at different time moments as marked by the circles, with hollow ones denoting bounce (separation) and solid ones coalescence, and the numbers are the Weber numbers
 $We_{c}$ depending on collision velocity at their first touch. We see that
 $We_{c}$ decreases from
 $D=2$ to
 $D = 4$ mm, and this result is apparently opposed to Duineveld's conclusion, revealing that a higher collision Weber number does not necessarily lead to a bounce interaction at first touch. This divergence should be ascribed to different characteristics of the bubble pairs rising in water and liquid GaInSn. In the latter case, the production of the double-threaded vortices is already very significant during the bubble approach (see figure 4), and thus the repulsive lift forces is strong enough to reduce the approach velocity as the bubbles become larger, however, for small bubbles (
 $D<1.8$ mm studied by Duineveld Reference Duineveld1998) rising in water, the production of the double-threaded vortices should not be so obvious. Then, in figure 5(b), we find that the thickness of the thin liquid film oscillates over time after the first bounce at
 $D = 2.5$ and
 $D = 3$ mm, and it must be ascribed to the shape oscillations so that, when the bubbles stretch, they may coalesce or bounce again depending on the repulsive force provided by the vortex interactions (see figure 4). In figure 5(c), the rise Weber number
 $We_{r}$ is positively correlated to the bubble size, and the border between bouncing coalesce and bouncing separation is almost
 $We_{r} = 2.50\sim 3.04$, which is very close to the value proposed by Duineveld (Reference Duineveld1998), and thus we think this Weber number is better used to distinguish the coalescence and bounce interactions between the bubble pair in the hydrodynamic cases.
Time histories of (a) the collision velocity defined by  $\Delta u_x = u_{\langle x, left\rangle } - u_{\langle x,right\rangle }$, (b) the film thickness between the bubble pair and (c) the rise velocity for different bubble pairs. In (a), the embedded iso-surfaces are the bubble shapes at different times as marked by the circles, with hollow ones denoting bounce (separation) and solid ones coalescence, and the numbers are the collision Weber number
 $We_c = \rho _1\Delta u_x^{2}D/2\sigma$ depending on collision velocity at their first touch. In (c), the rise velocity based Weber numbers
 $We_r = \rho _1u_y^{2}D/\sigma$ are also calculated.

In summary, in this section we show that the developments of the streamwise vortices during bubble collision play a key role in causing the two bubbles to bounce off each other, and this will be the basic argument when we consider the influences of the external MFs on the bubble interactions. Accordingly, the streamwise vortices but not other vortex structures are displayed and discussed in the following sections. In addition, note that, by varying the separation distance and the bubble size in this problem, there are three controlling parameters of  $\{Ga, Bo, S\}$, and imposing an external MF adds to the difficulty with another two parameters: the magnitude and the direction. Correspondingly, it is nearly impossible to draw a full map containing all of the five parameters in three-dimensional numerical simulations. Alternatively, as the present study aims to detect the underlying mechanisms caused by the external MF, we will just focus on one particular bubble pair of
 $D=3$ mm (
 $\{(Ga, Bo, S)\sim (1487.29, 1.05, 2)\}$) throughout this paper, and the MF direction and strength are varied. After that, the MHD effects on other bubble pairs could be inferred from our previous study (Zhang et al. Reference Zhang, Chen and Ni2019), in which the influences of
 $\{Ga, Bo, S\}$ have been investigated in hydrodynamic cases.
4. Influences of the streamwise (vertical) MF
The influences of the streamwise MFs on the rise behaviours of the bubble pair are discussed in this section. Note that, for the case of an isolated bubble, some previous numerical studies (Schwarz & Fröhlich Reference Schwarz and Fröhlich2014; Zhang & Ni Reference Zhang and Ni2014b, Reference Zhang and Ni2017) already reveal that a streamwise MF makes an unstable bubble rise more rectilinearly, because the twisted trailing wakes are straightened along the streamwise direction owing to the MHD effects. However, things are different here because no path instability happens before the bubbles collide, and hence the influences of the neighbouring bubble require extra study.
4.1. Difference between an isolated bubble and a bubble pair
Figure 6 describes the differences between the isolated bubble case and the bubble pair case under a streamwise MF. Panel (a) illustrates the visual angle towards a horizontal plane at a distance of  $D$ downstream of the bubble centroid and panels (b,c) are the corresponding bottom views. Note that the results are obtained by NM2, with the parameters of
 $Re=100$,
 $N_o=2.0$ and
 $\chi =2.4$ that no vortex rings or streamwise vortices appear at the rear of the bubble(s), and the bubble pair have a separation of
 $S=1.5D$.
Sketch of the distribution of the current density (black streamlines) and the Lorentz forces (iso-contours) on the horizontal plane at a distance of  $D$ downwards the bubble centroid. (a) A sketch to describe the visual angle; (b) an isolated bubble case and (c) a bubble pair case. Panels (b,c) are obtained by NM2 with defined parameters of
 $Re=100$,
 $N_o=2.0$ and
 $\chi =2.4$, the bubble pair have a separation of
 $S=1.5D$. In (b,c), the red dashed lines are the projection of the bubble interface, the blue arrow lines are the Lorentz forces and the green dashed lines denote the induced Lorentz torque owing to the presence of the neighbouring bubble.

For an isolated bubble, figure 6(b) reveals that the current densities distribute in an axisymmetric way, and the distribution of the induced Lorentz forces, which are depicted by the iso-contours in the figure, is also fully axisymmetric. This is understandable by looking into the electrical potential equation (2.4) with a variant form of  $\nabla ^{2}\varphi ={\boldsymbol {B}}\boldsymbol {\cdot }{\boldsymbol {\omega }}$, by which we know
 $\nabla \varphi$ vanishes in the domain under a streamwise MF since the streamwise vorticity
 $\omega _y$ is zero everywhere owing to the rectilinearly rising path. Then, (2.3) is reduced to
 ${\boldsymbol {J}}=\sigma _e({\boldsymbol {u}}\times {\boldsymbol {B}})$, and hence the current densities just depend on the distribution of the radial velocity. However, when two bubbles rise side by side, as shown in figure 6(c), the distribution of the current densities are no longer axisymmetric because the flow does not converge at the centreline of the bubble rear (see figure 3) and the electric potential becomes asymmetric. Correspondingly, the induced Lorentz forces, which are also shown by the iso-contours in figure 6(c), are not axisymmetric anymore so the forces at the exterior of the bubble are found to be stronger than those in the interior. Under such circumstances, the induced Lorentz torque parallel to
 $B_y$ becomes non-zero and its calculation is referred to the formula given by Davidson (Reference Davidson1995)
 \begin{equation} H_y = [{\boldsymbol{x}}\times({\boldsymbol{J}}\times {\boldsymbol{B}})]\boldsymbol{\cdot} {\boldsymbol{B}} ={-} (B_y^{2}/2)\boldsymbol{\nabla}\boldsymbol{\cdot}(x^{2}_{{\perp}}{\boldsymbol{J}}), \end{equation}
where  $x_{\perp }$ is the transverse distance in the directions perpendicular to the MF. Clearly, for an isolated bubble, formula (4.1) implies that the Lorentz torque
 $H_y$ vanishes since
 $\boldsymbol {\nabla }\boldsymbol {\cdot }(x^{2}_{\perp }{\boldsymbol {J}})$ is zero owing to the axisymmetric distributions of the current density, however, we would also expect a non-zero
 $H_y$ for the bubble pair case because
 $\boldsymbol {\nabla }\boldsymbol {\cdot }(x^{2}_{\perp }{\boldsymbol {J}})$ is non-zero. Moreover, a positive (negative)
 $H_y$ is generated at the front (back) part of the left bubble, i.e.
 $z>0$ (
 $z<0$) in figure 6(c) because the Lorentz force decreases from the exterior position to the interior position. Therefore, the Lorentz torque induced streamwise vortices, as sketched by the green dashed line in figure 6(c), have the opposite signs to the collision induced vortices, which are dampened accordingly. As a consequence, the bouncing interaction should be also weakened.
4.2. Freely rising bubble pair in streamwise MFs
The numerical results of the freely rising bubble pair in a streamwise MF are discussed, by fixing their size at  $D=3$ mm and the initial separation at
 $S = 2$. The MF magnitude is varied in between
 $N=0$ (
 $N_o=0$),
 $0.058$ (
 $0.036$),
 $0.09$ (
 $0.056$),
 $0.20$ (
 $0.13$),
 $0.80$ (
 $0.50$) and
 $2.24$ (
 $1.60$), but only four of the cases are reported here. The rise trajectories together with the snapshots of the bubble shapes during collision are presented in figure 7(a–d), while the full set of the results can be found in the supplementary material (§ 4). It is clear that the two bubbles show an interaction of bounce separation at
 $N=0$, and transition to bounce coalescence at
 $N_y=0.09$, then, ultimately, a direct coalescence at
 $N_y\geqslant 0.2$. The results reveal that a stronger streamwise MF prefers to make the bubbles coalesce instead of bounce. A better understanding of this transition could be obtained from figure 7(e–h), which portrays the streamwise wake vortices
 $\omega _y=\pm 3.5$ at the collision moment for the corresponding MFs. We see that the wakes behind the bubble pair are significantly weakened by the streamwise MFs, and hence the repulsive lift force are reduced correspondingly. These results support the discussions in figure 6(c) that the Lorentz torque induced vortices offset those produced by the collision, and correspondingly, whether the bubble pair are about to coalesce or bounce highly depends on the developments of the wake vortices.
Rise characteristics of the bubble pairs exposed to different streamwise MFs ranging between  $N=0$ and
 $N_y=0.80$, while the bubble size is fixed at
 $D=3.0$ mm. (a–d) Rise paths and the snapshots of the bubble shapes during collision; note that the bottom image denotes
 $t_0=2.61$ and the time interval between two successive pictures
 $\Delta t = 0.334$. (e–h) Vortex structures of
 $\omega _y=\pm 3.5$ at the collision moment.

Then, a particular case of  $N_y=2.24$ is focused on to confirm the mechanisms, by noting that this streamwise MF is strong enough so that the Lorentz torque induced vortex pairs are expected to be dominant over the collision induced vortex pairs if the two bubble are not too close. In other words, when the two bubbles are separated with a moderate-to-large distance, the double-threaded vortices at
 $N_y=2.24$ must have opposite signs compared with those collision induced vortices at
 $N=0$. This is verified in figure 8(a) that depicts the wake vortices of
 $\omega _y=\pm 0.60$ at
 $N=0$, and (b) corresponds to the same wake vortices at
 $N_y=2.24$. Moreover, at the same time moment, figure 8(c) shows the contour maps of
 $H_y$ calculated from (4.1) on a horizontal plane at a distance of
 $D$ downwards from the bubble centroid, and obviously the results comply with the previous analysis in figure 6(c); a pair of non-zero Lorentz torque are produced. Therefore, a streamwise MF will undoubtedly weaken the wake vortices during the bubble collision through the Lorentz torque mechanism. Besides, the bubble deformation is also observed to decrease significantly from
 $N=0$ to
 $N_y=2.24$, and, as a consequence, the generated vortices are also reduced remarkably owing to a theoretical estimation of
 $\omega \propto \chi ^{8/3}$ given by Magnaudet & Mougin (Reference Magnaudet and Mougin2007).
Iso-surfaces of  $\omega _y=\pm 0.60$ around the bubble pair, corresponding to (a)
 $N=0$ and (b)
 $N_y=2.24$. Note that the two bubbles rise in an early stage so that they are not too close. (c) Describes the results corresponding to (b) on a horizontal plane at a distance of
 $D$ downwards from the bubble centroid, the contour map depicts the induced Lorentz torque (4.1), the black arrow lines are the current densities and the red dashed line is the projection of the bubble interface.

Furthermore, the time series of the collision velocities are presented in figure 9, where the weak-to-moderate streamwise MF is varied in the range  $0 \leq N_y \leq 0.20$. In the figure, the collision velocity shows a tendency of
 $\Delta u_{\langle x,N=0\rangle }<\Delta u_{\langle x,N=0.058\rangle }<\Delta u_{\langle x,N=0.090\rangle }<\Delta u_{\langle x,N=0.20\rangle }$ during the bubble approach before the first bounce. Correspondingly, it seems that a higher collision velocity prefers to lead the two bubbles to coalescence rather than bounce, and this is understandable because, under a stronger streamwise MF, the double-threaded vortices are dampened (see figure 7) more seriously, and hence the induced repulsive lift force is also reduced. Furthermore, if the streamwise MF is strengthened to
 $N\sim O(1)$, things would be different because the rise velocity of the bubble pair is decreased significantly under a moderate-to-strong MF and the flow field becomes more homogeneous, so that the attractive force between the two bubbles declines sharply.
Collision velocity between a pair of bubbles under different streamwise MFs, ranging between  $N=0$ and
 $N_y=0.20$.

5. Influences of the spanwise and transverse MFs
The influence of a horizontal MF on the motion of the bubble pair is investigated in this section. We should now keep in mind that the MHD effects are expected to be strongly dependent on the angle ( $\theta$) between the
 ${\boldsymbol {B}}$ lines and the line connecting the bubble centroids because a horizontal MF produces anisotropic effects which are already known in MHD turbulence (Sommeria & Moreau Reference Sommeria and Moreau1982) and MHD jet flows (Davidson Reference Davidson1995). To begin with, two extreme cases are discussed in detail, corresponding to the spanwise MF with
 $\theta =0^{\circ }$ being parallel to the bubble centroid line and the transverse MF with
 $\theta =90^{\circ }$ being perpendicular to the bubble centroid line. After that, the numerical results with different
 $\theta$ in the range
 $0^{\circ } \sim 90^{\circ }$ will be reported briefly.
5.1. Anisotropic MHD effects on an isolated bubble and bubble pair
Before discussing the influence of a horizontal MF on the bubble pair, the isolated bubble motion exposed to a horizontal MF should be unfolded first. Note that some of these characteristics have not been reported before, neither in experiments (Zhang Reference Zhang2009; Wang et al. Reference Wang, Wang, Meng and Ni2017; Richter et al. Reference Richter, Keplinger, Shevchenko, Wondrak, Eckert, Eckert and Odenbach2018) nor in numerical studies (Jin et al. Reference Jin, Kumar, Vanka and Thomas2016; Zhang et al. Reference Zhang, Ni and Moreau2016), so it is desirable to discuss them in detail herein. To begin with, we should be aware of the diffusion effects induced by a MF along the  ${\boldsymbol {B}}$ lines; they are governed by the following dimensionless equations derived from (2.1) (Sommeria & Moreau Reference Sommeria and Moreau1982; Davidson Reference Davidson1995)
 \begin{equation} \frac{\textrm{D}{\boldsymbol{u}}}{\textrm{D}t} ={-}\boldsymbol{\nabla} p^{*}+\frac{1}{Re}\nabla^{2}{\boldsymbol{u}}-N\nabla^{{-}2}[\partial^{2}{\boldsymbol{u}}/\partial x_{/{/}}^{2}], \end{equation}
where  $p^{*}$ is the augmented pressure, and the last term on the right-hand side of (5.1) is a variant form of the Lorentz force, given by
 ${\boldsymbol {F}}_l = N\nabla ^{-2}[\partial ^{2}{\boldsymbol {u}}/\partial x_{//}^{2}] + \boldsymbol {\nabla }\phi$ with the gradient term merely augmenting the fluid pressure. In addition, the subscript
 $//$ indicates the direction parallel to the
 ${\boldsymbol {B}}$ lines while
 $\nabla ^{-2}$ is an inverse of the Laplacian operator. As a consequence, the Lorentz force looks like a unidirectional diffusion term, and moreover, whether or not this diffusion produces any significant lengthening of
 $x_{//}$ depends on the magnitude of
 $N$.
The first consequence of such unidirectional diffusion is to produce the streamwise vorticities behind the bubble, as portrayed in figure 10 which is still obtained by using NM2 at  $Re=100$,
 $N_o=6.0$ and
 $\chi =2.4$. In figure 10(a,b), the iso-contours of the streamwise velocity
 $u_y$ are displayed on a transverse plane at a distance of
 $D$ downstream the bubble centroid, with the former picture denoting a hydrodynamic case and the latter one having a horizontal MF in the
 $x$-direction. Besides, the black arrow lines are the velocity streamlines and the red dashed line is the projection of the bubble interface. In the absence of a MF, the flows converge to the centre of the bubble rear so that a fully axisymmetric structure is formed. However, under a horizontal MF, the momentum of the flow diffuses out along the
 ${\boldsymbol {B}}$ lines, and the maximum ‘jet’ velocity is reduced accordingly. Then, the conservation of mass requires some of the surrounding fluid from other planes to be entrained by the diffused jet. This explains the bending of the velocity streamlines and the non-zero azimuthal component of the velocity in figure 10(b). Correspondingly, double pairs of streamwise vortices are produced at the rear of the bubble, as depicted by the blue lines, where the solid ones are for positive values and dashed ones are for negative values. For the isolated case, the vortex pairs have a structure of double-planar symmetry so that the lift force is zero, and the symmetrical planes are denoted by S1 and S2 in the picture. In order to differentiate them from the ‘Lorentz torque’ induced vortex pair under a streamwise MF, we call them ‘Lorentz diffusion’ induced vortices in the rest of the paper. In addition, a three-dimensional view of the streamlines past the bubble is given in figure 10(c); it is seen that the flows can converge to the rear centre on the plane S2 but cannot on the plane S1, and the blue dashed line denotes the non-central convergence position. Note that, so far as the authors know, such phenomena of Lorentz diffusion induced streamwise vortices have not been reported in the previous experimental or numerical studies on bubble motion.
Sketch obtained by using NM2 describing the influence of a horizontal MF on the motion of an isolated bubble; the parameters are  $Re=100$,
 $N_o=6.0$ and
 $\chi =2.4$. (a,b) Bottom view of the velocity streamlines without and with an
 $x$-directional MF, respectively. The cut plane is at a distance of
 $D$ downwards from the bubble centroid, while the iso-contours indicate the streamwise velocity, the red dashed line is the projection of the bubble interface, the blue solid (dashed) lines are the Lorentz diffusion induced positive (negative) streamwise vortex pairs and the green dashed lines denote the double symmetrical planes of S1 and S2. (c) Front view of the flow field on S1 (left) and S2 (right) planes, and the blue dashed line implies where the flows converge on S1.

After that, if there is another bubble rising by the side, the structure of the ‘Lorentz diffusion’ induced vortices evolves.  $NM2$ enables us to have a detailed understanding of this change, as illustrated in figure 11, whereas the iso-contours are
 $\omega _y=\pm 0.5$ and the black arrows are the velocity streamlines. For an isolated bubble, as shown in figure 11(a), the vortex pairs R1(2) and L1(2) are equal in strength and the symmetrical planes of S1 and S2 are depicted by the green dashed line. When another bubble is rising by the side at
 $S=1.5D$ to form a spanwise configuration, figure 11(b) reveals that the symmetry plane S1 is still present but S2 disappears. Instead, the borders (blue dash-dotted line) between vortex pairs R1(2) and L1(2) move to a more exterior position because the pressure at the R1(2) region is lower than that at L1(2) owing to the faster flows in the gap. Consequently, R1(2) dominates over L1(2) in this configuration, and such an imbalance will be more serious when the two bubbles are about to collide. Furthermore, we must note that, in this spanwise configuration, R1(2) has the same signs as the collision induced vortex pair (see figure 7), therefore a spanwise MF is expected to enhance the collision by strengthening vortex pair R1(2) which induces a repulsive lift force. In contrast, a transverse MF, as presented in figure 11(c), is expected to weaken or even fully eliminate the collision induced vortices because R1(2) have opposite signs and thus the repulsive lift force is also reduced, and thus the two bubbles prefer coalescence to bounce in this configuration. Besides, the symmetrical structure between R1(2) and L1(2) is almost maintained in a transverse MF because the streamlines are diffused along S1 but compressed along S2 to keep far away from another bubble.
Sketch showing how the Lorentz diffusion induced vortices evolve in the presence of a neighbouring bubble. The results are obtained by using NM2 and the parameters are identical to those in figure 10. (a) Isolated bubble case in a horizontal MF, R1(2) and L1(2) are the Lorentz diffusion induced streamwise vortices denoted by  $\omega _y=\pm 0.5$, the black arrow lines are the velocity streamlines and the green dashed lines denote the double symmetrical planes S1 and S2. (b,c) Bubble pair cases under a spanwise MF and a transverse MF, respectively, and the red arrow lines highlight the diffusion effect along the
 ${\boldsymbol {B}}$ lines.

The second consequence of the Lorentz force is to homogenize the pressure field along the  ${\boldsymbol {B}}$ lines owing to the centrifuge effect induced by the inhomogeneous distribution of the Lorentz force, as revealed by Zhang et al. (Reference Zhang, Ni and Moreau2016). As a result, a spanwise MF reduces the attractive force and the approaching velocity between the bubble pair under this mechanism. Accordingly, the collision strength between the two bubbles must be dampened and fewer vortices are produced, then a transition from bounce to coalescence is expected owing to this mechanism under a spanwise MF. Note that such a prediction does not contradict the results discussed for the streamwise MF, whereas we find a higher collision velocity is apt to produce coalescence between the bubble pair, that is because the streamwise MF has a different mechanism to dampen the streamwise vortices.
In light of these remarks, we would expect that a transverse MF will always encourage the two bubbles to coalesce by offsetting the collision induced vortex pair, while the spanwise MF has two opposite impacts: its influence on streamwise vortices has a positive effect towards bouncing, but the homogenizing effect on the pressure field has a negative influence. Besides, also keep in mind that a horizontal MF decreases the ellipsoidal nature of an oblate bubble (Zhang et al. Reference Zhang, Ni and Moreau2016), and hence the vorticities produced at the bubble interface are reduced correspondingly.
5.2. Freely rising bubble pair in transverse MFs
In this part, the numerical results concerning the bubble pair rising freely in a transverse MF are discussed, with the magnitude still varied in between  $N=0$,
 $0.058$,
 $0.09$,
 $0.20$,
 $0.80$ and
 $2.24$. For likewise concise reasons, we show only four of the rise paths and the shape evolutions of different bubble pairs in figure 12, and the full set of results can be found in the supplementary material (§ 4). Given an enhanced transverse MF, as conveyed by the pictures, the interaction between the bubble pair transits from bouncing separation (
 $N=0$) to bouncing coalescence (
 $N_z = 0.090$) and finally to a direct coalescence (
 $N_z\geqslant 0.80$). Moreover, we see the coalescence moment is delayed at
 $N_z=2.24$ (and even cannot be displayed in the snapshots within the time period), and we will demonstrate later (in § 5.4) that such reversal is owing to the significant suppression of the rise velocity of the bubble in a strong horizontal MF, with the attracting force also reduced correspondingly.
Rise path of bubble pairs under different transverse MFs. The snapshots show the bubble shapes during the collision. Other descriptions refer to those in the caption of figure 7. Note that (d) does not show the whole coalescence process because the rise velocity of the bubble is greatly suppressed by the MF at  $N_z=2.24$, and thus the coalescence cannot be displayed in the snapshots within the time period.

Furthermore, more information about the flow characteristics is provided in figure 13. In the top row, panels (a–d) portray the three-dimensional velocity streamlines past the left bubble within one pair, and the corresponding vortex structures, with the iso-contours denoting  $\omega _y=\pm 1.7$, displayed behind the right bubbles. In a small MF (
 $N_z=0.09$), the streamline patterns are very similar to the hydrodynamic case at
 $N=0$, the deviation of the converging line towards the interior position leads to a significant production of the streamwise vortices. However, at a moderate-to-large
 $N_z$ (
 $N_z = 0.80$ and
 $2.24$), the MF drives the converging line back to the centre of the rear, and the flow around the left bubble almost recovers to a symmetrical configuration on the
 $XOY$ plane, which is exactly S2 in figure 10. Furthermore, we see the collision induced vortex pair are weakened successively in a greater MF, while the Lorentz diffusion induced vortices grow inversely. The two types of vortices are marked by the black and blue boxes, respectively, and it is observed that, at
 $N_z=2.24$, the former vortex pair completely disappear while the latter vortex pairs dominate at the centre of the bubble rear by maintaining the symmetry between R1(2) and L1(2). Then, how the the streamwise vortices evolve becomes more obvious by looking at the projected view onto a cut plane of
 $D$ below the bubble centroid, as described in panels (e–h), where the blue dashed circles are the projection of the bubble interface and the iso-contours represent
 $\omega _y=\pm 1.7$. At
 $N=0$ and
 $N_z=0.09$, we see the streamlines bend due to bubble collision, which produces a negative vortex at
 $z>0$ and a positive one at
 $z<0$. Then, at
 $N_z=0.80$ and
 $N_z=2.24$, the collision induced vortex pair are weakened while the Lorentz diffusion induced double pairs are more visible. Also note that the interior pair R1(2) have opposite signs to the collision induced ones, and thus the repulsive forces are dampened significantly. Then the bubble pair approach one another until coalescence. As a consequence, figure 13 verifies the speculations presented in § 5.1 that the growth of the Lorentz diffusion induced vortices should be responsible for such a bounce-to-coalescence transition in a transverse MF.
Characteristics of the flow field in the vicinity of the bubble pairs at the moment of collision, the transverse MF is varied as (a,e)  $N_z = 0.0$, (b,f)
 $0.09$, (c,g)
 $0.80$ and (d,h)
 $2.24$. (a–d) Three-dimensional streamlines past the left bubble and the iso-contours of
 $\omega _y=\pm 1.7$ behind the right bubble. (e–h) The bottom view of the streamlines on a horizontal plane at a distance of
 $D$ below the bubble centroid, the iso-contours denote
 $\omega _y=\pm 1.7$, the blue dashed line is the projection of the bubble interface and the green dash-dotted line is S2 described in figure 10.

5.3. Freely rising bubble pair in spanwise MFs
Next, the numerical results concerning the freely rising bubble pairs in spanwise MFs are reported. Some of their rise paths and the snapshots of their shapes are plotted in figure 14, while the full results can be also found in the supplementary material (§ 4). Different from the transverse configuration, the influence of the spanwise MF on the bubble iteration is non-monotonic. That is, although the transition from bounce to coalescence still appears at a small value of  $N_x = 0\sim 0.09$, the bubbles bounce again at
 $N_x=0.80$ and ultimately repel at
 $N_x=2.24$. The results reveal that the MHD effects caused by a spanwise MF are more complex than other MFs.
Rise path of bubble pairs under different spanwise MFs. The snapshots are the bubble shapes during the collision. Other descriptions refer to those in the caption of figure 7.

Three-dimensional velocity streamlines around the bubble pair and the corresponding iso-surfaces of  $\omega _y=\pm 1.7$ are displayed in figure 15(a–d). We see that the streamlines do not converge towards the centre of the bubble rear by strengthening the spanwise MF, and in the extreme case of
 $N_x=2.24$, a void area appears beneath the bubble on the plane
 $XOY$, which is S1 in this spanwise configuration. This variation tendency is exactly what we expect as the consequence of the Lorentz diffusion, as fully detailed in figure 10(b,c). Simultaneously, the vortex pairs are slightly dampened by a weak MF (
 $N_x = 0.09$) but are inversely enhanced in a moderate field (
 $N_x = 0.80$), and ultimately only the Lorentz diffusion induced vortices are visible at
 $N_x=2.24$. Such a non-monotonic variation is also in line with our speculations as discussed in § 5.1, implying that the spanwise MF has two opposite impacts on the bubble interactions: (i) the Lorentz diffusion induced streamwise vortices will strengthen the collision between the two bubbles, and thus the repulsive lift force is enhanced to produce a bouncing interaction (hereinafter referred to as the ‘L’ mechanism); (ii) the flow field and pressure field will be more homogeneous along the line connecting the bubble centroids so that the attractive force is correspondingly reduced to favour a coalescence interaction (hereinafter referred to as the ‘P’ mechanism).
Characteristics of the flow field in the vicinity of the bubble pairs at the moment of collision. The spanwise MF is varied as (a,e)  $N_x = 0.0$, (b,f)
 $0.09$, (c,g)
 $0.80$ and (d,h)
 $2.24$. Other descriptions refer to those in the caption of figure 13.

Then the competition between the two mechanisms could be divided into three stages according to figure 15: (I) at a weak spanwise MF of  $N_x=0.09$, the ‘L’ mechanism is very weak, and the ‘P’ mechanism reduces the attracting force between the bubble pair so that the collision is dampened to generate fewer vortices, then the coalescence between the bubble pair is favoured in this stage; (II) at a moderate value of
 $N_x=0.80$ , the ‘P’ mechanism further reduces the attracting force but the bubble pairs could still approach towards each other, now the ‘L’ mechanism becomes significant during the collision and vortex pairs R1(2) are greatly enhanced to produce a bounce; (III) as the spanwise MF is intensified to
 $N_x=2.24$, the ‘P’ mechanism leads to a rather weak attractive force by highly homogenizing the pressure field along the
 ${\boldsymbol {B}}$ lines, but the ‘L’ mechanism produces a repulsive force by creating asymmetry between R1(2) and L1(2) (see the blue dot-dashed box in figure 15d), and such imbalance causes the bubbles to repel each other from the very beginning of the rise. Furthermore, figure 15(e–h) also displays the streamlines projected onto the cut plane at a distance
 $D$ below the bubble centroid, the evolution of the vortex pair caused by collision and the Lorentz diffusion becomes more clear against the enhancement of the spanwise MF, and the results further support the core mechanisms that it is the vortex development that determines the interaction between the bubble pair. Besides, because spanwise MFs of
 $N_x=0.80$ and
 $2.24$ inversely produce strong collision and repulsion between the bubble pairs, it is desirable to explore the vortex evolution during the rise of the bubble pair, and the results are provided in the supplementary material (§ 5).
In addition, to further illustrate the ‘P’ mechanism, figure 16 depicts the hydrodynamic pressure of  $(p-\rho _1 g\Delta y)$ outside the bubbles on an
 $XOY$ plane in different spanwise MFs. Note that the gap widths between the two bubbles at
 $N_x=0.09$ and
 $N_x=0.80$ are equivalent for accurate comparison. By displaying the minimum hydrodynamic pressure at the exterior and the interior positions of the left bubble, the pictures reveal that an enhanced spanwise MF reduces the pressure difference on the two sides of the bubble, and hence the attractive force is also reduced owing to such a homogenizing effect. Keep in mind that, in the case of
 $N_x=2.24$,
 $\Delta p=p_{ext}-p_{int}=0.07$ is still positive so that a very weak attractive force should be maintained, however, it is now overwhelmed by the repulsive force induced by the asymmetry between vortices L1(2) and R1(2).
Hydrodynamic pressure field in the vicinity of the bubble pair at  $N_x=0.09$,
 $0.80$ and
 $2.24$. The values at the exterior and the interior positions of the left bubble indicate the minimum pressure there. Note that only the pressure outside the bubbles is displayed, and this picture confirms that the pressure field along the line connecting the bubble centroid is homogenized by a stronger spanwise MF.

5.4. Rise and bounce velocities
We are now clear that the MHD effects on the vortex developments are the essential mechanisms to alter the bubble interactions. Since the evolutions of the collision velocity vs  $N_x(z)$ are also concerned sometimes, with the results under spanwise MFs described in figure 17(a), we witness that the collision velocity has a negative correlation vs the value of
 $N_x$, and this variation tendency fully supports our ‘P’ mechanism that the spanwise MF reduces the attractive force by homogenizing the pressure field. Moreover, at
 $N_x=0.80$, we see the collision velocity is significantly suppressed but the two bubbles still bounce off, and apparently, it implies that the collision velocity is not a determining factor in the bubble interaction. In contrast, things are quite different under transverse MFs as depicted in figure 17(b). It is found that a small
 $N_z$ below
 $0.20$ still enhances the collision velocity due to the weakened double-threaded vortices at the rear of the bubble pairs, similar to that under a streamwise MF. However, a moderate-to-large
 $N_z$ at
 $0.80$ and
 $2.24$ suppresses the collision velocity inversely, this is due to the sharp decline in rise velocity which weakens the attracting force subsequently, and we will confirm this shortly in figure 18.
Collision velocity between a pair of bubbles under different (a) spanwise MFs  $N_x$ and (b) transverse MFs
 $N_z$.

Rise velocities of the bubble pair under (a) spanwise MFs  $N_x$ and (b) transverse MFs
 $N_z$.

Finally, figure 18 describes the rise velocities for the above bubble pairs. Not surprisingly, the rise velocities are always suppressed by a stronger horizontal MF owing to the induced Lorentz forces acting downwards at the top of the bubbles (Zhang et al. Reference Zhang, Ni and Moreau2016), and such resistance is not obvious at small  $N_{x(z)}$ (
 ${\leqslant }0.20$) while it becomes significant at moderate-to-large
 $N_{x(z)}$ (
 ${\geqslant }0.20$). Meanwhile, note that the suppression effects caused by the two directions of MF are almost identical at a given
 $N$, implying that different bubble interactions caused by spanwise and transverse MFs are not because of the bifurcation in rise velocities.
5.5. Results with varied  $\theta$ in the range $0^{\circ } \sim 90^{\circ }$


We rotate the horizontal MF in the  $XOZ$ plane to form different angles between the line connecting the bubble centroid and the
 ${\boldsymbol {B}}$ lines, and a smaller
 $\theta$ indicates the two are more parallel. By maintaining the magnetic strength at
 $N=2.24$, the rise paths of the left bubble are shown in figure 19(a), where the grey lines correspond to a spanwise (
 $\theta =0^{\circ }$) MF and a transverse (
 $\theta =90^{\circ }$) MF for comparison. It clearly reveals that in a wide range of
 $\theta$, i.e. within
 $\theta \geqslant 30^{\circ }$, the two bubbles attract with one another until coalesce, and the coalescence happens earlier at a larger inclination angle. This is because the momentum diffuses along the
 ${\boldsymbol {B}}$ lines, and thus an increased
 $\theta$ not only reduces the asymmetry between R1(2) and L1(2) but also dampens the velocity diffusion along the bubble centroid line, and thus the repulsive force is decreased but the attractive force is enhanced. Moreover, at
 $\theta =15^{\circ }$ and
 $5^{\circ }$, the two bubbles repel each other within a short period after being released. We will prove later (figure 20) that this is because the two bubbles rotate in the
 $XOZ$ plane owing to the torque produced by an initially non-zero
 $\theta$, and then their angle actually grows during the bubble rise to make the force transit from repulsive to attractive.
Rise path of the left bubble within a pair at a constant  $N=2.24$ and varied
 $\theta$, which denotes the angle between the horizontal MF and the bubble centroid connecting line. (a) Front view; (b) the fit curve for the inverse of the coalescence height against
 $\theta$.

Bottom view of the rise path of the bubble pairs with varying  $\theta$ while maintaining the MF strength at
 $N=2.24$. The arrows denote the motion direction of the bubble. It is observed that the bubbles also drift in the
 $z$ direction during the approaching period in the range of
 $5^{\circ } < \theta < 45^{\circ }$. The iso-contours denote
 $\omega _y=\pm 1.7$ behind the bubble pairs.

Furthermore, if we split the horizontal MF into two parts in orthogonal directions, which are parallel to and perpendicular to the line connecting the bubble centroid, then we obtain different decompositions of  $N_{\parallel }$ (in the
 $x$-direction) and
 $N_{\perp }$ (in the
 $z$-direction). A varied
 $\theta$ is more or less like the combined effect of imposing a transverse MF and a spanwise MF simultaneously. In the case of
 $\theta =60^{\circ }$, which consists of
 $N_{\parallel }=1.120$ and
 $N_{\perp }=1.940$, the bubble pair is observed to coalesce directly, by noting that a sole spanwise MF of
 $N_x=0.80$ already makes the two bubbles bounce off (figure 14). Besides, even if
 $\theta$ decreases to
 $15^{\circ }$ (
 $5^{\circ }$) the
 $\parallel$ component of
 $N_{\parallel }=2.163$ (
 $2.231$) is already very large, nevertheless, we still observe the two bubbles coalescing after a very short period of repulsion at the early stage. Such a result indicates most horizontal MFs promote the coalescence between the two bubbles, unless the inclination angle is very close to zero. In addition, figure 19(b) displays the inverse of the coalescence heights against different
 $\theta$, and an arc tangent correlation is found to fit well against the numerical results.
Figure 20 displays the bottom view of the trajectories of the bubble pairs; note that we separate different cases along the  $x$-coordinate to make the picture be more readable. Clearly, the result reveals that, with an initially non-zero
 $\theta$, the bubble pair not only interact along the
 $x$-coordinate, but they also drift in the
 $z$-direction to form a rotating motion, which is most remarkable at
 $\theta =5^{\circ }$. This is because, with a non-zero
 $\theta$, not only the double vortex pairs R1(2) and L1(2) lose symmetry, but the two threads at the interior position, given by
 $R1$ and
 $R2$, also become imbalanced. Moreover, the vorticity diffusion induced by the MF does not fully comply with the bubble connecting line and thus the blocking effect also becomes skewed. As a consequence, the two imbalanced mechanisms produce a torque to drive the bubble rotation. Then, with an initial angle of
 $5^{\circ }$,
 $\theta$ actually increases during the bubble rise and becomes
 $15.43^{\circ }$ at the extreme position, after which we observe the two bubbles attract each other again. Furthermore, the streamwise vortices
 $\omega _y=\pm 1.7$ during bubble pair approaching are also displayed on the same figure, the most impressive scenario is that, by increasing
 $\theta$, we observe the Lorentz diffusion induced vortex pairs rotate in an anticlockwise direction from a bottom view.
6. Conclusions and perspectives
A pair of bubbles rising side by side in liquid GaInSn has been studied numerically in the presence of external MFs. Bubble interactions are observed to highly depend on MF direction and strength, moreover, the in-depth physical mechanisms for the MHD effects are investigated by mainly focusing on the vortex developments. The results reveal that the Lorentz torque induced vortices under a streamwise MF and the Lorentz diffusion induced vortices under a horizontal MF, in essence, control the collision between the bubble pair.
Without applying external MFs, the numerical results show that, by increasing the bubble size from  $D=2.0$ to
 $D=4.0$ mm, the interactions between a pair of bubbles rising in liquid GaInSn evolve from direct coalescence to bouncing coalescence, bouncing separation and ultimately separation without bounce in sequence, and the collision induced double-threaded vortices are responsible for such transitions. In the presence of a streamwise MF, we find the induced current density in vicinity of the bubble within one pair is no longer axisymmetric, this is owing to the asymmetric flow produced by the neighbouring bubble rising by its side. Correspondingly, a Lorentz torque is generated to produce a pair of streamwise vortices which dampen the original vortices at the rear of the collision bubbles. Under such influences, the interaction between a bubble pair is weakened under streamwise MFs, and a transition from bounce to coalescence is observed. In the presence of a horizontal MF, its influences are rather direction dependent and anisotropic: a transverse MF always leads the bouncing bubble pair to coalescence, while a spanwise MF has more complex impacts depending on the field strength. Under a spanwise MF, although the flow field is homogenized along the
 ${\boldsymbol {B}}$ lines which produce smaller attractive force by declining the pressure difference at the two sides of the bubble, nevertheless, the Lorentz diffusion also produces double streamwise vortex pairs at the rear of the bubble and the interior pair are stronger in the presence of a neighbouring bubble so that a repulsive lift force is induced. As a consequence, the two effects compete with each other on varying the magnetic strength, and we find a weak spanwise MF makes the bubble coalesce while a strong MF causes them to bounce or even to repel. On the other hand, a transverse MF always promotes the coalescence between the bubble pair because the Lorentz diffusion induces a pair of vortices at an interior position to offset the collision induced vortex pair, and thus the collision between the two bubbles is dampened so that a coalescence is always favoured. Moreover, we find even a small deviation from the spanwise configuration, i.e.
 $\theta =5^{\circ }$, greatly promotes the coalescence tendency between the bubble pair, which also rotate in the horizontal plane because a torque is induced by the non-zero
 $\theta$. More importantly, the numerical results confirm that the collision velocity, calculated in any MF, is not the decisive factor to determine whether the two bubbles will coalesce or bounce.
Note that, in the present study, only one bubble size ( $D=3.0$ mm) and one initial separation (
 $S = 2$) are discussed in the presence of MFs, but the varying MHD effects depending on these parameters could still be inferred from our previous studies (Zhang & Ni Reference Zhang and Ni2014b; Zhang et al. Reference Zhang, Ni and Moreau2016, Reference Zhang, Chen and Ni2019). For instance, the zigzagging interactions between a larger bubble pair of
 $D = 4.0$ mm must be suppressed firstly by the MF directing in any direction, and then the influences of a stronger MF conform to those reported in §§ 4 and 5. On the other hand, if the separation distance is enlarged or reduced between the bubble pair of
 $D = 3.0$ mm, the interaction without MF would maintain bounce or transition to coalescence as Zhang et al. (Reference Zhang, Chen and Ni2019) reveal, and thus the critical
 $N_{(x,y,z)}$ separating different interaction patterns must be varied too. Besides, this study does not examine the influence of slight differences in the size of the two bubbles, or the influence of the deviation of the line connecting the bubble centroid from the side-by-side configuration. Actually, they are non-trivial tasks as Hallez & Legendre (Reference Hallez and Legendre2011) and Kusuno, Yamamoto & Sanada (Reference Kusuno, Yamamoto and Sanada2019) reveal, in particular, the deformation of the bubble shapes complicates the problem because the unstable wake effects become significant, and a detailed investigation is in our future plan.
In addition, the present study is the first attempt to bridge the gap between isolated bubble motion and bubbly motion in MHD flows; it helps us understand the varying performances of bubbly flows exposed to different MFs. For instance, the experiments in streamwise MFs witness a significant concentration of the gas phase in an isotropic manner (Eckert et al. Reference Eckert, Gerbeth and Lielausis2000a), while a horizontal MF is found to produce an anisotropic distribution of the bubble void fraction (Zhang et al. Reference Zhang, Eckert and Berbeth2007). These observations conform to our numerical results that a streamwise MF promotes the coalescence between bubbles and a horizontal MF produces anisotropic interactions between the bubbles. Moreover, the dependency of the vortex developments and the bubble interactions on MF directions can shed some light on our understanding of the in-depth physics of these problems. However, it should be noted that bubbly jetting flow is still much more complex than the rise of a bubble pair owing to the dominating turbulent structures, which significantly complicate the problem.
Supplementary material
Supplementary material is available at https://doi.org/10.1017/jfm.2021.695.
Acknowledgments
We are also grateful for the anonymous referees for their valuable and constructive comments that improved and condensed this paper, in particularly for strongly suggesting that we should undertake extra numerical simulations in order to differentiate the bounce-coalescence and bounce-separation scenarios.
Funding
The authors acknowledge the supports from the NSFC (51636009, 11872296, U1732276) and CAS (XDB22040201, QYZDJ-SSW-SLH014). J.Z. acknowledges the Young Elite Scientists Sponsorship Program by CAST (2018QNRC001).
Declaration of interests
The authors report no conflict of interest.



