Introduction
Fish are the largest and most diverse group of vertebrates, containing about 33,932 species (Froese & Pauly, Reference Froese and Pauly2021). Besides their importance to biodiversity, they also have a direct economic value through fisheries and provide an important source of animal protein for human nutrition in many countries (Ward et al., Reference Ward, Zemlac, Innes, Last and Hebert2005; Zhang, Reference Zhang2011; Keskin & Atar, Reference Keskin and Atar2013). To achieve sustainability of these benefits, better control and management of fisheries should be implemented, and one of the most important contemporary issues in fisheries management is fish identification (Keskin & Atar, Reference Keskin and Atar2013). Definitely, accurate identification of fish species is crucial at various levels, including monitoring fisheries landings for stock assessment and management (Lorenzen et al., Reference Lorenzen, Cowx, Entsua-Mensah, Lester, Koehn, Randall, So, Bonar, Bunnell, Venturelli, Bower and Cooke2016), for scientific purposes (Lleonart et al., Reference Lleonart, Taconet and Lamboeuf2006), identification of species in early life stages (Teletchea, Reference Teletchea2009), and detection of fraudulent substitution in processed seafood (Fox et al., Reference Fox, Mitchell, Dean, Elliott and Katrina Campbell2018; Fernandes et al., Reference Fernandes, Amaral and Isabel Mafra2020; Kotsanopoulos et al., Reference Kotsanopoulos, Exadactylos, Gkafas, Martsikalis, Parlapani, Boziaris and Arvanitoyannis2021). To date, many fish species have traditionally been identified based on morphometric and meristic characteristics, including body shape, the pattern of colours, scale size and count, gill rakers count, number and relative position of fins, number and type of fin rays, various relative measurements of body parts, or otoliths shape and size (Bottero & Dalmasso, Reference Bottero and Dalmasso2011; Reecht et al., Reference Reecht, Rochet, Trenkel, Jennings and Pinnegar2013; Jawad et al., Reference Jawad, Ligas and Al-Janabi2017, Reference Jawad, Habbeb and Al-Mukhtar2018, Reference Jawad, Ibáñez, Kiki and Gnohossou2020; Ben Labidi et al., Reference Ben Labidi, Mejri, Shahin, Quignard, Trabelsi and Ben Faleh2020a, Reference Ben Labidi, Mejri, Shahin, Quignard, Trabelsi and Ben Faleh2020b, Reference Ben Labidi, Allaya, Shahin, Quignard, Trabelsi and Ben Faleh2021; Jan & Ahmed, Reference Jan and Ahmed2020). However, it has been shown that many of these characteristics change during ontogenetic development (Zhang & Hanner, Reference Zhang and Hanner2011) and convergent and divergent adaptation to the environment (Keskin & Atar, Reference Keskin and Atar2013). Besides, morphological features are sometimes of limited value for identifying and differentiating species, because they can exhibit either large intra- or small inter-specific differences (Callejas & Ochando, Reference Callejas and Ochando2001). Moreover, identification becomes more difficult or even impossible when most of the morphological features are removed during either digestion in stomach contents, or various processing such as canning and filleting (Teletchea, Reference Teletchea2009). Furthermore, the identification of early life stages, e.g. egg and larvae, is more complex than that of adults (Strauss & Bond, Reference Strauss, Bond, Schreck and Moyle1990). Taken all together, these difficulties imposed great challenges to morphological taxonomy, as the classification of many species remains ambiguous and subject to controversial discussion (Keskin & Atar, Reference Keskin and Atar2013), and evoked researchers to develop new approaches for identifying fish species without relying on morphological features.
On the other hand, with the development of new modern taxonomic systems, other features, such as internal anatomy, physiology, genes, isozymes, behaviour and geography, have been introduced for appropriate identification (Costa & Carvalho, Reference Costa and Carvalho2007). However, with the use of molecular-level indicators, such as DNA tools, for identifying fish species, the limitations inherent in morphology-based identification systems and the lack of local fish identification expertise have been mitigated (Zhang & Hanner, Reference Zhang and Hanner2011; Keskin & Atar, Reference Keskin and Atar2013; Di Pinto et al., Reference Di Pinto, Marchetti, Mottola, Bozzo, Bonerba and Ceci2015). Of these DNA tools, a DNA-based barcoding method has been adopted as a rapid global identification system for taxon diagnosis, which exploits the diversity of DNA sequences between species to identify fish, resolve taxonomic ambiguity and discover new cryptic species (Hebert et al., Reference Hebert, Ratnasingham and DeWaard2003, Reference Hebert, Stoeckle, Zemlak and Francis2004; Lakra et al., Reference Lakra, Verma, Goswami, Lal, Mohindra, Punia, Gopalakrishnan, Singh, Ward and Hebert2011). This DNA barcode system is based on sequence diversity in a single gene region of ~650 bp from the 5′ end of the mitochondrial cytochrome c oxidase subunit I (COI) gene. The assumption is that the efficiency of this method centres on the degree of sequence divergence between species, and species-level identifications are relatively explicit when the average genetic distance between individuals within a species does not exceed the average genetic distance between sister species (Pradhan et al., Reference Pradhan, Kamble, Ladniya and Mogul2015). In conjunction with a reference sequence library, new specimens and products can be identified by comparing their DNA barcode sequences against this barcode reference library. This COI region has been assumed appropriate for discriminating between closely related species of marine and freshwater fishes and animals with high discriminatory power (Hajibabaei et al., Reference Hajibabaei, de Waard, Ivanova, Ratnasingham, Dooh, Kirk, Mackie and Hebert2005; Ward et al., Reference Ward, Zemlac, Innes, Last and Hebert2005; Ivanova et al., Reference Ivanova, Zemlak, Hanner and Hebert2007; Lakra et al., Reference Lakra, Goswami and Gopalakrishnan2009, Reference Lakra, Verma, Goswami, Lal, Mohindra, Punia, Gopalakrishnan, Singh, Ward and Hebert2011; Lyra et al., Reference Lyra, Haddad and de Azeredo-Espin2017). DNA barcoding has been applied not only for the identification of fish species and products (Smith et al., Reference Smith, McVeagh and Steinke2008; Lakra et al., Reference Lakra, Verma, Goswami, Lal, Mohindra, Punia, Gopalakrishnan, Singh, Ward and Hebert2011; Triantafyllidis et al., Reference Triantafyllidis, Bobori, Koliamitra, Gbandi, Mpanti, Petriki and Karaisko2011; Malakar et al., Reference Malakar, Lakra, Goswami, Singh and Mishra2012; Di Pinto et al., Reference Di Pinto, Marchetti, Mottola, Bozzo, Bonerba and Ceci2015) but also for fish product examination such as fillets, fins, fragments, canned fish, dried fish and mixtures, conservation of threatened and endangered species, identification of fish eggs and larvae, identification of prey items in stomach contents (Soininen et al., Reference Soininen, Valentini, Coissac, Miquel, Gielly, Brochmann, Brysting, Sønstebø, Ims, Yoccoz and Taberlet2009; Barman et al., Reference Barman, Roy, Kumar, Mandal and Vikas Kumar2012), identification of new species, population structure assessment, phylogenetics and biodiversity assessment (Bingpeng et al., Reference Bingpeng, Heshan, Zhilan, Chunguang, Yanguo and Jianjun2018; Rabaoui et al., Reference Rabaoui, Yacoubi, Sanna, Casu, Scarpa, Lin, Shen, Arculeo and Qurban2019; Ghouri et al., Reference Ghouri, Ismail, Javed, Khan, Munawar, Umar, Nisa, Aftab, Amin, Khan and Ahmad2020). To date, DNA barcoding has been applied for the identification of more than 6000 species of marine and freshwater fish in many countries and regions around the world (Ward et al., Reference Ward, Hanner and Hebert2009; Ardura et al., Reference Ardura, Linde, Moreira and Garcia-Vazquez2010; Zhang, Reference Zhang2011; Mabragana et al., Reference Mabragana, de Astarloa JM, Hanner, Zhang and Gonzalez Castro2011; Keskin & Atar, Reference Keskin and Atar2013; Abbas et al., Reference Abbas, Soliman, El-Magd, Farrag, Ismail and Kato2017; Paracchini et al., Reference Paracchini, Petrillo, Lievens, Gallardo, Martinsohn, Hofherr, Maquet, Silva, Kagkli, Querci, Patak and Angers-Loustau2017; Kundu et al., Reference Kundu, Chandra, Tyagi, Pakrashi and Kumar2019; Ghouri et al., Reference Ghouri, Ismail, Javed, Khan, Munawar, Umar, Nisa, Aftab, Amin, Khan and Ahmad2020). Their COI sequences have been deposited in the Barcode of Life Data Systems (BOLD) and GenBank nucleotide database (NCBI; Ward et al., Reference Ward, Zemlac, Innes, Last and Hebert2005; Ratnasingham & Hebert, Reference Ratnasingham and Hebert2007; Lakra et al., Reference Lakra, Verma, Goswami, Lal, Mohindra, Punia, Gopalakrishnan, Singh, Ward and Hebert2011). The success of identifying fishes with mtDNA COI gene barcode has ranged from 93–100% (Hubert et al., Reference Hubert, Hanner, Holm, Mandrak, Taylor, Taylor, Burridge, Watkinson, Dumont, Curry, Bentzen, Zhang, April and Bernatchez2008; Steinke et al., Reference Steinke, Zemlak, Boutillier and Hebert2009).
Despite these DNA barcoding studies that have successfully identified marine ichthyofauna and provided a wealth of DNA barcode information in many countries, DNA barcode information for ichthyofauna in African countries remains unexplored. Tunisia has ~1250 km of coastline, of which 400 km are sandy beaches (Ben Hassine & Escoriza, Reference Ben Hassine and Escoriza2013) and a total of 355 marine fish species have been identified in Tunisian waters (Froese & Pauly, Reference Froese and Pauly2019). Among these species, 15 marine species belonging to seven families have been evaluated as commercially important fish species according to FishBase, with 21,900 tons of production in 2017 (FAO, 2019). Therefore, a comprehensive study based on the DNA barcoding approach of the coastal fishes in Tunisia is urgently needed. Here, this study was applied for the first time to 37 commercially important Tunisian marine fish species. The aim was to establish a reference library with the generated barcodes that will assist researchers and managers in monitoring, sustainably exploring and conserving the local fish diversity.
Materials and methods
Sampling
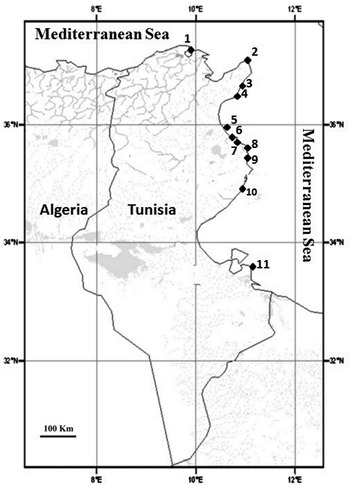
A total of 37 species from 14 families were collected during the period from January 2019 to June 2020 from 11 localities along the Tunisian coast (Figure 1; Table S1 in Supplementary Material). Samples were collected with the help of local commercial trawlers and local fishermen using push nets or gill nets. Species identification was performed according to the fish identification keys of Whitehead (Reference Whitehead, Whitehead, Bauchot, Hureau, Neilsen and Tortonese1986) and Species Identification Guide for Fishery Purposes (Fischer, Reference Fischer1973), and nomenclature followed the Food and Agriculture Organization (FAO) Fish Identification Sheets. All fish samples were photographed using a Nikon Coolpix-S6700 camera and photographs, as well as details of samples, their taxonomic rank, code, sampling site, number, geographic coordinates and accession number, are given in Figure S1 and Table S1, respectively. Approximately 100 mg of fin-clip tissue from 2–3 individuals of each species were preserved in 95% ethanol and frozen at −20°C until DNA extraction.
Sampling locations for the DNA barcoding of commercially relevant fish in Tunisian coastal waters. 1, Bizerte; 2, El Haouaria; 3, Béni Khiar; 4, Nabeul; 5, Sousse; 6, Monastir; 7, Sayada; 8, Mahdia; 9, Chebba; 10, Sfax; 11, Zarzis.

DNA extraction, amplification and sequencing
Total genomic DNA was extracted from about 20 mg of tissue using the REDEXtract-N-mp kit (Sigma-Aldrich) following the manufacturer's instructions. The same kit was used for the amplification of the cytochrome c oxidase subunit I using COI-F1 (5′- TCAACCACCCACAAAGACATTGGCAC-3′) and COI-R2 primers N (5′- ACTTCAGGGTGACCGAAGAATCAGAA-3′) (Ward et al., Reference Ward, Zemlac, Innes, Last and Hebert2005). The following PCR conditions were used for both COI-F1 and COI-R2. The thermal regime consisted of an initial denaturation for 2 min at 95°C followed by 35 cycles of 30 s at 94°C, 30 s at 52°C and 1 min at 72°C, and ended by a final extension of 10 min at 72°C. The PCR products were purified and sequenced in STABVIDA (Sanger sequencing, https//www.stabvida.net/).
Sequence and data analyses
Sequences were manually edited with Codon Code Aligner 9.0 (https://www.codoncode.com/index.htm) and aligned using Clustal X2 (Larkin et al., Reference Larkin, Blackshields, Brown, Chenna, McGettigan, McWilliam, Valentin, Wallace, Wilm, Lopez, Thompson, Gibson and Higgins2007). For each sample, genetic identity was confirmed using the Standard Nucleotide BLAST program established by Altschul et al. (Reference Altschul, Gish, Miller, Myers and Lipman1990) at the National Center for Biotechnology Information (NCBI) and the Identification Engine on the Barcode of Life Database (BOLD) (Ratnasingham & Hebert, Reference Ratnasingham and Hebert2007). As a rule, higher congruence was defined with a sequence similarity of at least 97% to indicate potential species identification (Wong & Hanner, Reference Wong and Hanner2008). Sequences were deposited in GenBank (accession numbers MW575671–MW575754) and submitted to BOLD under the project ‘TUNFI Fish Species from Tunisia’ (accession numbers TUNFI001-21-TUNFI084-21) (Table S1). In addition, an alignment file (in Fasta format) of the mtDNA-COI barcoding sequences that we used to generate the ML and BI trees and subsequent analysis was uploaded as a Supplementary Material. The recently released exploratory method of Assemble Species by Automatic Partitioning (ASAP) (Puillandre et al., Reference Puillandre, Brouillet and Achaz2021) was used to infer Molecular Operational Taxonomic Units (MOTUs). The distance matrix was generated by the Kimura 2-Parameter (K2P) model (Kimura, Reference Kimura1980), with default parameters, using the ASAP online service (https://bioinfo.mnhn.fr/abi/public/asap/). The MEGA X software (Kumar et al., Reference Kumar, Stecher, Li, Knyaz and Tamura2018) was used to estimate GC content, transition/transversion bias, and pairwise genetic distances at different taxonomic levels, including intraspecific, interspecific within the same genus, intergeneric within the same family, and inter-family within the same order using the Kimura 2-Parameter (K2P) model (Kimura, Reference Kimura1980). Species and genera that contain only one sequence were excluded from the distance analysis and the analysis was applied for the higher levels of genetic distance. Genetic distances at all levels were calculated regardless of the source of the samples. Genetic distance values may contain intra- and/or inter-local divergences. The DNA barcoding gap, i.e. the maximum intraspecific distance for each species vs its minimum distance to the Nearest Neighbour (NN), was performed for all species by applying BOLD's Barcoding Gap Analysis tool. The best-fit model of DNA sequence evolution was chosen under the Akaike Information Criterion (AIC). The General Time Reversible (GTR) with a gamma distribution (+G) and proportion of invariable sites (+I) was selected and used to infer the Maximum likelihood (ML) tree using 10,000 bootstrap replications. Bayesian inference analysis (BI) was conducted in BEAST v1.10.4 (Suchard et al., Reference Suchard, Lemey, Baele, Ayres, Drummond and Rambaut2018) with a constant population size under a coalescent model (Kingman, Reference Kingman1982) and an uncorrelated relaxed clock (Drummond et al., Reference Drummond, Ho, Phillips and Rambaut2006). The MCMC analysis was run for 80,000,000 generations with a sampling of trees every 2000 generations. The remaining settings and priors were set by default. Two independent runs were conducted, and the results were compared. Stationarity was assessed by importing the parameter file into Tracer v.1.7.1 (Rambaut et al., Reference Rambaut, Drummond, Xie, Baele and Suchard2018) and assessing whether the Effective Sample Size (ESS) of all parameter values was > 200. A Maximum Clade Credibility (MCC) tree was constructed using the program TreeAnnotator (BEAST software) and visualized in FigTree v1.4.4 (http://tree.bio.ed.ac.uk/software/figtree/).
Results
A total of 84 COI barcodes were generated from 37 species representing 30 genera, 14 families and five orders of the Tunisian marine fish (see the alignment file in the Supplementary Material). Sequencing of the COI gene produced 637 nucleotide base pairs per taxon. Simplicity and lack of ambiguity were observed among all the sequences, and no insertions, deletions or stop codons were observed in any of the sequences. Nucleotide composition analysis revealed that the mean frequencies for the complete data set were 23.25% for A, 29.52% for T, 28.92% for C and 18.31% for G. The average GC content was 56.77% for the first codon, 42.39% for the second codon and 42.48% for the third codon, with 47.23% for all the sites of all sequences. The estimated transition/transversion bias (R) was 2.14.
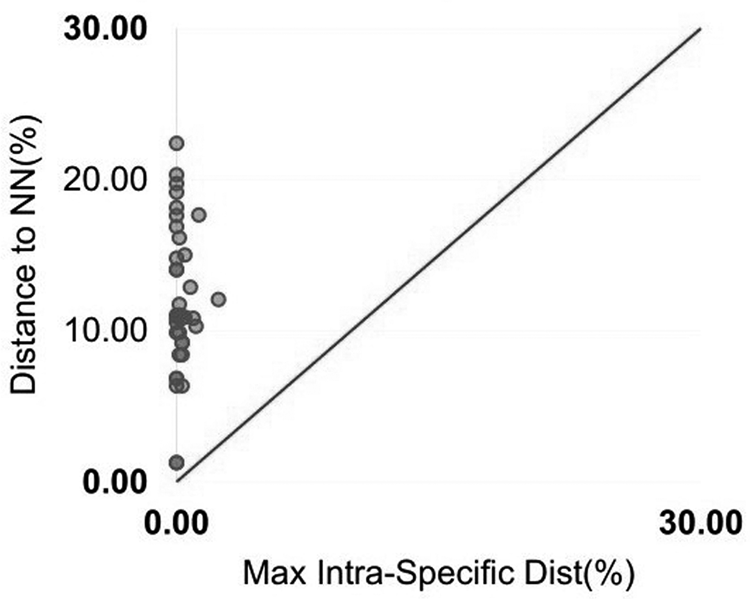
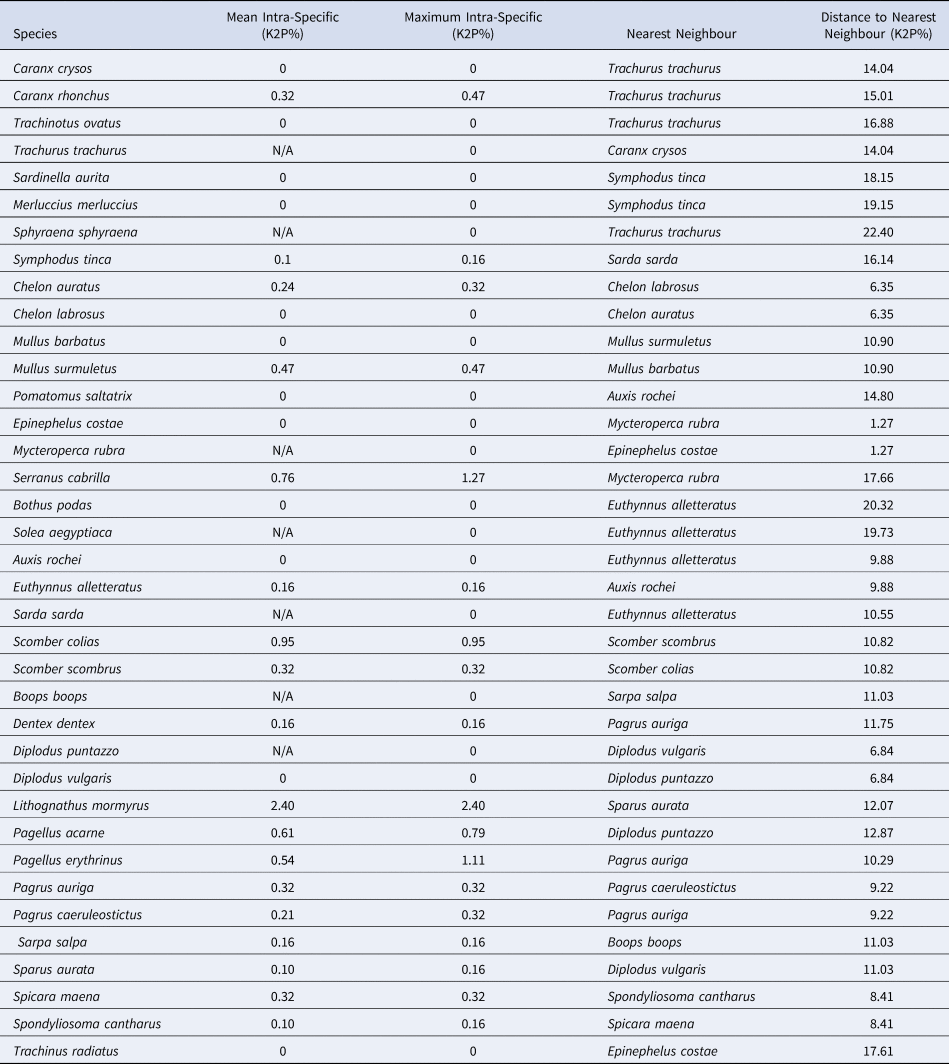
The nucleotide diversity (π) for all analysed samples was 0.1756. The average K2P distances π over all sequence pairs were 20.42% (Table 1). The lowest genetic distance (except intraspecific) was found between the mullids Chelon auratus and C. labrosus (K2P = 6.34%), while the highest was observed between the sparid Lithognathus mormyrus and sphyraenid Sphyraena sphyraena (K2P = 29.34%). The mean intra-taxon K2P genetic distance increased with the taxonomic level: 0.52% within species, 6.86% between species within the genus and 14.60% between genera within the family (Table 1). All obtained COI sequences were found to share 97–100% identity with existing BOLD and GenBank database entries (Table S2). The best scoring partition of the ASAP analysis yielded 36 MOTUs (asap–score = 1.50, df = 176; P = 0.0029), as the serranids Epinephelus costae and Mycteroperca rubra were grouped as one. Barcode gap analysis revealed that only one species (L. mormyrus, K2P = 2.4%) had a maximum intraspecific distance above the 2% usually considered for species delimitation (Table 2). Additionally, the mean distance to the NN was K2P = 12.0%, while the maximum was detected between the carangid Trachurus trachurus and sphyraenid S. sphyraena (K2P = 22.36%) (Table 2; Figure 2). In agreement with the ASAP results, the minimum distance to the NN observed between E. costae and M. rubra (K2P = 1.27%), issued an alert for the potential absence of the barcode gap. Notwithstanding, this distance to the NN was higher than the maximum intra-specific distance in E. costae (K2P = 0.0) and M. rubra was a singleton species in our database. Accordingly, the barcoding gap analysis showed that all comparisons presented a barcode gap as all points were above the red line in the scatterplot (Figure 2). Attention should be taken, as our database was composed of several single-specimen species (not applicable for this analysis). It should also be noted that some NNs were not congenerics (Table 2).
Barcoding gap analysis for the commercially relevant fish species in Tunisian waters. Maximum intra-specific distance (%) was plotted against the nearest neighbour (inter-specific) distance (%) in the barcode region of COI. Genetic divergence was based on the Kimura 2-parameter (K2P) model (%).

Summary of genetic distances (K2P%) within different taxonomic levels based on 637 bp COI sequences for the commercially relevant fish species in Tunisian waters

Barcoding Gap Analysis: mean and maximum intraspecific values for each species, compared with the nearest neighbour distance, based on COI sequences for the commercially relevant fish species in Tunisian waters

Distances estimated under the Kimura 2-parameter(K2P) model. Where the species is a singleton, N/A is displayed for intraspecific values.
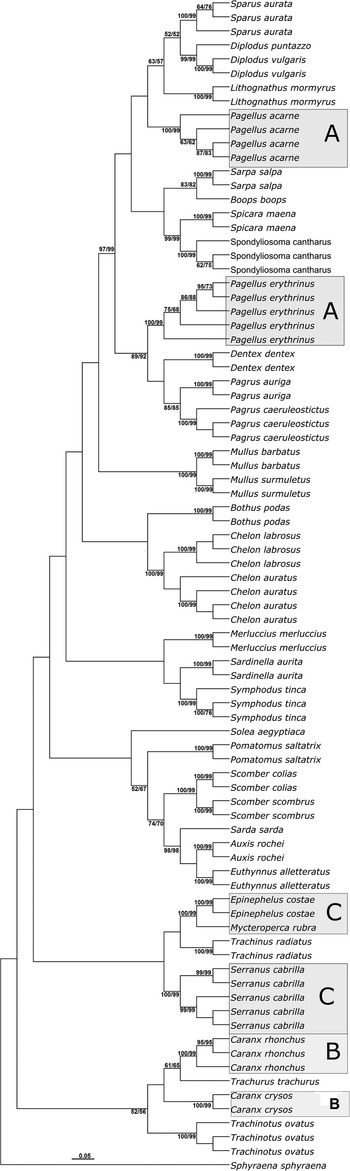
The ML phylogenetic analysis yielded a tree topology congruent with the barcoding and K2P results (data not shown). The Neighbour joining (NJ) and Maximum likelihood (ML) analyses gave essentially the same topology, and for the sake of simplicity, we only represent the phylogenetic tree corresponding to the ML analysis (Figure 3). All specimens from the same species were clustered together, reflecting the prior taxonomic assignment based on morphology, and the corresponding nodes were supported by bootstrap values of 100 (Figure 3). The authentication by the barcode approach was confirmed, as no taxonomic deviation was detected at the species level. Only two situations are worth mentioning at the genus level: (a) the sparid Pagellus appeared as a paraphyletic genus, with P. acarne clustering with Diplodus vulgaris, D. puntazzo, L. mormyrus and Sparus aurata, while its congeneric P. erythrinus clustered with Dentex dentex, Pagrus auriga and P. caeruleosticus (Figure 3, cluster A), T. trachurus clustered with Caranx rhonchus, thus separating it from Caranx crysos and preventing the monophyly of the carangid Caranx (Figure 3, cluster B). All other congeneric samples were resolved. The vast majority of the genera of the same family were confirmed to cluster together, with high bootstrap levels. The only exception was found for Serranidae (Figure 3, cluster C), where Serranus cabrilla was clearly separated from the remaining specimens (M. rubra and E. costae) which clustered together with Trachinus radiatus, the only representatives of Trachinidae. Similar results were obtained for the ML analysis for the 37 retrieved sequences from GenBank (Figure S2 in Supplementary Material). The Bayesian inference recovered a tree congruent with both NJ and ML analyses, but with members of the Serranidae family being clustered together (Figure S3 in Supplementary Material).
Maximum likelihood tree generated based on the 84 COI sequences of the 37 commercially relevant fish species in Tunisian waters. Values above branches indicate bootstraps values percentages (>50) for Neighbour joining (NJ) and Maximum likelihood (ML) respectively.

Discussion
In this study, we were able to validate the efficacy of the DNA barcoding technology by successfully amplifying 637 bp of the COI gene and identifying 37 species representing 14 families and five orders of commercially relevant marine fish in Tunisia. The barcoded sequences clearly discriminated the taxonomic status of all 37 species examined. The base composition analysis of the COI sequences revealed overall GC content very similar to those found in previous barcoding studies of fish species (Saccone et al., Reference Saccone, De Giorgi, Gissi, Pesole and Reyes1999; Ward et al., Reference Ward, Zemlac, Innes, Last and Hebert2005; Hubert et al., Reference Hubert, Hanner, Holm, Mandrak, Taylor, Taylor, Burridge, Watkinson, Dumont, Curry, Bentzen, Zhang, April and Bernatchez2008; Lara et al., Reference Lara, de Leon, Rodriguez, Casane, Cote, Bernatchez and Garcia-Machado2010; Lakra et al., Reference Lakra, Verma, Goswami, Lal, Mohindra, Punia, Gopalakrishnan, Singh, Ward and Hebert2011; Bingpeng et al., Reference Bingpeng, Heshan, Zhilan, Chunguang, Yanguo and Jianjun2018; Rabaoui et al., Reference Rabaoui, Yacoubi, Sanna, Casu, Scarpa, Lin, Shen, Arculeo and Qurban2019).
The mean intra-taxon K2P genetic distance increased with the taxonomic level, although the rate of increase declined for the higher taxonomic categories due to substitutional saturation (Table 1). This is consistent with the patterns observed in other fish barcoding studies (Ward et al., Reference Ward, Zemlac, Innes, Last and Hebert2005; Lakra et al., Reference Lakra, Verma, Goswami, Lal, Mohindra, Punia, Gopalakrishnan, Singh, Ward and Hebert2011; Zhang, Reference Zhang2011; Keskin & Atar, Reference Keskin and Atar2013; Bingpeng et al., Reference Bingpeng, Heshan, Zhilan, Chunguang, Yanguo and Jianjun2018; Wang et al., Reference Wang, Wu, Liu, Liu, Zhao, Liu and You2018; Thu et al., Reference Thu, Huang, Chou, Van Quan, Van Chien, Li, Shao and Liao2019). The mean intraspecific divergence found in Tunisian waters (K2P = 0.52%) was higher than that observed in previous studies (Ward et al., Reference Ward, Zemlac, Innes, Last and Hebert2005; Hubert et al., Reference Hubert, Hanner, Holm, Mandrak, Taylor, Taylor, Burridge, Watkinson, Dumont, Curry, Bentzen, Zhang, April and Bernatchez2008; Steinke et al., Reference Steinke, Zemlak, Boutillier and Hebert2009; Valdez-Moreno et al., Reference Valdez-Moreno, Ivanova, Elias-Gutierrez, Contreras-Balderas and Hebert2009; Lakra et al., Reference Lakra, Verma, Goswami, Lal, Mohindra, Punia, Gopalakrishnan, Singh, Ward and Hebert2011; Zhang, Reference Zhang2011; Zhang & Hanner, Reference Zhang and Hanner2012; Keskin & Atar, Reference Keskin and Atar2013; Bingpeng et al., Reference Bingpeng, Heshan, Zhilan, Chunguang, Yanguo and Jianjun2018; Thu et al., Reference Thu, Huang, Chou, Van Quan, Van Chien, Li, Shao and Liao2019; Alam et al., Reference Alam, Alkuwari, Alhashimi and Almalki2020) and much lower than the 0.6% reported by Lara et al. (Reference Lara, de Leon, Rodriguez, Casane, Cote, Bernatchez and Garcia-Machado2010). Indeed, it is still much lower than the 2% needed to annotate the existence of new cryptic species. Although barcode analyses primarily seek to define species boundaries at the COI locus to assign unknown individuals to known species, the unsuspected diversity and overlooked species are often detected through barcode analyses, sometimes astoundingly (Meyer & Paulay, Reference Meyer and Paulay2005; Kerr et al., Reference Kerr, Stoeckle, Dove, Weigt, Francis and Hebert2007). In this study, the estimated mean K2P distance within species was 0.52%, whereas it was 6.86% for the species within genera (Table 1), i.e. there was a 13.2-fold more sequence difference among congeneric species than conspecific individuals, which is relatively similar to the 13.9-fold observed in the Canadian Atlantic marine fishes (McCusker et al., Reference McCusker, Denti, Van Guelpen, Kenchington and Bentzen2013). However, it is clearly lower than the 22-fold by Saccone et al. (Reference Saccone, De Giorgi, Gissi, Pesole and Reyes1999) and Lakra et al. (Reference Lakra, Verma, Goswami, Lal, Mohindra, Punia, Gopalakrishnan, Singh, Ward and Hebert2011), 25-fold by Ward et al. (Reference Ward, Zemlac, Innes, Last and Hebert2005), 26.2-fold by Kenchington et al. (Reference Kenchington, Baillie, Kenchington and Bentzen2017) and 31-fold by Bingpeng et al. (Reference Bingpeng, Heshan, Zhilan, Chunguang, Yanguo and Jianjun2018), but it falls within the range of 10.4- and 66.7-fold reported by Asgharian et al. (Reference Asgharian, Sahafi, Ardalan, Shekarriz and Elahi2011) and 46.35% by Alam et al. (Reference Alam, Alkuwari, Alhashimi and Almalki2020).
The results revealed some clear phylogenetic signals (Figure 3 and Figures S2 and S3 in Supplementary Material), exceeding the primary goal of barcode analysis to delineate species boundaries. In all phylogenetic trees, the conspecifics were clustered together, reflecting the prior taxonomic assignment based on morphology. Generally, congeneric species clustered together, and in most cases, so did the confamilial species. The only exceptions found in this study were related to the genera Pagellus and Caranx that appeared paraphyletic (Figure 3, clusters A and B, respectively). The non-monophyly of Pagellus (Figure 3, cluster A) has previously been recorded in other barcoding studies in the Mediterranean, e.g. Turkey (Keskin & Atar, Reference Keskin and Atar2013), and works on the phylogeny of Sparidae, e.g. cytb (Hanel & Sturmbauer, Reference Hanel and Sturmbauer2000) and 16S (Orrell & Carpenter, Reference Orrell and Carpenter2004). Regarding the genus Caranx (Figure 3, cluster B), our results corroborate earlier studies by Meynard et al. (Reference Meynard, Mouillot, Mouquet and Douzery2012), which also separated C. rhonchus from its cluster with Trachurus. Similar results have been reported by Springer & Smith-Vaniz (Reference Springer and Smith-Vaniz2008) using vertebral formulae, which clearly separated C. rhonchus from other members of the genus Caranx. With a broader dataset and a larger number of genera and species within the Carangidae Family, Reed et al. (Reference Reed, Carpenter and deGravelle2002) and Damerau et al. (Reference Damerau, Freese and Hanel2018) obtained molecular support for allocating C. rhonchus to the genus Decapterus, which was not present in our study. Finally, our results revealed a distance to NN of K2P = 17.61% between Trachinus radiatus and Epinephelus costae (Table 2), close to the maximum distance of K2P = 16.68% between confamilial species (Table 1; Figure 3, cluster C). Moreover, since T. radiatus was the only member of the Trachinidae, it was clustered under the genetically closest family, Serranidae. Deviation at the family level has been previously reported by Keskin & Atar (Reference Keskin and Atar2013), in which the only representative of the Centracanthidae family is placed within the Sparidae family.
In conclusion, the barcoding results of the finfish DNA analysed here are congruent with the taxonomic positions based on morphological characters as reported in the FAO identification sheets. Thus, this study strongly authenticates the efficiency of COI in identifying fish species using designated barcodes. Furthermore, our results confirm that COI barcoding can be used as a practical approach to resolving any ambiguous identification of fish fauna on the Tunisian coast and establishing a reliable DNA barcode reference library for these species. These DNA barcodes will contribute to future efforts to achieve better monitoring, conservation and management of fisheries in Tunisia.
Supplementary material
The supplementary material for this article can be found at https://doi.org/10.1017/S0025315422000352
Acknowledgements
The authors are grateful to all the people and fishermen who helped us to collect the fish samples at the different sampling sites. The authors are thankful to Karen Avellaneda for her help with laboratory work. We also thank the two anonymous reviewers who reviewed our paper for their very useful and informative comments.
Author contributions
All authors contributed to the conceptualization, discussion and writing of this article. In addition, all authors read and approved the final version of the manuscript.
Financial support
This work was supported by funding from the Fundação para a Ciência e Tecnologia (FCT) Portugal, through the strategic projects MARE/UIDB/MAR/04292/2020 and MARE/UIDP/MAR/04292/2020 granted to MARE (MARE-ISPA). The FCT had no role in the study design.
Conflict of interest
The authors declare that they have no conflict of any competing interests.
Ethical standards
The Laboratory of Ecology, Biology and Physiology of Aquatic Organisms, Faculty of Sciences of Tunis, University of Tunis El Manar, Tunis, Tunisia, have approved this research. In addition, all procedures in this study were performed following the guidelines for the Proper Conduct of Animal Experiments outlined by the University of Tunis El Manar, Tunis, Tunisia (No. 1474 certificated on 14 August 1995), as well as all applicable international, national and/or institutional guidelines for the care and use of animals in research.
Data availability
The datasets generated during the current study are deposited in the GenBank repository.