




No CrossRef data available.
Article contents
Rey's verbal learning test: Normative data for 1855 healthy participants aged 24–81 years and the influence of age, sex, education, and mode of presentation
Published online by Cambridge University Press: 04 May 2005
Abstract
The Verbal Learning Test (VLT; Rey, 1958) evaluates the declarative memory. Despite its extensive use, it has been difficult to establish normative data because test administration has not been uniform. The purpose of the present study was to gather normative data for the VLT for a large number (N = 1855) of healthy participants aged 24–81 years, using a procedure in which the words to be learned were presented either verbally or visually. The results showed that VLT performance decreased in an age-dependent manner from an early age. The learning capacity of younger versus older adults differed quantitatively rather than qualitatively. Females and higher educated participants outperformed males and lower educated participants over the entire age range tested. Presentation mode affected VLT performance differently: auditory presentation resulted in a better recall on Trial 1 (a short-term or working memory measure), whereas visual presentation yielded a better performance on Trial 3, Trial 4, and Delta (a learning measure). (JINS, 2005, 11, 290–302.)
Information
- Type
- Research Article
- Information
- Journal of the International Neuropsychological Society , Volume 11 , Issue 3 , May 2005 , pp. 290 - 302
- Copyright
- © 2005 The International Neuropsychological Society
INTRODUCTION
The declarative aspect of memory—the memory for specific facts or experiences (Squire, 1987)—is of particular interest in neuropsychology (Lezak, 1995; Woodruff-Pak, 1997). Consequently, a large number of tests to assess declarative memory have been developed, most notably the Verbal Learning Test of Rey (1958), the Buschke Selective Reminding Test (Buschke, 1973), and the California Verbal Learning Test (Delis et al., 1987). The present study focuses on the Verbal Learning Test (VLT; Brand & Jolles, 1985; Rey, 1958), an easily administered multitrial learning test (Lezak, 1995). In the VLT, fifteen monosyllabic words are presented in five subsequent trials, with a free recall procedure immediately following each presentation. After a delay of about 20 min, there is an additional free recall trial, followed by a recognition trial. Although the VLT is widely used in clinical practice and in memory research, its administration has not been uniform, which makes the finding of normative data difficult (Schmidt, 1996). Thus in this study, we sought to establish normative data for the VLT, using a procedure in which words were presented visually, on a computer screen, or auditorily, by means of an audio system. The normative data were derived from a cross-sectional study involving a large number of healthy participants (N = 1855) aged 24–81 years, matched for education and sex.
We decided to evaluate both auditory and visual stimulus presentation because earlier studies with other learning tasks suggested that presentation mode significantly affects the performance on short-term memory tasks. More specifically, auditorily presented material is recalled better than visually presented material. This phenomenon has been termed the “modality effect” (see e.g., Greene, 1992; Penney, 1989), and has been observed in both younger and older adults (Taub, 1972, 1973). In contrast with short-term memory tasks, modality effects are conspicuously absent in long-term memory tasks (Penney, 1989). These results suggest that certain VLT measures, especially the Trial 1 score, might be significantly influenced by the mode of presentation, since it measures short-term memory. It is important to have normative data for two different sensory modality versions of the VLT (Van Boxtel et al., 2000) because participants, and especially older individuals, may have visual or hearing impairments. This is especially relevant in the clinical assessment of older patients (La Rue, 1992), in whom a diagnosis of dementia may depend—in part—on the VLT performance score.
Previous research has suggested that the VLT performance is significantly affected by demographic variables, most notably age, sex, and education. For a comprehensive overview of previous VLT research, the reader is referred to Schmidt (1996). Geffen et al. (1990) found in a study of 153 healthy participants (age range 16–86 years) that females outperformed males and that general VLT performance deteriorated with increasing age. Lannoo and Vingerhoets (1997) reported similar findings in their study of 200 healthy participants aged 18–74 years. They found that females, young adults, and participants with a higher educational level performed better than males, older adults, and lower educated participants. Uchiyama and colleagues (1995) investigated the influence of test form, age, ethnicity, and education on VLT performance in a large sample of 2056 healthy bisexual and homosexual HIV-seronegative males. Age was negatively and education positively related to general VLT performance. In contrast, Bolla-Wilson and Bleecker (1986) found that age affected performance on the first two learning trials only and that education did not have any effect in their study of 114 participants aged between 40–84 years. However, higher verbal intelligence was associated with a better performance as was sex, with females performing better than males. Savage and Gouvier (1992) investigated the influence of age and sex in a sample of 134 healthy participants aged 16–76 years. They reported a significant negative influence of increasing age on general VLT performance, whereas sex had no influence on test performance.
Since most—but not all—VLT studies suggested that demographic factors, such as age, sex, and education, significantly affect VLT performance, the influence of these variables on VLT performance was investigated (next to presentation mode) in the present study in order to adequately stratify the normative data.
METHOD
Participants
The data used in this study were derived from the Maastricht Aging Study (Bosma et al., 2003; Jolles et al., 1995; Van Boxtel et al., 1998, 2000), a prospective study of determinants of cognitive aging. Participants were recruited from the Registration Network Family Practices, a sample frame for research in primary care (Metsemakers et al., 1992). Individuals were invited to participate in the study by their general practitioners, rather than by the project staff, because this was expected to improve participation and study compliance. All participants were aged between 24–81 years, and all were without documented medical conditions that could interfere with normal cognitive aging: individuals with chronic neurological pathology (e.g., dementia, cerebrovascular disease, epilepsy, parkinsonism, and malignancies related to the nervous system), mental retardation, psychopathology, or chronic psychotropic drug use were excluded. The sample was stratified for age (12 levels, ranging from 25 ± 1 year, 30 ± 1 year, … , to 80±1 year), sex, and level of education (3 levels: low, average, and high). Level of education (LE) was assessed by classifying formal schooling in a system often used in the Netherlands (De Bie, 1987), which is comparable with the International Standard Classification of Education (UNESCO, Paris, 1976). Three groups were formed—those with at most primary education (LE low), those with junior vocational training (LE average), and those with senior vocational or academic training (LE high). These three levels of education corresponded with an average of respectively 8.60, 11.41, and 15.25 years of full-time education in the sample (SD = 1.95, 2.48, and 3.31, respectively).
Not all data for the 1855 participants administered the VLT were included in the analyses. Data of participants who scored less than 24 on the Mini-Mental State Examination (Folstein et al., 1975) were excluded, since they could not be considered to be “cognitively intact”. For the auditory VLT version, an additional exclusion criterion was a hearing loss of 35 dB or more in the better ear. After these corrections—which excluded the data of 75 participants—the data of 1780 participants were analyzed (auditory VLT, n = 450; visual VLT n = 1330). Basic descriptive data for the sample are provided in Table 1. The ethnic background of all participants was Caucasian, and all participants were native Dutch speakers.
Descriptive characteristics of the sample (N = 1780)

Procedure and Instruments
All participants were tested individually at the neuropsychological laboratory of the Brain and Behaviour Institute (the Netherlands) using a Dutch adaptation of the VLT, the Groningen Vijftienwoorden Test (Groningen Fifteen Words Test), which had been developed earlier by Brand and Jolles (1985). These authors constructed six VLT versions using a pool of 410 monosyllabic words in the Dutch language. These words have a frequency of 20 to 400 per million according to the De La Court count of Dutch words (Linschoten, 1963). Only common words were used which are acquired early in life (before age 6 years) and refer to concrete objects such as flower, crown, bear, tree, etc. Potentially ambiguous words and words referring to emotional factors were not used. Various possible categories of words (e.g., animals, body parts, parts of the house, furniture) were evenly distributed over the lists in order to control for potential semantic associations. Auditory associations were controlled for each list. The test versions were evaluated in control experiments after which particular words were discarded and replaced by new words. The test versions were eventually shown to be parallel and used in numerous drug studies in which repeated administration of parallel versions of tests is essential (e.g., Hijman et al., 1992). In the present study, we used one of these six parallel versions.
The test instructions were read aloud by the experimenter. The participant was required to listen to, or to watch, the fifteen words that were presented by means of an audio system (auditory version) or on a computer screen (visual version) and to repeat as many words as possible as soon as the presentation stopped. There was no restriction on the output order. The first trial was followed by four more trials in which the words were presented in identical order. When the fifth trial was completed, a fixed battery of other cognitive tests was administered for about 20 min. These tests did not involve the learning of verbal material in order to avoid interference with the previously learned VLT words [for a description of these tests, see Jolles et al. (1995)]. After the delay—and unexpectedly for the participants—the instruction was given to recall the words learned (delayed recall). This was followed immediately by a recognition test, involving yes/no recognition of the fifteen words intermixed with fifteen nontarget words.
Stimulus words were presented for 1 s, with an interstimulus interval of 1 s. In the auditory VLT, the words were presented by the digitized voice of a professional speaker, using a high-fidelity stereo speaker system connected to a standard PC-microcomputer. In the visual VLT, stimuli were presented on a 17-inch computer screen operated by a standard PC-microcomputer. All words were displayed in capital letters of the font ‘Times’ size 72, in white against a black background and in the center of the screen. If necessary, the visual VLT was performed with optical correction for nearby vision.
The auditory VLT version was administered to one-fourth of the sample, and the visual VLT to three-fourths of the sample. The participants were divided at random over the conditions on a 1:3 basis (ratio of the number of participants in the auditory versus visual VLT condition) and with the restriction that the proportion of participants that were assessed with the visual versus auditory VLT was equal for each Age group × Level of education × Sex cell.
The data were collected by five test assistants who had been intensively trained in test administration by the neuropsychologists and physician of the project staff. Members of the project staff visited the test assistants during assessment of the VLT at least once a week to ensure uniform test administration and data collection.
Outcome Measures
The following measures were analyzed: (1) Trial 1, 2, 3, 4, and 5 score, the number of correctly recalled words in each of these learning trials. (2) Repetitions, that is, the total number of words repeated over Trials 1–5. Only words that were repeated during the first recall-attempt per trial were scored as repetitions (e.g., flower–crown–bear–crown–…). This precludes that words repeated during the often-seen strategy of overtly repeating a sequence of words are scored as repetitions. (3) Delayed recall, the number of correctly recalled words after the 20-min delay. (4) Total recall 1–5, the total number of correctly recalled words summed over the five learning trials. (5) Total recall 1–3, the total number of correctly recalled words summed over the first three learning trials. (6) Delta, which was calculated as the Trial 3 score minus the Trial 1 score. The latter two scores were used because ceiling effects are often observed in the VLT, especially in younger adults: the increase in the number of words recalled is especially pronounced during the first three learning trials, which makes the scores for the last two learning trials to some extent redundant. Delta differs from the Total recall 1–3 score because it is a learning measure that corrects for the Trial 1 score, which is a measure of short-term and working memory. (7) Recognition, calculated as the number of correct hits minus the number of false positives. This measure is equivalent to the Recognition Percent Correct score (= [true positives + true negatives]/30) proposed by Harris et al. (2002). (8) A Retention score, calculated as the Delayed recall score divided by the Trial 5 score. Thus a retention score of .75 indicates that the individual's score on the delayed recall score was 25% lower than that person's score in Trial 5.
Data Analysis
Multiple linear regression models were fitted using a step-down hierarchical procedure for the VLT measures adjusted for Age, (Age)2 (which enables modelling of quadratic age effects), Sex, Level of education, and Mode of presentation. Since previous VLT research provided equivocal results with respect to the influence of demographic factors on VLT performance—especially with respect to education and sex—the interactions between Age and Education, Age and Sex, (Age)2 and Education, and (Age)2 and Sex were also included in the model. Age was centered (Age = calendar age minus 50) before the quadratic terms and interactions were computed. This was done in order to avoid multicollinearity (Marquardt, 1980; Neter et al., 1989), because high levels of multicollinearity may lead to technical problems when estimating the regression coefficients (Aiken & West, 1991). Level of education (LE) was dummy coded with LE average as the reference category. The dummies LE low and LE high were always either both included in, or both excluded from, the model, since they belong together and represent the effect of the categorical predictor education. Similarly, their interactions with another predictor were always either both included in or excluded from the model. Nonsignificant predictors (p > .005a
A lower alpha level was chosen in order to avoid Type I errors due to multiple testing.
Normative data can then be obtained by calculating the residuals for each VLT score (ei = observed score − predicted score): after standardization of the residuals (Zi = ei /SD[residual]), the performance of the participant can be evaluated via a Z distribution table with cumulative probabilities.
RESULTS
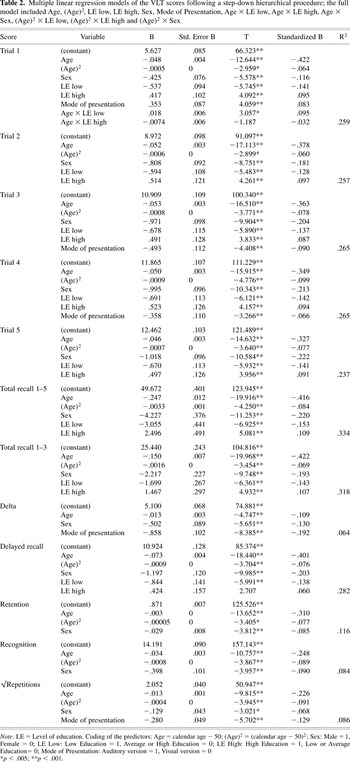
The regression models are presented in Table 2. No significant influence of outliers was observed (maximum Cook's distance .07). The VIFs of the predictors in the regression models were at most 2.7, well below the cut-off value. The Repetitions score was square root transformed (√Repetitions) because of positively skewed residuals before transformation of the score.
Multiple linear regression models of the VLT scores following a step-down hierarchical procedure; the full model included Age, (Age)2, LE low, LE high, Sex, Mode of Presentation, Age × LE low, Age × LE high, Age × Sex, (Age)2 × LE low, (Age)2 × LE high and (Age)2 × Sex

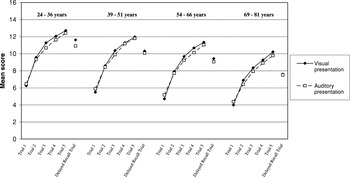
Age was by far the strongest predictor of performance on all VLT scores (see standardized B's, Table 2), with the exception of Delta. An additional quadratic effect of age on VLT performance was observed for most VLT scores, with the exception of Delta, although the quadratic trend was less important than the linear age effect. Females and highly educated participants scored significantly higher than males and their less educated counterparts on most VLT measures. Mode of presentation differentially affected VLT performance: the Trial 1 score was higher with the auditory VLT compared to the visual VLT, and the opposite was found for the Trial 3, 4, Delta, and √Repetitions score. The influence of presentation mode on the VLT Trials 1–5 and the Delayed recall trial performance is shown in Figure 1, for four broad age groups (24–36 years, 39–51 years, 54–66 years, and 69–81 years).

Mean VLT Trial 1, 2, 3, 4, 5, and Delayed recall scores for four Age groups (24–36 years, 39–51 years, 54–66 years, and 69–81 years), separated for Presentation mode.
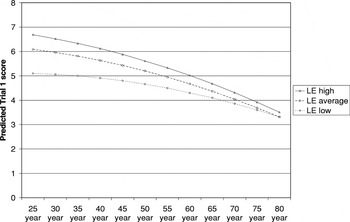
Only one significant interaction was found: an Age × LE low interaction on the Trial 1 score. Figure 2 depicts the predicted Trial 1 scores for male participants for the visual VLT (the shape of these plots was identical for females and for the auditory VLT, with a constant value added or subtracted to the predicted scores—see Table 2). As shown in Figure 2, low-educated participants performed worse compared to average/high-educated participants for all ages, but the difference in performance between the level of education groups decreased with increasing age.

Predicted VLT Trial 1 scores for male participants on the visual VLT, per Level of education category as a function of Age.
Normative data are obtained by calculating the participant's predicted VLT scores, using the regression models (see Table 2). The residuals of each score are then calculated (ei = observed score − predicted score), and standardized (Zi = ei /SD[residual]) using Table 3. Note that the scatter plots of the residuals against the predicted values showed a trend to heteroscedasticity (a decrease in the variance as a function of the predicted scores) for the Recognition and Retention scores. Therefore, the standard deviations of the residuals of these two scores were calculated as a function of the predicted scores divided into quartiles (Table 3). After standardization of the residuals, the participant's performance can be evaluated via a Z distribution table with cumulative probabilities (or a simplified version thereof, see Table 4).
Standard deviations of the residuals per VLT measure

Z score intervals with the corresponding proportion of individuals with a score falling within this interval and corresponding verbal labels

For example, the visual VLT was administered to a 60-year-old man with a low level of education. The participant recalled 5 words in the Delayed recall trial. The predicted Delayed recall score for this person would be 8.063 (= 10.924 + ((60 − 50) * −.073) + ((60 − 50)2 * −.0009) + (1 * −1.197) + (1 * −.844) + (0 * .424)), with a residual of −3.063 (ei = 5 − 8.063). The SD(residual) equals 2.496 and the standardized residual −1.227 (= −3.063/2.496), which corresponds to a p-value of .11, and can be considered “below normal” according to Table 4.
Tables A1, A2, A3, and A4 (in Appendix) provide normative tables based on the regression models in Table 2 for the Trial 1, Delta, Delayed recall, and Recognition scores, stratified by their statistically significant predictors.b
Due to space constraints, we only provide normative tables for the most important VLT measures here. Other scores can be evaluated using the described normative procedure. In the course of 2005, a normative handbook will also made available via Neuropsych Publishers (http://www-np.unimaas.nl/)
DISCUSSION
The results of the present study showed highly significant effects of age on VLT performance. Interestingly, the age-related decline in performance started early in life, in a highly linear fashion: the linear age effect was a much stronger predictor of VLT performance than the quadratic age effect. Put in another way, the age-related differences in general VLT performance were more manifest in a quantitative than in a qualitative way—although the absolute number of recalled words differed as a function of age, the shape of the learning curve was similar (see Figure 1). The results suggested that younger adults outperformed older adults because of a better performance on Trial 1. These differences in Trial 1 performance may be due to differences in processing speed, as suggested by Bolla-Wilson and Bleecker (1986). In clinical practice, the Total recall 1–5 score is the most commonly used learning summary score (Schmidt, 1996). The results of the present study, however, suggest that this measure is not the most appropriate one. Such a summary measure suggests that the differences in learning capacity over the first five trials in the VLT vary largely as a function of age, which was not supported by the results of the present study (see Figure 1). The same criticism applies to the Total recall 1–3 score, although this score has the advantage over the Total recall 1–5 score in that it takes ceiling effects, at least theoretically, into account. A measure such as Delta (= Trial 3 − Trial 1 score) might be a more appropriate learning measure, since it corrects for Trial 1 performance and takes ceiling effects into account, and thus gives a more realistic estimation of the verbal learning capacity of an individual.
Although Schmidt (1996) suggested that the effect of sex appears to be of limited importance in interpreting VLT results, the present study clearly showed significant effects of sex on all VLT measures, with women consistently outperforming men. This finding is in agreement with studies that point to the superior verbal abilities of women, for example on verbal episodic memory tasks (e.g., Herlitz & Yonker, 2002; Yonker et al., 2003) and verbal fluency tasks (e.g., Rideout & Winchester, 1990). With regard to education, the negative impact of a low level of education—as compared to an average level of education—on VLT performance was larger than the positive impact of a high level of education on most VLT scores (see the standardized B values in Table 2). Furthermore, the significant Age × Low level of education interaction on the Trial 1 score suggested that the differences in performance between the low level of education group and the average/high level of education group decreased with increasing age.
It should be noted that Bolla-Wilson and Bleecker (1986) found no effect of education on VLT performance, in contrast to the results of the present study. This difference is most likely attributable to the fact that Bolla-Wilson and Bleecker (1986) used education together with a verbal intelligence measure as predictors of the VLT performance (next to age and sex). It is possible that a variable such as (verbal) intelligence is a more appropriate estimator of a person's general ability than is education, especially in older individuals. Indeed, before the 1960s most people did not continue their schooling, mostly for reasons other than their intellectual capacity, for example, for socio-economic reasons (Jolles et al., 1995). Nevertheless, we used level of education as an estimator of general ability instead of verbal intelligence for two main reasons. First, in order to facilitate the use of normative data, it is important to use a readily available stratification variable. Use of verbal intelligence as a predictor of the VLT performance means that a person would also have to complete a verbal intelligence test before the normative VLT data could be used. This is time-consuming and expensive, and might be difficult in certain groups, for example, elderly people, people with attention disorders, people with a hearing impairment, etc. Second, as with any measurement of a psychological function, there is an error component in the obtained score of a verbal intelligence test. This would introduce an extra source of error to the model (the error component in the score on the verbal intelligence test) in addition to the error component for the different VLT measures.
Mode of stimulus presentation had a significant, but not uniform, influence on some VLT measures. Thus the Trial 1 score was higher with the auditory VLT (in accordance with the modality effect), the Trial 3, 4, Delta, and √Total repetition scores were higher with the visual VLT. It should be noted that in the models predicting the Delayed recall and Trial 5 scores, the predictor Mode of presentation was deleted in the final step of the hierarchical procedure, but was almost significant (p = .008 and p = .010, respectively). Thus, the pattern of results suggests that auditory presentation is associated with a better performance of tasks depending mainly on short-term or working memory processes (VLT Trial 1), whereas visual presentation is associated with a better performance of tasks that depend on long-term memory processes (VLT Delayed recall trial) or tasks that depend on a mixture of short-term and long-term memory processes (VLT Trials 3, 4, and 5). This stresses the importance of using normative data appropriate for the test procedure (stimulus presentation) used. This aspect tends to be overlooked in clinical practice, when tests are computerized even though the normative data were obtained for noncomputerized tests.
At present, it is not known whether the visual VLT or the auditory VLT version should be used as first choice to assess verbal memory or to detect pathological conditions such as, for example, dementia. This issue merits further investigation. However, an important issue to keep in mind regarding this question concerns earlier findings by Van Boxtel and colleagues (2000). These authors suggested that the auditory VLT version underestimates the true memory capacity of people with mild to moderate degrees of hearing loss, even after the volume at which the VLT words are presented is adjusted for individual hearing ability. Importantly, Van Boxtel et al. (2000) also reported a large overlap in hearing acuity between people who did or did not report hearing loss. Therefore, we recommend that the visual VLT version be used to test participants with an unknown (objective) hearing status (even if the participant claims not to have a hearing loss) or with a (even mild) hearing impairment.
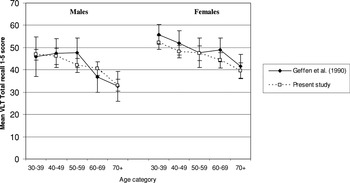
The present data were obtained for a healthy population of native Dutch speakers. It can be questioned whether the normative data of the Dutch VLT are applicable to individuals who have a different native language or cultural background. Recent studies suggested that words that are selected using the same criteria (e.g., comparable with regard to semantic and phonemic features, words that seem equally concrete, words that seem as difficult or easy to cluster by association, etc.) lead to comparable test versions across countries and languages (Van den Burg & Kingma, 1999). This was the case when we compared our data for the auditory VLT version with the results of Geffen and colleagues (1990) obtained with an English-speaking sample. After redefining the age categories of our sample to match those of Geffen et al. (1990) (see Figure 3), we found that the mean VLT Trial 1, 2, 3, 4, 5, and Total recall 1–5 scores in our sample were not significantly different from the corresponding mean scores in their sample (all p > .01c
A series of two-tailed t-tests per age by sex group were performed instead of a more appropriate technique, for example ANOVA with Age category and Sex as between subject factors, since we did not have access to the raw dataset of Geffen et al. (1990).

Mean auditory VLT Total recall 1–5 scores for males (left) and females (right) separated for Age category (and 95% Confidence Interval).
We were not able to compare the scores for the visual VLT (because Geffen and colleagues did not administer a visual VLT version), and for certain VLT measures, such as Recognition and Delayed recall (because Geffen and colleagues used different test administration and scoring procedures, which means that these scores are not comparable). However, we expect it to be unlikely that English-speaking people would score differently from Dutch-speaking people on a visual version of the VLT, especially when differences were not found with the auditory version of the VLT. Supporting evidence for this claim can also be found in a study of Møller and colleagues (1998), who showed that the Visual Verbal Learning Test (in three trials instead of five) was culturally robust when evaluated in seven different language areas (English, Danish, Dutch, French, German, Greek, and Spanish). Thus, the results of these studies suggest that normative data for a Dutch sample (and normative data for a sample with a language very similar to Dutch, such as German; see Heubrock, 1994) can also be used for samples of English-speaking people.
In summary, we established normative data for the auditory and visual version of the VLT. The data were derived from a large sample of 1855 cognitively intact men and women of different educational levels and ages (range 24–81 years). We used multiple regression models to establish normative data that account for the effects of these variables. The results showed that VLT performance is superior in women, decreases with age, and is associated with level of education. Performance on VLT Trial 1, which depends mainly on short-term or working memory, was better with the auditory version, whereas performance on VLT trials that depend on long-term memory processes or trials that depend on a combination of short-term and long-term memory processes was better with the visual version. Furthermore, although the Total recall 1–5 score is currently the most frequently used VLT learning summary measure, our results indicated that Delta (= Trial 3 − Trial 1) may provide a better estimation of the verbal learning capacity of an individual.
APPENDIX
Normative VLT data for the Trial 1 score stratified by Mode of presentation, Level of education, Sex, and, Age (25, 30, … , 80 years). The raw test score leading to a particular Z-value is given for Z-values indicating the percentiles 5, 10, 20, 50, 80, 90, and, 95

Normative VLT data for the Delta score stratified by Mode of presentation, Sex, and, Age (25, 30, … , 80 years). The raw test score leading to a particular Z-value is given for Z-values indicating the percentiles 5, 10, 20, 50, 80, 90, and, 95

Normative VLT data for the Delayed recall score stratified by Level of education, Sex, and, Age (25, 30, … , 80 years). The raw test score leading to a particular Z-value is given for Z-values indicating the percentiles 5, 10, 20, 50, 80, 90, and, 95

Normative VLT data for the Recognition score stratified by Sex and Age (25, 30, … , 80 years). The raw test score leading to a particular Z-value is given for Z-values indicating the percentiles 5, 10, 20, 50, 80, 90, and, 95

References
REFERENCES
Aiken, L.S. &
West, S.G.
(1991).
Multiple regression: Testing and interpreting interactions.
Newbury Park, California:
Sage.
Belsley, D.A.,
Kuh, E., &
Welsch, R.E.
(1980).
Regression diagnostics: Identifying influential data and sources of
collinearity.
New York:
Wiley.
Bolla-Wilson, K. &
Bleecker, M.L.
(1986).
Influence of verbal intelligence, sex, age, and education on the Rey
auditory verbal learning test.
Developmental Neuropsychology,
2,
203–211.Google Scholar
Bosma, H.,
Van Boxtel, M.P.J.,
Ponds, R.W.H.M.,
Houx, P.J., &
Jolles, J.
(2003).
Mental work demands protect against cognitive impairment: MAAS
prospective cohort study.
Experimental Aging Research,
29,
33–45.Google Scholar
Brand, N. &
Jolles, J.
(1985).
Learning and retrieval rate of words presented auditory and
visually.
Journal of General Psychology,
112,
201–210.Google Scholar
Buschke, H.
(1973).
Selective reminding analysis of memory and learning.
Journal of Verbal Learning and Verbal Behaviour,
12,
543–550.Google Scholar
De Bie, S.E.
(1987).
Standaardvragen 1987: Voorstellen voor uniformering van
vraagstellingen naar achtergrondkenmerken en interviews [Standard
questions 1987: Proposal for uniformization of questions regarding
background variables and interviews].
Leiden, The Netherlands:
Leiden University Press.
Delis, D.C.,
Kramer, J.H.,
Kaplan, E., &
Ober, B.A.
(1987).
California Verbal Learning Test Manual.
San Antonia, Texas:
The Psychological Corporation.
Folstein, M.F.,
Folstein, S.E., &
McHugh, P.R.
(1975).
Mini-Mental State: a practical method for grading the cognitive
state of patients for the clinician.
Journal of Psychiatric Research,
12,
189–198.Google Scholar
Geffen, G.,
Moar, K.J.,
O'Hanlon, A.P.,
Clarck, C.R., &
Geffen, L.N.
(1990).
Performance measures of 16- to 86-year-old males and females on the
Auditory Verbal Learning Test.
The Clinical Neuropsychologist,
4,
45–63.Google Scholar
Greene, R.G.
(1992).
Human memory.
Hove, UK:
Lawrence Erlbaum Associates Ltd.
Harris, M.E.,
Ivnik, R.J., &
Smith, G.E.
(2002).
Mayo's Older Americans normative studies: Expanded AVLT
recognition trial norms for ages 57 to 98.
Journal of Clinical and Experimental Neuropsychology,
24,
214–220.Google Scholar
Herlitz, A. &
Yonker, J.E.
(2002).
Sex differences in episodic memory: The influence of
intelligence.
Journal of Clinical and Experimental Neuropsychology,
24,
107–114.Google Scholar
Heubrock, D.
(1994).
Auditiv-verbales Lernen unter standardisierten Bedingungen: Erste
deutsche Normen für 16- bis 26-jährige Männer und Frauen
zum Auditiv-Verbalen Lerntest (AVLT) [Standardized auditory-verbal
learning: Preliminary German Auditory-Verbal Learning Test (AVLT) norms
for a male and female population aged 18 to 26].
Zeitschrift für Differentielle und Diagnostische
Psychologie,
15,
65–76.Google Scholar
Hijman, R.,
Jolles, J.,
Verhoeven, W.M.A.,
Van Ree, J.M.,
Elderson, A., &
De Wied, D.
(1992).
Desglycinamide-(Arg8)-vasopressin in five trials with
memory-disturbed patients.
Human Psychopharmacology: Clinical and Experimental,
7,
7–23.Google Scholar
Jolles, J.,
Houx, P.J.,
Van Boxtel, M.P.J., &
Ponds, R.W.H.M.
(1995).
Maastricht aging study: Determinants of cognitive aging.
Maastricht, The Netherlands:
Neuropsych Publishers.
Lannoo, E. &
Vingerhoets, G.
(1997).
Flemish normative data on common neuropsychological tests: Influence
of age, education, and sex.
Psychologica Belgica,
37,
141–155.Google Scholar
La Rue, A.
(1992).
Aging and neuropsychological assessment.
New York:
Plenum Press.
Lezak, M.D.
(1995).
Neuropsychological assessment
(3rd ed.).
New York:
Oxford University Press.
Linschoten, J.
(1963).
De la Court frequentie tellingen van Nederlandse woorden
(Report No. 6301).
Rijks Universiteit Utrecht, Psychologisch Laboratorium.
Marquardt, D.W.
(1980).
You should standardize the predictor variables in your regression
models.
Journal of the American Statistical Association,
75,
87–91.Google Scholar
Metsemakers, J.F.M.,
Höppener, P.,
Knottnerus, J.A.,
Kocken, R.J.J., &
Limonard, C.B.G.
(1992).
Computerized health information in the Netherlands: A registration
network of family practices.
British Journal of General Practice,
42,
102–106.Google Scholar
Møller, J.T.,
Cluitmans, P.,
Rasmussen, L.S.,
Houx, P.J.,
Rasmussen, H.,
Canet, J.,
Rabbitt, P.,
Jolles, J.,
Larsen, K.,
Hanning, C.D.,
Langeron, O.,
Johnson, T.,
Lauven, P.M.,
Kristensen, P.A.,
Biedler, A.,
van Beem, H.,
Fraidakis, O.,
Silverstein, J.H.,
Beneken, J.E.W., &
Gravenstein, J.S.
(1998).
Long-term postoperative cognitive dysfunction in the elderly:
ISPOCD1 study.
The Lancet,
351,
857–861.Google Scholar
Neter, J.,
Wasserman, W., &
Kutner, M.H.
(1989).
Applied linear regression models
(2nd ed.).
Homewood, Illinois:
Irwin.
Penney, C.G.
(1989).
Modality effects and the structure of short-term verbal
memory.
Memory and Cognition,
17,
398–422.Google Scholar
Rey, A.
(1958).
L'examin clinique en psychologie.
Paris, France:
Presses Universitaires de France.
Rideout, B.E. &
Winchester, L.
(1990).
Effects on verbal fluency associated with sex, practice, and
stimulus letter.
Perceptual and Motor Skills,
71,
656–658.Google Scholar
Savage, R.M. &
Gouvier, W.D.
(1992).
Rey auditory-verbal learning test: The effects of age and gender,
and norms for delayed recall and story recognition trials.
Archives of Clinical Neuropsychology,
7,
407–414.Google Scholar
Schmidt, M.
(1996).
Rey Auditory Verbal Learning Test: A Handbook.
Los Angeles, California:
Western Psychological Services.
Squire, L.R.
(1987).
Memory and brain.
London, UK:
Oxford University Press.
Taub, H.A.
(1972).
A comparison of young adult and old groups on various digit span
tasks.
Developmental Neuropsychology,
6,
60–65.Google Scholar
Taub, H.A.
(1973).
Memory span, practice, and aging.
Journal of Gerontology,
28,
335–338.Google Scholar
Uchiyama, C.L.,
D'Elia, L.F.,
Dellinger, A.M.,
Becker, J.T.,
Selnes, O.A.,
Welsch, J.E.,
Chen, B.B.,
Satz, P.,
Van Gorp, W., &
Miller, E.N.
(1995).
Alternate forms of the auditory-verbal learning test: Issues of test
comparability, longitudinal reliability, and moderating demographic
variables.
Archives of Clinical Neuropsychology,
10,
133–145.Google Scholar
United Nations Educational, Scientific and Cultural Organisation
(UNESCO)
(1976).
International Standard Classification of Education (ISCED).
Paris, France:
UNESCO.
Van Boxtel, M.P.J.,
Buntinx, F.,
Houx, P.J.,
Metsemakers, J.F.M.,
Knottnerus, A., &
Jolles, J.
(1998).
The relation between morbidity and cognitive performance in a normal
aging population.
Journals of Gerontology Series A: Biological Sciences and Medical
Sciences,
53A,
M147–M154.Google Scholar
Van Boxtel, M.P.J.,
van Beijsterveldt, C.E.M.,
Houx, P.J.,
Anteunis, L.J.C.,
Metsemakers, J.F.M., &
Jolles, J.
(2000).
Mild hearing impairment can reduce verbal memory performance in a
healthy adult population.
Journal of Clinical and Experimental Neuropsychology,
22,
147–154.Google Scholar
Van den Burg, W. &
Kingma, A.
(1999).
Performance of 225 Dutch school children on Rey's Auditory
Verbal Learning Test (AVLT): Parallel test–retest reliabilities with
an interval of 3 months and normative data.
Archives of Clinical Neuropsychology,
14,
545–559.Google Scholar
Woodruff-Pak, D.S.
(1997).
The neuropsychology of aging.
Malden:
Blackwell Publishers.
Yonker, J.E.,
Eriksson, E.,
Nilsson, L., &
Herlitz A.
(2003).
Sex differences in episodic memory: Minimal influence of
estradiol.
Brain and Cognition,
52,
231–238.Google Scholar

Descriptive characteristics of the sample (N = 1780)
Multiple linear regression models of the VLT scores following a step-down hierarchical procedure; the full model included Age, (Age)2, LE low, LE high, Sex, Mode of Presentation, Age × LE low, Age × LE high, Age × Sex, (Age)2 × LE low, (Age)2 × LE high and (Age)2 × Sex
Mean VLT Trial 1, 2, 3, 4, 5, and Delayed recall scores for four Age groups (24–36 years, 39–51 years, 54–66 years, and 69–81 years), separated for Presentation mode.
Predicted VLT Trial 1 scores for male participants on the visual VLT, per Level of education category as a function of Age.

Standard deviations of the residuals per VLT measure

Z score intervals with the corresponding proportion of individuals with a score falling within this interval and corresponding verbal labels
Mean auditory VLT Total recall 1–5 scores for males (left) and females (right) separated for Age category (and 95% Confidence Interval).
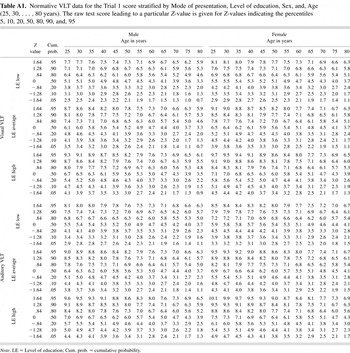
Normative VLT data for the Trial 1 score stratified by Mode of presentation, Level of education, Sex, and, Age (25, 30, … , 80 years). The raw test score leading to a particular Z-value is given for Z-values indicating the percentiles 5, 10, 20, 50, 80, 90, and, 95
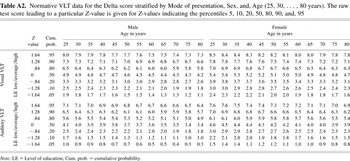
Normative VLT data for the Delta score stratified by Mode of presentation, Sex, and, Age (25, 30, … , 80 years). The raw test score leading to a particular Z-value is given for Z-values indicating the percentiles 5, 10, 20, 50, 80, 90, and, 95
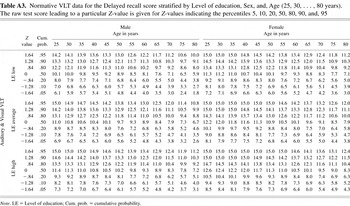
Normative VLT data for the Delayed recall score stratified by Level of education, Sex, and, Age (25, 30, … , 80 years). The raw test score leading to a particular Z-value is given for Z-values indicating the percentiles 5, 10, 20, 50, 80, 90, and, 95
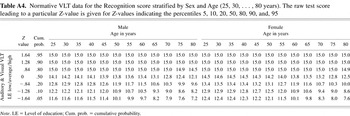
Normative VLT data for the Recognition score stratified by Sex and Age (25, 30, … , 80 years). The raw test score leading to a particular Z-value is given for Z-values indicating the percentiles 5, 10, 20, 50, 80, 90, and, 95
 You have
Access
- 541
- Cited by