


Introduction
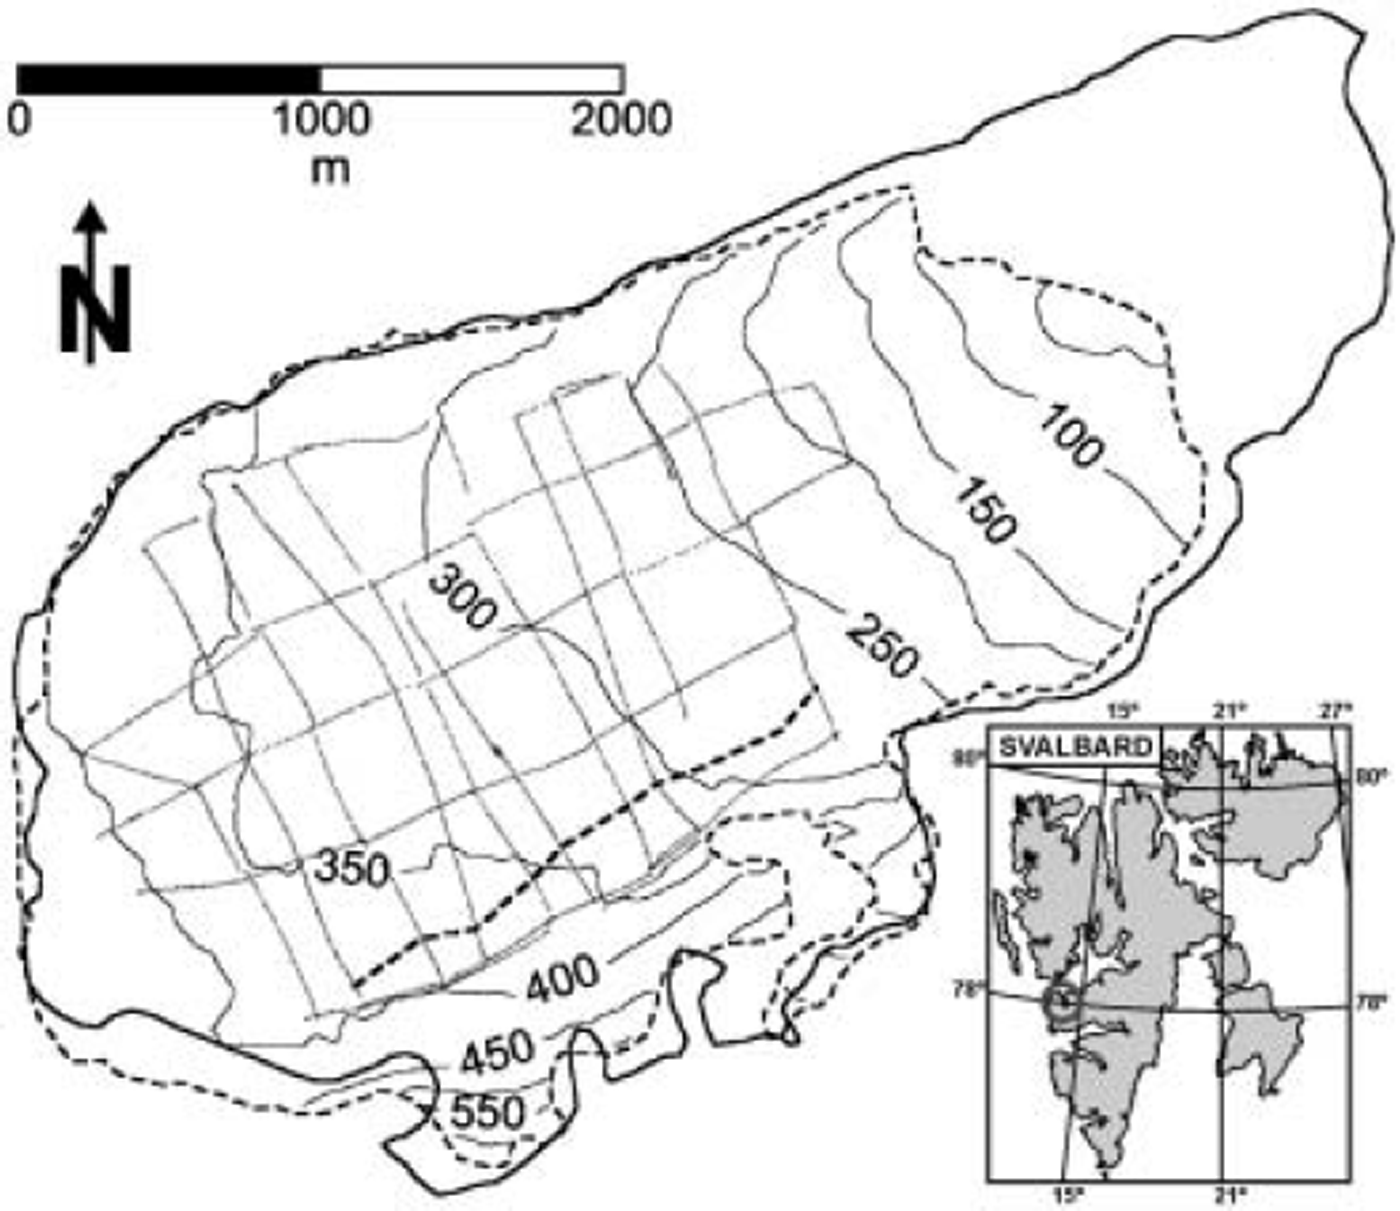
Aldegondabreen is a small (∼7.6 km2 in 1990) valley glacier located in the Grønfjorden area of Spitsbergen, Svalbard (∼77˚58’ N, 14˚05’ E; Fig. 1). The glacier terminates on land and presently spans a 30–450 m altitude range. Radio-echo sounding from a helicopter, using a 440MHz radar, was performed in 1974/75 along a longitudinal profile of the glacier, revealing a polythermal two-layered structure and maximum ice thickness along the profile of 150 m (Reference Macheret and ZhuravlevMacheret and Zhuravlev, 1980). Radio-echo sounding has often been used as a tool for investigating the two-layered structure of Svalbard polythermal glaciers (e.g. Reference Glazovskiy, Kolondra, Moskalevskiy and YaniyaGlazovskiy and others, 1992; Reference BjörnssonBjörnsson and others, 1996; Reference MooreMoore and others, 1999).
Surface map of Aldegondabreen showing the contour lines of the DEM retrieved from 1990 aerial photographs. The radar profiles done in 1999 are also shown, as well as the location of the suspected englacial water channel (thick dashed line). The glacier margins for 1936 (solid line) and 1990 (dotted line) are shown. The Svalbard inset shows (small circle) the location of Grønfjorden.
There have been few glaciological studies of Aldegondabreen. Well-documented mass-balance data are only available for the balance year 1975/76, for which a net mass balance of -1.10mw.e. was estimated; for the same balance year, the average snow-cover thickness on Aldegondabreen was estimated, from 367 measurements, as 1.16 m (Reference Troitskiy, Guskov, Zinger, Mikhalev and KotlyakovTroitskiy and others, 1985). In 2002/03 the winter balance was measured as +0.45 mw.e. and the summer balance as -1.80 m w.e., resulting in a net annual balance of -1.35 mw.e. In 2003/04, the values were +0.56, -2.27 and -1.71 mw.e. for winter, summer and annual balances, respectively (B.R. Mavlyudov and I.Y. Solovyanova, unpublished information). No documented data on ice velocities are available for Aldegondabreen.
The hydraulic system of Aldegondabreen is one of its most studied aspects. The glacier has a well-developed system of englacial channels and caves, with explored galleries reaching 500 m in length (Reference Eraso and PulinaEraso and Pulina, 2001). Two main water streams emerge from the glacier front, one of them close to the northern glacier wall and the other in the central part of the snout, though another stream or set of streams is known to flow under the lateral–terminal moraine next to the southern wall.
Aldegondabreen has experienced significant retreat since the end of the Little Ice Age (LIA), especially in the second half of the 20th century. This retreat is clearly manifested by the system of terminal moraines. It is also evidenced by several eskers present in the glacier forefield, which also shows some striations and fluted moraines revealing past sliding. The main objective of this paper is to quantify this retreat. The other aim is to improve our knowledge of the structure of Aldegondabreen, as a representative of many small-sized valley glaciers in Spitsbergen ending on land.
Methods
Radar survey
Equipment
The radar data collected in 1999 were acquired using a low-frequency monopulse ice-penetrating radar VIRL-2 (Reference Vasilenko, Sokolov, Macheret, Glazovsky, Cuadrado and NavarroVasilenko and others, 2002, Reference Vasilenko, Glazovsky, Macheret, Navarro, Sokolov and Shiraiwa2003). This consists of transmitter, receiver and digital recording system (DRS). The antennae are resistively loaded half-wave dipoles 5.8m long. The transmitter generates pulses of 25–30 ns, with a peak power of 1.5 kW, at a pulse repetition frequency of 20 kHz. The transmitting system has a centre frequency of 15 MHz; by centre frequency we mean the frequency of the peak of the power spectrum of the radiated pulse. The receiver has a logarithmic amplifier with 100MHz bandwidth and 80 dB input dynamic range. Synchronization between transmitter and receiver is accomplished by a dedicated radio channel. The DRS allows real-time control, and simultaneous recording of the radar signal and navigation information from both global positioning system (GPS) receiver and odometer. The DRS sampling interval is 5 ns, and 4082 samples are recorded for each waveform.
Radar profiles
For profiling, transmitter and receiver were placed on separate wood sledges towed by a snowmobile. The transmitting-receiving antennae were arranged parallel to each other at a distance of 4 m and transverse to the profile direction. An initial survey consisting of 5 longitudinal and 12 transversal profiles was first made using a 5 s time interval between shots, maintaining a constant speed of about 2 ms–1 (∼10m between adjacent records). Many diffraction hyperbolae were detected in the southern part of the glacier. A second, more detailed survey was then performed in this area, consisting of six additional transverse profiles (about 400 m long), using a 1 s time interval (∼2m distance between records). The total length of the profiles was about 40 km. The net of radar profiles is shown in Figure 1.
Data processing
The radar data were processed using the software package RadExPro, by GSD Production (Reference Kulnitsky, Gofman and TokarevKulnitsky and others, 2000), and consisted of static correction, interpolation of radar records, spectral analysis, amplitude correction, bandpass filtering, deconvolution, radio-wave velocity calculation, migration, Gilbert transformation (instantaneous phase), interactive picking of signals reflected from the glacier bed and time-to-depth conversion. For the latter, a radio-wave velocity (RWV) of 168 m μs-1, which is the transition value between cold and temperate ice (Reference Macheret, Moskalevsky and VasilenkoMacheret and others, 1993), was used as a compromise value between that obtained from a common-midpoint (CMP) measurement made near the glacier snout and those estimated from diffraction hyperbolae shown in the radar records. The processing details are discussed in Reference VasilenkoVasilenko and others (2001).
Estimation of ice-volume changes (1936-90)
The length, area, average thickness and volume changes of Aldegondabreen during the period 1936-90 were calculated by comparing the B10 sheet (Van Mijenfjorden, Spitsbergen) of the 1 :100000 Svalbard topographic map (Reference Hjelle, Lauritzen, Salvigsen and WinsnesHjelle and others, 1986), which is a photogrammetric compilation from aerial photographs dated 1936 and 1938, and a digital elevation model (DEM) of Aldegondabreen constructed by us from aerial photographs taken in 1990. The latter was prepared from four false-colour aerial photographs produced by the Norwegian Polar Research Institute and taken on 22 July and 12 August 1990 (Nos. S902069 and S902070, S904130 and S904131; flight altitude 7600 m; focal length 152.83 mm). The photos were bundled, orthorectified and stereomodelled using standard commercial software for image analysis. The DEM was referenced to Universal Transverse Mercator (UTM) 33X zone. Some parts of the glacier at the highest elevations could not be resolved from the stereo pairs. A zero thickness change during 1936-90 has been assumed for such areas. The contour map for the resulting DEM is shown in Figure 1.
Results
Radio-wave velocity
From the fit to a straight line of the squared travel time vs squared distance values obtained by a CMP experiment, we estimated an average RWV of 174.1 ± 3.0 m μs-1 and an ice thickness of 98.8 m at the common midpoint. The correlation coefficient of the fit was R2 = 0.903. The velocity obtained is typical of cold ice, and consistent with the location of the measurement site near the glacier snout, where the temperate ice layer is expected to be absent or very thin.
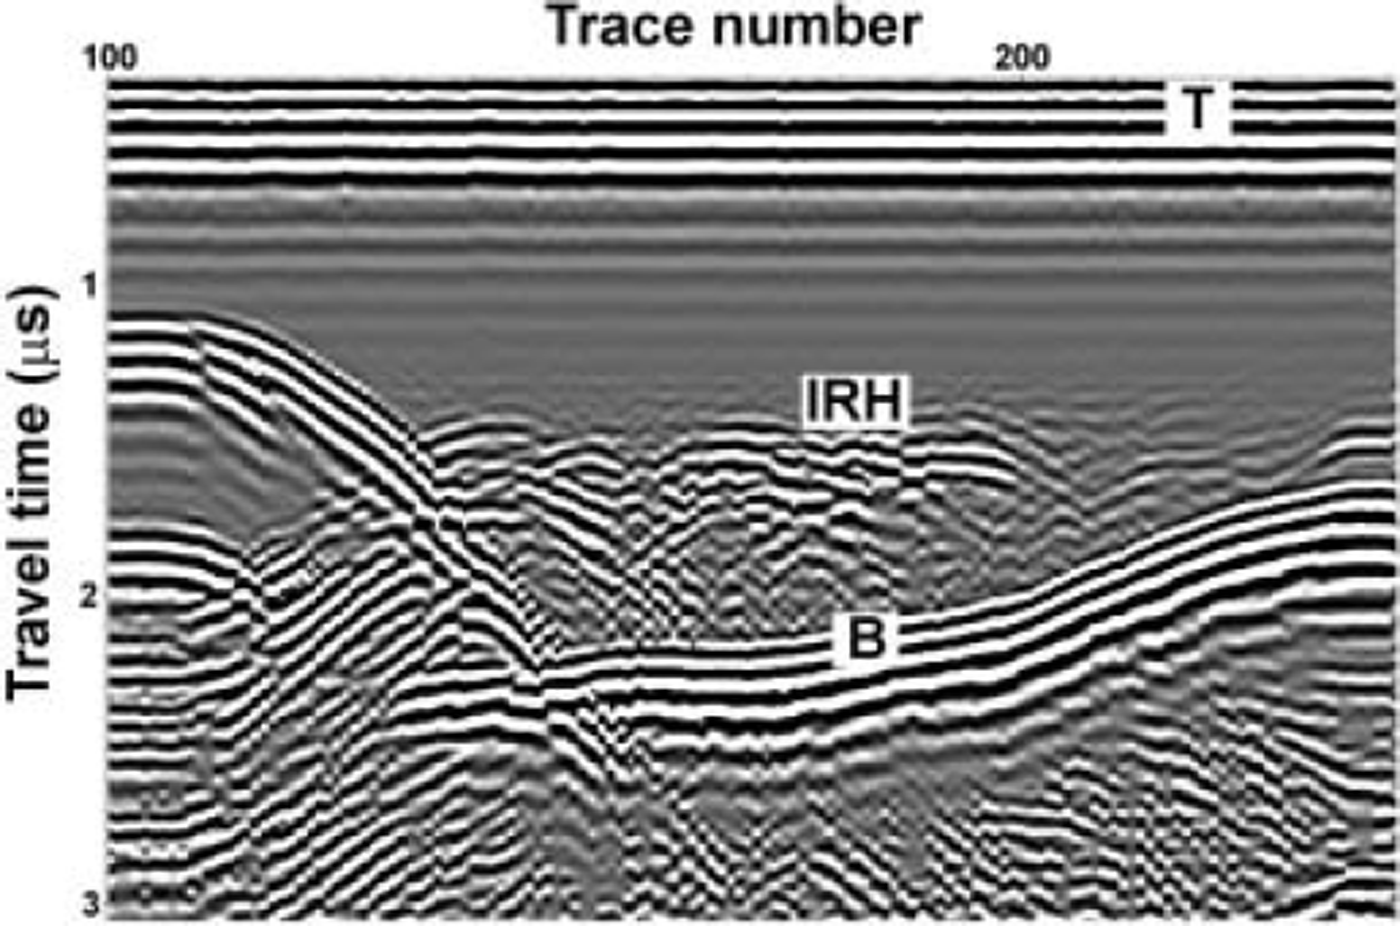
We also estimated the RWV from several diffraction hyperbolae present in the radar profiles, mainly found in the southern part of the glacier at depths of 60-80 m. The average velocity obtained was 164.5 ± 4.1 m μs-1, which is a value typical of temperate ice (Reference Macheret, Moskalevsky and VasilenkoMacheret and others, 1993). Though a temperate ice layer is indeed present in the southern part of the glacier, the fact that it is overlain by a layer of cold ice as thick as 90 m in some areas (see, e.g., Fig. 2) and that the hyperbolae are located at depths of 60-80 m implies that the ice column above the diffractors is mostly cold ice; the RWV should thus be expected to be higher. This indicates that our velocity estimates from diffraction hyperbolae are biased towards low values. Because of this, and taking into account that the RWV of 174.1 m (is-1 determined from CMP data corresponding to an area where mostly cold ice would be expected, we preferred to use, for the time-to-depth conversion, a conservative value of 168 m (is-1, which is the transition value between cold and temperate ice (Reference Macheret, Moskalevsky and VasilenkoMacheret and others, 1993).
Radar section where the difference between cold and temperate ice layers can be appreciated (T: transmitted pulse; IRH: internal reflection horizon; B: bedrock). Clean area above IRH, free of internal reflections, corresponds to cold ice, while more ‘noisy’ area showing many diffractions, located between IRH and bedrock, is temperate ice.
Surface-topography, ice-thickness and subglacial-relief maps
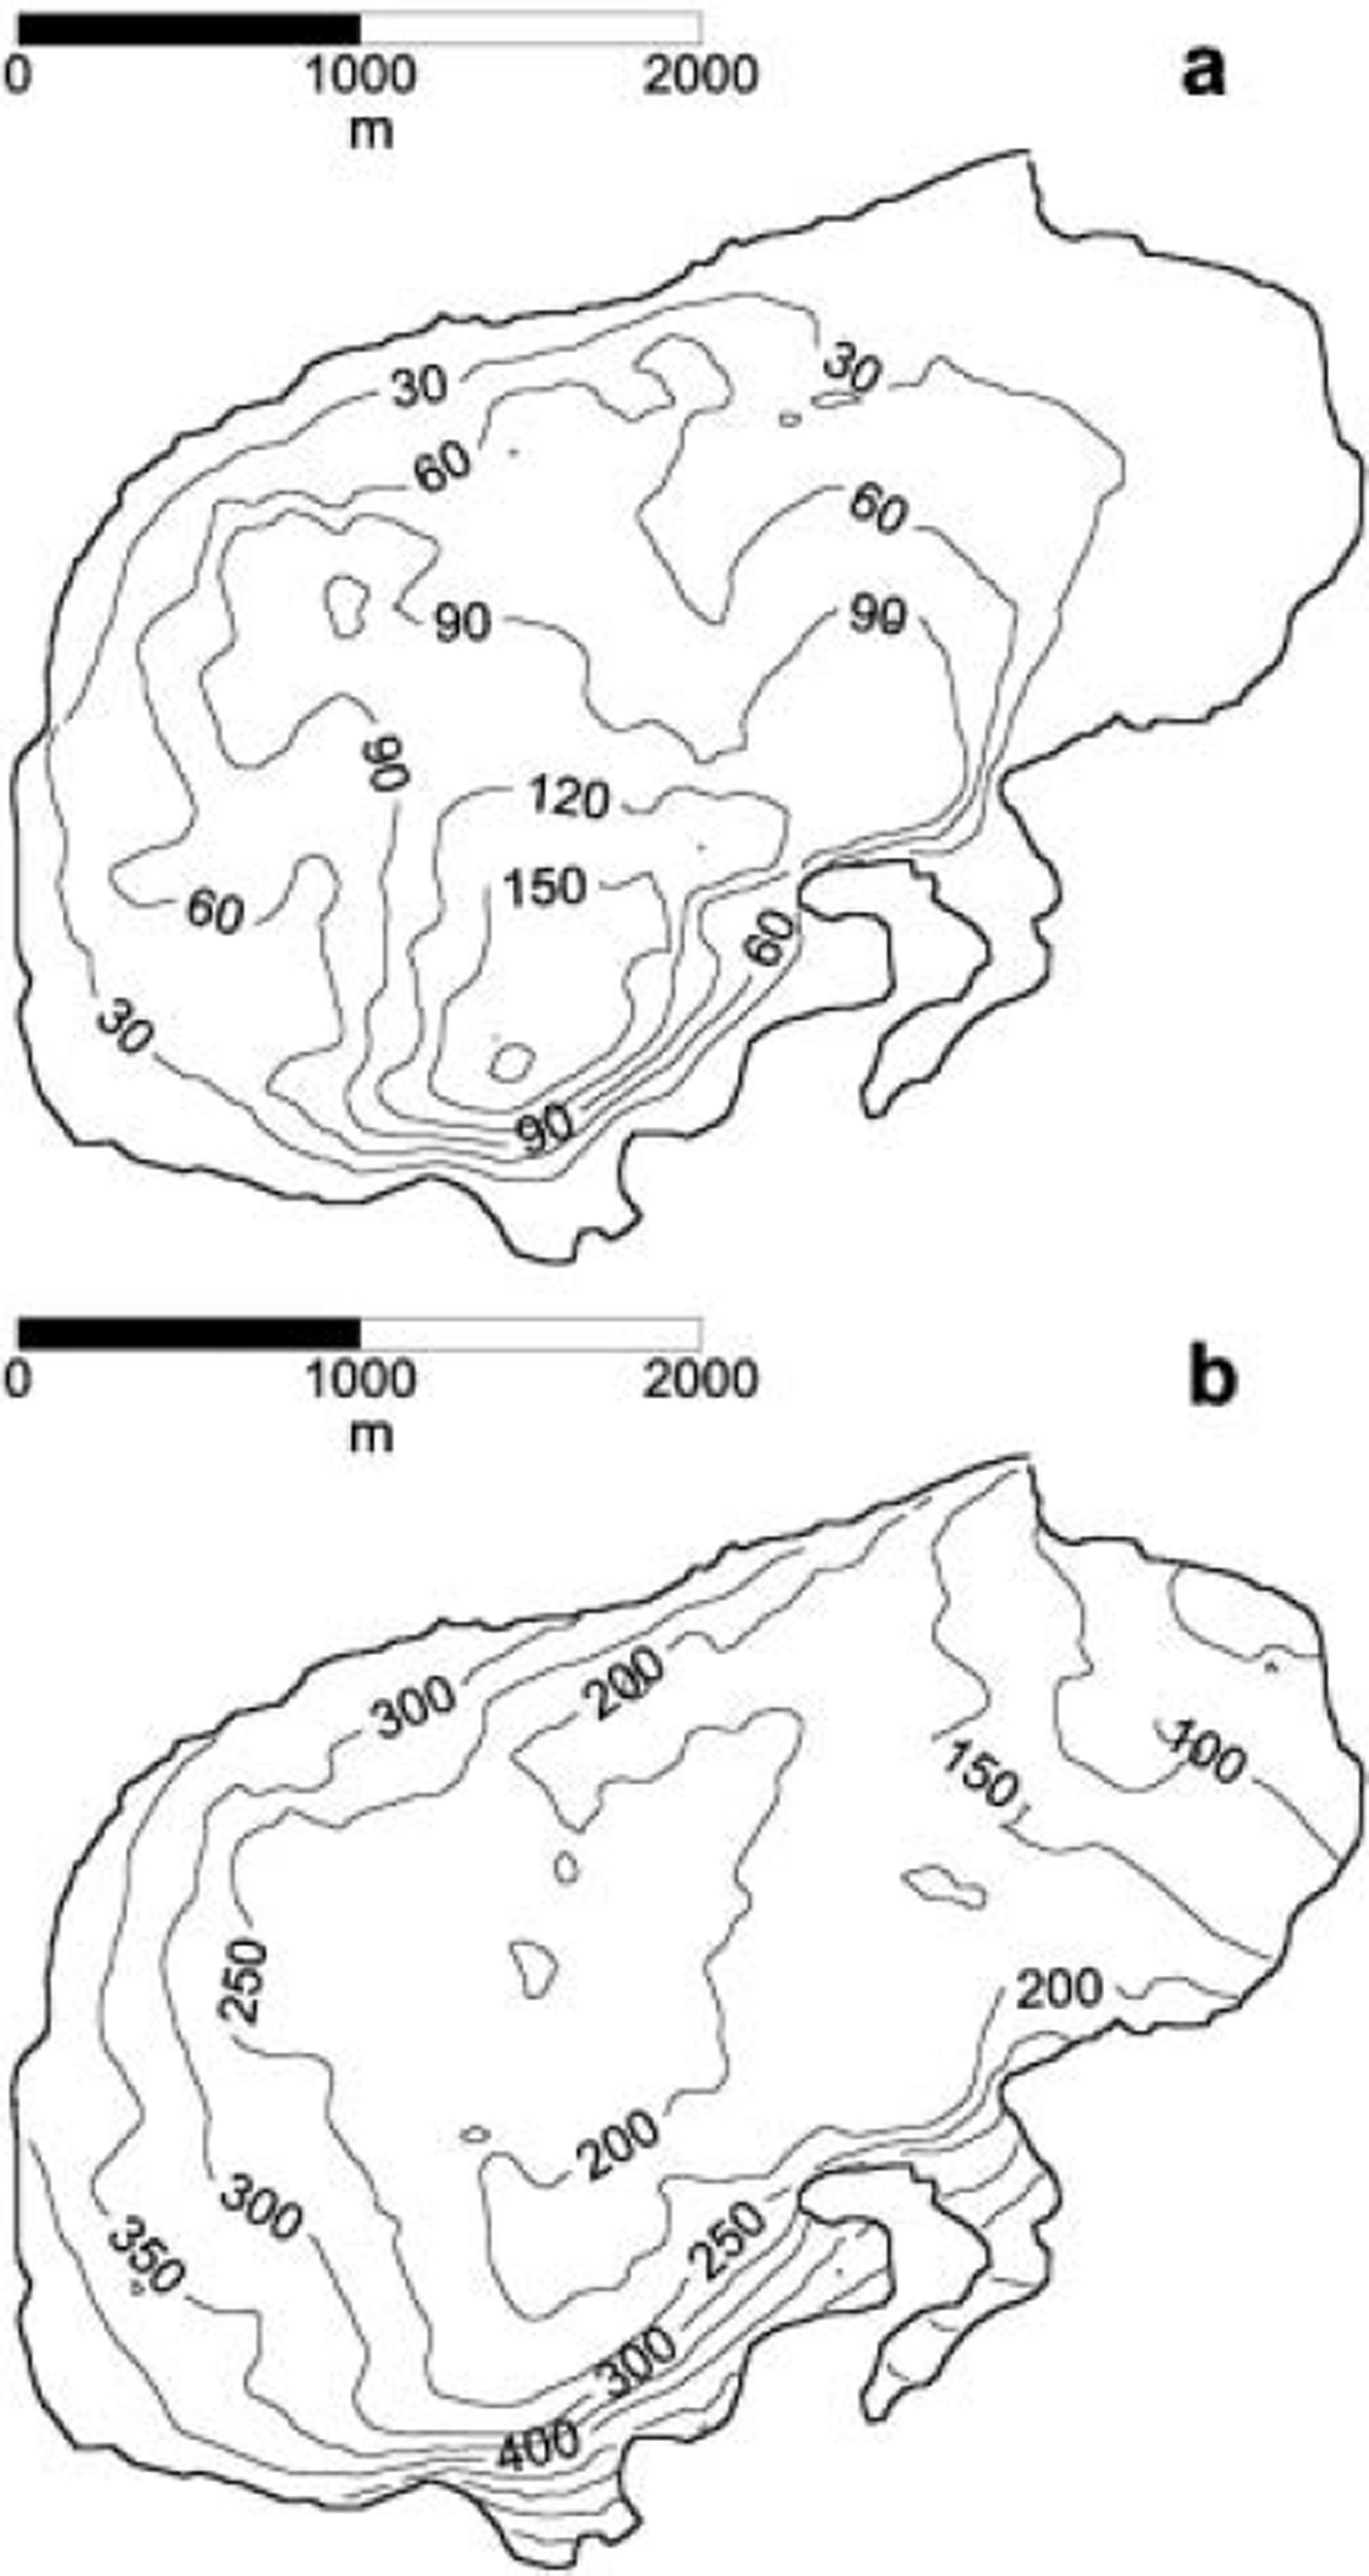
The map of ice thickness in 1999, constructed from radar data, is shown in Figure 3a. The average ice thickness is 73 m. Maximum values are found in the southern part of the glacier, where a maximum thickness of 216 m is reached. Figure 3b shows the bedrock topography map constructed by subtracting the ice thickness from the DEM for the glacier surface in 1990 (shown in Fig. 1). The 1999 surface elevation data collected during the radar survey were useless for this purpose because of their poor resolution (GPS working in autonomous mode). We observe that the entire glacier bed is well above sea level.
(a) Ice-thickness map retrieved from the radar measurements in 1999. (b) Bedrock topography map.
Length, area, average thickness and volume changes (1936–90)
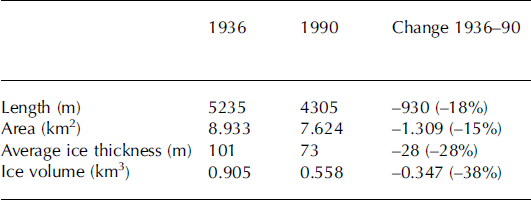
The length along the central line, the area, the average ice thickness and the ice volume of Aldegondabreen in 1936 and 1990, together with their changes in the period 1936– 90, are shown in Table 1. Remarkable changes are observed for all of these quantities. The change in ice volume of –0.347 km3 is equivalent to an average annual balance of –0.7 m w.e. during the period 1936–90.
Length along the central line, area, average ice thickness and ice volume of Aldegondabreen in 1936 and 1990, and their changes during 1936–90
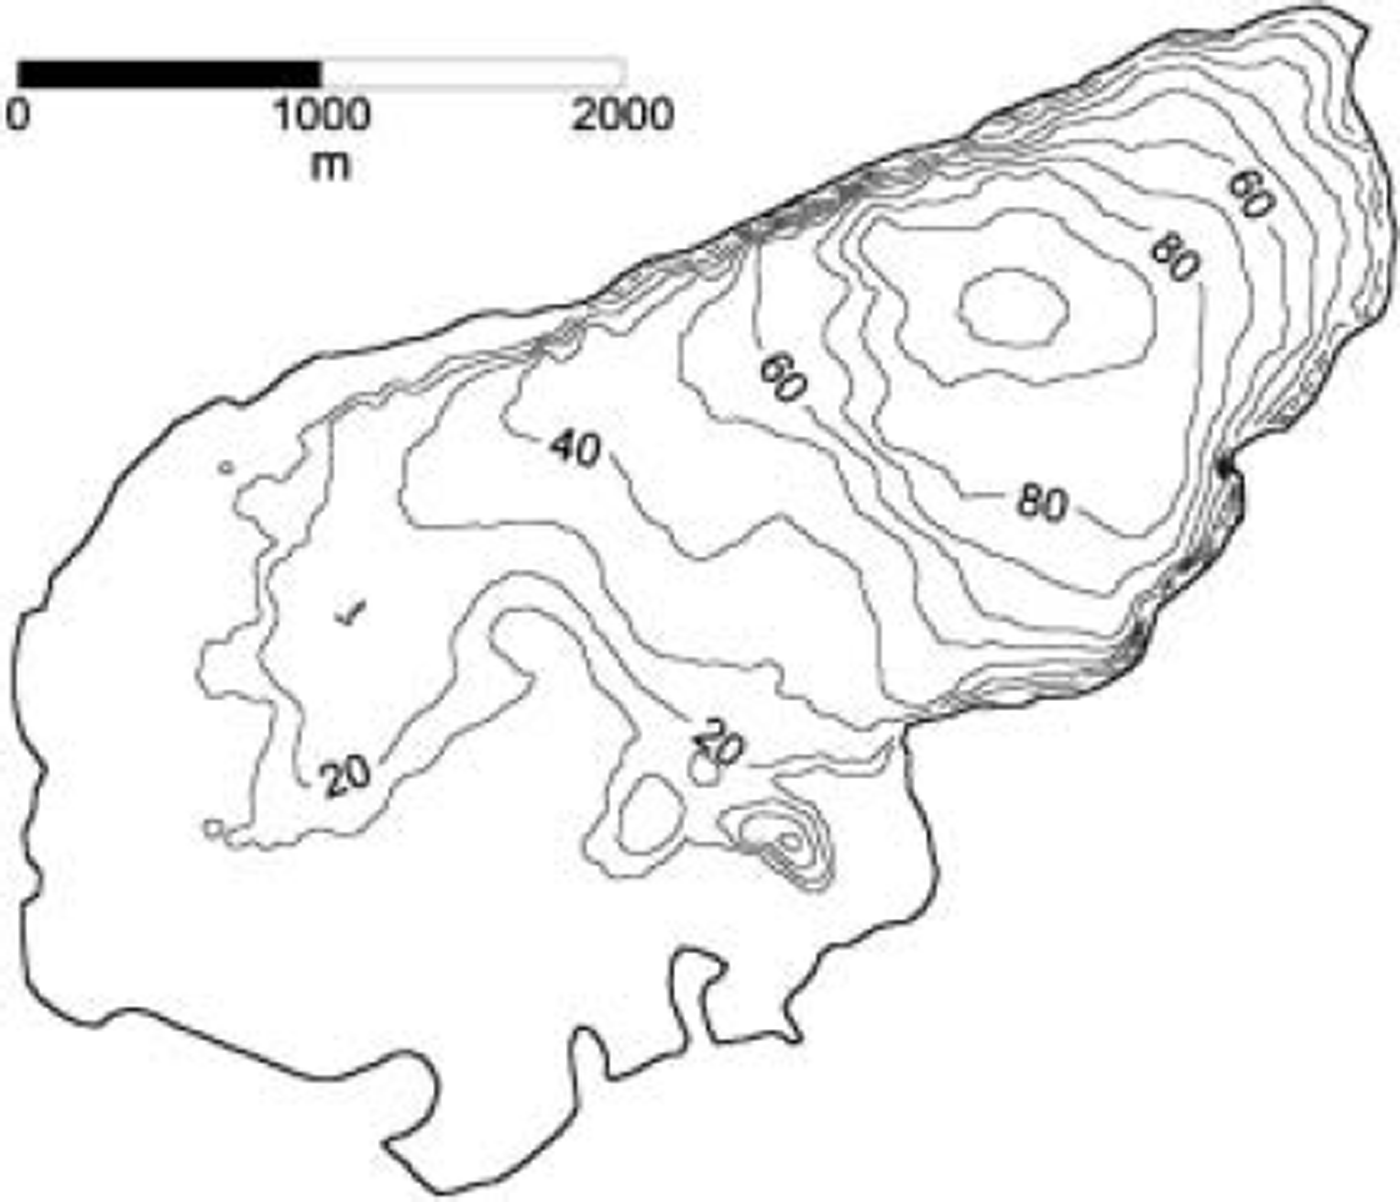
The map of ice-thickness changes during 1936–90 is shown in Figure 4. Changes as large as 100m are observed in the region next to the present glacier terminus. The large change in glacierized area during this period is also apparent in Figure 1, where the ice margins for both 1936 and 1990 are shown.
Contour map of the ice-thickness change, 1936–90. The glacier margin shown is that of 1936.
Discussion
The discrepancies in the estimates of RWV from the CMP experiment and the hyperbolic diffractions indicate the need for more detailed measurements, either by the CMP method or by the technique of parallel and close profiles described by Reference MacheretMacheret (2000), as the classical diffraction hyperbola measurements are prone to large uncertainties. More precise systems for positioning the radar data are also required, as this factor strongly influences the results obtained. For example, an effective migration procedure requires more precise positioning and more precise data on RWV. Model calculations for a point reflector show that even small (∼1-2%) errors in the determination of the distance along the radar profile lead to large (1-2m μs–1) errors in the estimation of RWV from diffraction hyperbolae. More detailed studies of the RWV distribution by depth, either from hyperbolae located at different depths (e.g. Reference MooreMoore and others, 1999; Reference Benjumea, Macheret, Navarro and TeixidóBenjumea and others, 2003) or by the semblance method (Reference Neidell and TanerNeidell and Taner, 1971), would allow estimates to be made of the water-content distribution, which is an important control on the rheology of temperate ice, as the stiffness parameter A in the constitutive relation strongly depends on the water content of temperate ice (Reference Lliboutry and DuvalLliboutry and Duval, 1985).
The radar data (15 MHz) recorded from the glacier surface in 1999 confirm the two-layered polythermal structure of Aldegondabreen postulated by radar data (440 MHz) taken from a helicopter in 1974. The cold-ice layer extends down to 90m in the southern part of the glacier. The maximum ice thickness of 216m is also found in this area. The entire glacier bed is above sea level, and the subglacial topography does not reveal striking features but, instead, a rather smooth progression along all of the central part of the glacier, and strong slopes near the glacier walls.
In the southern part of the glacier, a repeated pattern of hyperbolic diffractions detected in all of the transverse profiles recorded in this area, at depths of 50–80m and dipping in the direction of the glacier tongue, has been interpreted as an englacial water channel which originates in the temperate ice (see Fig. 1). This is consistent with the presence of a stream or set of streams that flow under the lateral–terminal moraine next to the southern wall.
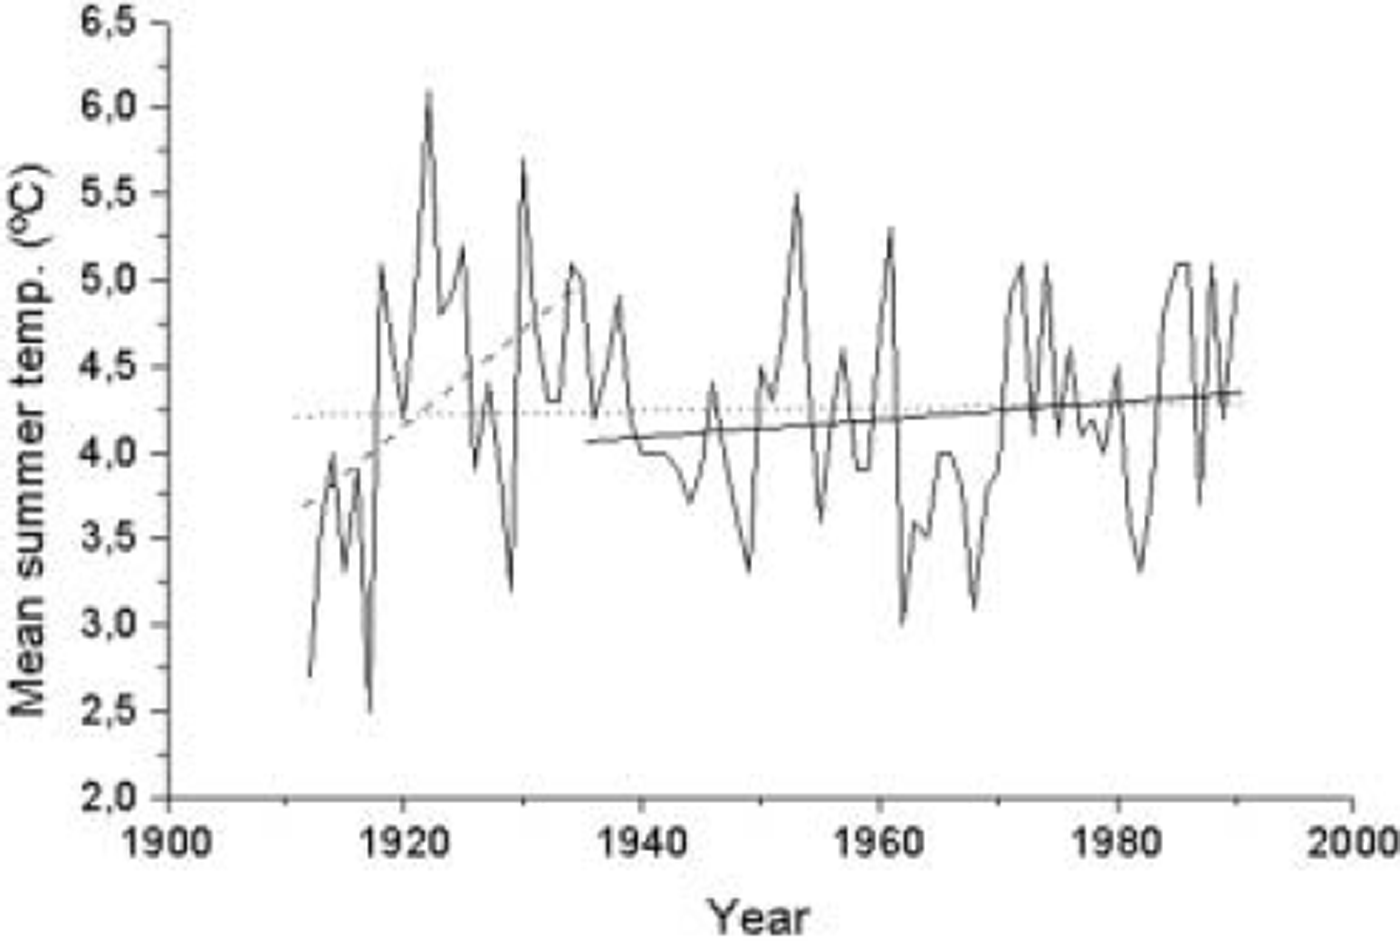
The results regarding changes in length along the central line, area, average ice thickness and ice volume of Aldegondabreen during the period 1936–90 (see Table 1; Fig. 4) show that the glacier has experienced dramatic retreat during this period, consistent with the 0.27˚C increase in mean summer air temperature recorded at the weather station in Longyearbyen (e.g. Reference Hanssen-Bauer and FørlandHanssen-Bauer and Førland, 1998; Reference Hanssen-BauerHanssen-Bauer, 2002) during the period analyzed. It is also consistent with the warming in Spitsbergen following the end of the LIA, and the general glacier recession trend observed in this region (e.g. Reference Dowdeswell, Hagen, Bamber and PayneDowdeswell and Hagen, 2004). Figure 5 shows the mean summer air temperature recorded at Isfjord Radio/Longyearbyen during the period 1912–90, with the linear fits for the full period and the sub-periods 1912–35 and 1936–90 also plotted. Notice the dramatic temperature rise during the period 1912–35, mostly concentrated within 1917–22 (which represents the end of the LIA in Spitsbergen). Taking into account that the response time of Aldegondabreen, as defined by Reference Jóhannesson, Raymond, Waddington and OerlemansJóhannesson and others (1989a, b), is of the order of 50 years, the significant retreat of Aldegondabreen during 1936–90 would represent the adjustment of the glacier to the temperature rise and mass-balance changes associated with the end of the LIA.
Mean summer temperatures recorded at Isfjord Radio/ Longyearbyen (78˚47’ N, 13˚38’ E), 1912–90. The linear fits to the data for the full period (dotted line), the period 1936–90 considered in our volume-change estimates (solid line) and the period 1912–35 (dashed line) are plotted.
Moreover, the quantitative estimate of –0.7 mw.e. as the average ice-thickness change during 1936–90 is comparable to the only available data on net mass balance for Aldegondabreen (–1.1, –1.35 and –1.71m w.e. in the balance years 1976/77, 2002/03 and 2003/04, respectively) and consistent with the net mass balance for many other glaciers in Spitsbergen during the second half of the 20th century (Reference Dyurgerov, Meier and ArmstrongDyurgerov and others, 2002). The use of the 1990 surface and the 1999 ice thickness to estimate the glacier topography cannot be claimed as an error source in our estimates of volume changes. It certainly implies an error (offset) in the estimates of ice thickness and ice volume for 1936 and 1990 from the bedrock topography and the corresponding surface maps. However, this error does not affect the estimates of the changes, during 1936–90, of the average thickness and ice volume, as the subtraction involved in the computation removes the common offset present in the separate 1936 and 1990 estimates.
Conclusions
The following main conclusions can be drawn from our analysis:
1. The radar data collected in 1999 confirm the two-layered polythermal structure of Aldegondabreen, with a cold ice layer extending down to 90 m depth in the deepest part of the glacier, where maximum ice thickness reaches 216 m.
2. A combination of the tracking of diffraction hyperbolae present in the radar profiles and observation of hydrological evidences can be used to infer the presence of englacial water channels.
3. Aldegondabreen has experienced a dramatic retreat since 1936, with an estimated loss in ice volume of 0.347 km3 during the period 1936–90, which represents a 38% drop and is equivalent to an average annual balance of –0.7 mw.e. during this period.
Acknowledgements
This research has been supported by grant REN2002-03199/ ANT from the Spanish Ministry of Science and Technology, and grants 99-05-65551, 99-05-39094 and 04-05-64773 from the Russian Fund of Basic Research.



