Abbreviations
- ABA
abscisic acid
- ANOVA
analysis of variance
- CK
cytokinin
- DZ
dihydrozeatin
- DZOG
dihydrozeatin-O-glucoside
- DZR
dihydrozeatin riboside
- DZRMP
dihydrozeatin riboside-5′-monophosphate
- DZNT
dihydrozeatin nucleotide
- DZROG
dihydrozeatin riboside-O-glucoside
- dwt
dry weight
- FB
free base
- fwt
fresh weight
- GC-FID
gas chromatography with flame ionization detector
- HPLC-(ESI)-MS/MS
high-performance liquid chromatography-electrospray ionization tandem mass spectrometry
- iP
isopentenyladenine
- iP7G
isopentenyladenine-7-glucoside
- iPR
isopentenyladenosine
- iPRMP
isopentenyladenosine-5′-monophosphate
- iPNT
isopentenyl nucleotide
- MRM
multiple reaction monitoring
- 2MeSiP
2-methylthio-isopentenyladenine
- 2MeSiPR
2-methylthio-isopentenyladenosine
- 2MeSZ
2-methylthio-zeatin
- 2MeSZR
2-methylthio-zeatin riboside
- NT
nucleotide
- PCA
principal component analysis
- RB
riboside
- cZ
cisZeatin
- cZR
cisZeatin riboside
- cZNT
cisZeatin nucleotide
- cZROG
cisZeatin riboside-O-glucoside
- tZ
transZeatin
- tZR
transZeatin riboside
- tZ9G
transZeatin-9-glucoside
- tZNT
transZeatin nucleotide
- tZOG
transZeatin-O-glucoside
- tZROG
transZeatin riboside-O-glucoside
Introduction
Oil production and accumulation is an essential aspect of seed development in soybean (Glycine max) and the other oil-grain crops (Fehr et al., Reference Fehr, Caviness, Burmood and Pennington1971; Ohlrogge et al., Reference Ohlrogge, Thrower, Mhaske, Stymne, Baxter, Yang, Liu, Shaw, Shorrosh, Zhang, Wilkerson and Matthäus2018). Generally, seed development is highly regulated and follows an ordered progression through embryogenesis, seed maturation, desiccation, and germination (Emery et al., Reference Emery, Atkins, Basra and Basra2006; Finkelstein, Reference Finkelstein and Davies2010). Following the first phase, the storage reserve accumulation during seed maturation is the next critical period in soybean seed development. It has been demonstrated that soybean seed value is determined in this period, as the lipid bodies and proteins are synthesized and stored throughout the development stage of R5 (beginning seed) until the end of full seed (R6) (Rubel et al., Reference Rubel, Rinne and Canvin1972; Dornbos and McDonald, Reference Dornbos and McDonald1986). At the full maturity stage (R8), the dry weight of the harvested soybean seeds typically consists of the following fractions: oil (20%), protein (40%), carbohydrates (30%), crude fibre (5%) and ash (5%) (Fehr and Caviness, Reference Fehr and Caviness1977). Soybean oil is predominantly composed of triacylglycerols (TAGs; 96–98%) with the abundance of the five common fatty acids (FAs), categorized into saturated FA – approximately 13% palmitic (C16:0), 4% stearic (C18:0), monounsaturated FA – 20% oleic (C18:1), and polyunsaturated FAs – 55% linoleic (C18:2) and 8% linolenic (C18:3) acid, at 13% moisture (Reske et al., Reference Reske, Siebrecht and Hazebroek1997; Pham et al., Reference Pham, Lee, Shannon and Bilyeu2010, Reference Pham, Lee, Shannon and Bilyeu2011; Jokić et al., Reference Jokić, Sudar, Svilović, Vidović, Bilić, Velić and Jurković2013).
The optimal composition of soybean oil depends on the purpose of seed processing because industrial use often requires different compositions of FA than that of the food-grade soybean seeds. While C16:0, a saturated FA, is not considered healthy, another saturated FA, C18:0, presents only negligible harm for consumers, and it can enhance TAG melting behaviour (Nguyen et al., Reference Nguyen, Kisiala, Andreas, Emery and Narine2016). On the other hand, C18:3, Omega-3 alpha-linolenic acid (ALA), essential for the human body, is unstable because of its susceptibility to auto-oxidation and production of undesirable flavours and odours. Therefore, when soybean oil is used to manufacture margarines and other food products, it often needs to be hydrogenated. The addition of hydrogen to the FA chains produces trans-FAs, which presence in human diet increases the risk of developing cardiovascular disease. The hydrogenation has also a negative impact on the cold flow properties of biodiesel (Graef et al., Reference Graef, LaVallee, Tenopir, Tat, Schweiger, Kinney, Van Gerpen and Clemente2009). However, an excellent compromise can be reached by developing a soybean oil high in the monounsaturated FA, such as C18:1, and low in both saturated and polyunsaturated FAs, thereby simultaneously improving oxidative stability, while augmenting biodiesel cold flow (Graef et al., Reference Graef, LaVallee, Tenopir, Tat, Schweiger, Kinney, Van Gerpen and Clemente2009; Refaat, Reference Refaat2009). The alteration of FA profiles in soybean to improve oil quality has been demonstrated as an essential and evolving theme to meet both the nutritional needs and industrial criteria of the market (Narine et al., Reference Narine, Yue and Kong2007; Pham et al., Reference Pham, Lee, Shannon and Bilyeu2010). Thus, the oil profile modification approach has led to significant interest in the metabolic regulatory activities during seed maturation.
Cytokinins (CKs), along with other phytohormones, are fundamental regulatory factors of seed development (Finkelstein, Reference Finkelstein and Davies2010; Kambhampati et al., Reference Kambhampati, Kurepin, Kisiala, Bruce, Cober, Morrison and Emery2017). CKs can be present in numerous forms that differ in their structure and activity, and their homeostasis is regulated through biosynthesis and degradation. The structural modifications induce reversible or irreversible losses of CK activity and regulate the function and compartmentalization of the respective CK metabolites (Sakakibara, Reference Sakakibara2006; Frébort et al., Reference Frébort, Kowalska, Hluska, Frébortová and Galuszka2011; Spíchal, Reference Spíchal2012; Jameson and Song, Reference Jameson and Song2016). Previous research has found that iP and tZ are the most active forms as they most efficiently bind to the plant CK receptors. These CK forms also act as long-distance messengers that regulate plant metabolism (Schaller et al., Reference Schaller, Bishopp and Kieber2015). Interestingly, the natural-occurring CK, transZeatin riboside (tZR), was detected within lupine seeds, and the highest levels of CKs documented to date have been found in seeds (Emery et al., Reference Emery, Ma and Atkins2000, Reference Emery, Atkins, Basra and Basra2006).
Almost a half-century ago, first research claimed a possible link between CK regulation and FA/oil synthesis in plant tissues (Kull and Büxenstein, Reference Kull and Büxenstein1974; Stearns and Morton, Reference Stearns and Morton1975; Kull et al., Reference Kull, Kühn, Schweizer and Weiser1978). More recently, it has been revealed that the overexpression of the CK biosynthesis enzyme IPT (isopentenyltransferase) leads to the increased oleic acid (C18:1) and oil content, as well as the higher seed yield, resulting in improved seed quality in canola (Brassica napus) (Kant et al., Reference Kant, Burch, Badenhorst, Palanisamy, Mason and Spangenberg2015). Notably, the incentives for delayed leaf senescence (Kant et al., Reference Kant, Burch, Badenhorst, Palanisamy, Mason and Spangenberg2015), enhanced seed filling (Bartrina et al., Reference Bartrina, Otto, Strnad, Werner and Schmülling2011) and increased crop productivity (Ashikari et al., Reference Ashikari, Sakakibara, Lin, Yamamoto, Takashi, Nishimura, Angeles, Qian, Kitano and Matsuoka2005; Bartrina et al., Reference Bartrina, Otto, Strnad, Werner and Schmülling2011; Kant et al., Reference Kant, Burch, Badenhorst, Palanisamy, Mason and Spangenberg2015) were the impetus for CK manipulation through the alteration of the IPT gene. Interestingly, a similar approach resulted in the modification of the FA profiles in tobacco plants (Dunne and Maple-Grødem, Reference Dunne and Maple-Grødem2014), which raised the interest, once again, in the role of CKs in FA/oil synthesis. To date, only a limited amount of data exists on the quantitative analysis of CK metabolites and FA composition during seed filling or maturation. In an investigation on the possible relationship between endogenous hormones and seed filling in soybean, the lack of correlations between the concentrations of seed indole-3-acetic acid (IAA), CKs and seed-filling rate was reported (Liu et al., Reference Liu, Liu, Wang, Jin and Herbert2010; Dunne and Maple-Grødem, Reference Dunne and Maple-Grødem2014; Kant et al., Reference Kant, Burch, Badenhorst, Palanisamy, Mason and Spangenberg2015). However, the analysed types/fractions of CKs were not specified, and no data on FA composition was reported in that study.
Abscisic acid (ABA) is another phytohormone that plays a crucial role in seed development. It was reported that a high level of ABA in seeds can prevent seed abortion and promote embryo growth during early embryogenesis (Nambara and Marion-Poll, Reference Nambara and Marion-Poll2003, Reference Nambara and Marion-Poll2005). It is well established that ABA is a CK antagonist in triggering leaf senescence; the increase of ABA signalling is often followed by the reduction of CK level in plants under biotic and abiotic stress conditions (Frébort et al., Reference Frébort, Kowalska, Hluska, Frébortová and Galuszka2011; Wani et al., Reference Wani, Kumar, Shriram and Sah2016; Vishwakarma et al., Reference Vishwakarma, Upadhyay, Kumar, Yadav, Singh, Mishra, Kumar, Verma, Upadhyay, Pandey and Sharma2017). It has also been observed that ABA antagonizes gibberellin (GA) signalling, stimulates seed dormancy and inhibits germination in matured seed (Wilkinson and Davies, Reference Wilkinson and Davies2010; Wani et al., Reference Wani, Kumar, Shriram and Sah2016). Interestingly, results from exogenous applications demonstrate that ABA could enhance FA biosynthesis in carrot (Ross and Murphy, Reference Ross and Murphy1993), rapeseed (Finkelstein and Somerville, Reference Finkelstein and Somerville1989), white spruce (Attree et al., Reference Attree, Pomeroy and Fowke1992), olives (Moustakime et al., Reference Moustakime, Hazzoumi and Amrani Joutei2017) and microalgae Chlamydomonas reinhardtii (Park et al., Reference Park, Yoo, Moon, Kim, Choi and Yang2013). Most studies on the potential involvement of ABA and CKs in FA biosynthesis have been conducted in vitro, while there are few empirical investigations involving a whole, intact plant (Liu et al., Reference Liu, Liu, Wang, Jin and Herbert2010; Dunne and Maple-Grødem, Reference Dunne and Maple-Grødem2014; Kant et al., Reference Kant, Burch, Badenhorst, Palanisamy, Mason and Spangenberg2015).
This study investigated how plant hormone levels correlate with FA composition and tested how FA composition and oil content could be altered by the modification of endogenous CK/ABA profiles in soybean plants cultivated in the greenhouse conditions. We hypothesized that the increase of the endogenous CK levels at the early stage of seed maturation could potentially promote FA and oil production. The second hypothesis was that the change in endogenous ABA levels at the early stage of seed maturation could alter the FA composition and dynamics of accumulation. To test these hypothesizes, we compared profiles of plant hormone profiles with those of FA production during seed maturation in six soybean accessions. Positive correlations were found between the endogenous hormone profiles at R5 and R6 stages (the period when lipid bodies are produced and stored) and the ultimate FA/oil level at the harvest stage (R8). Furthermore, two soybean accessions, characterized by distinctively different FA profiles, were treated with exogenous hormones, and the stimulatory effects on FA production were observed. This research provides new insights into the regulatory role of CK metabolites and ABA as well as their crosstalk in FA biosynthesis during soybean seed maturation. The results of our study can be used as new, supporting tools for the development of soybeans characterized by more desirable FA/oil profiles.
Materials and methods
Plant material and growth conditions
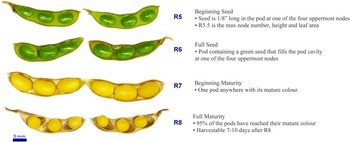
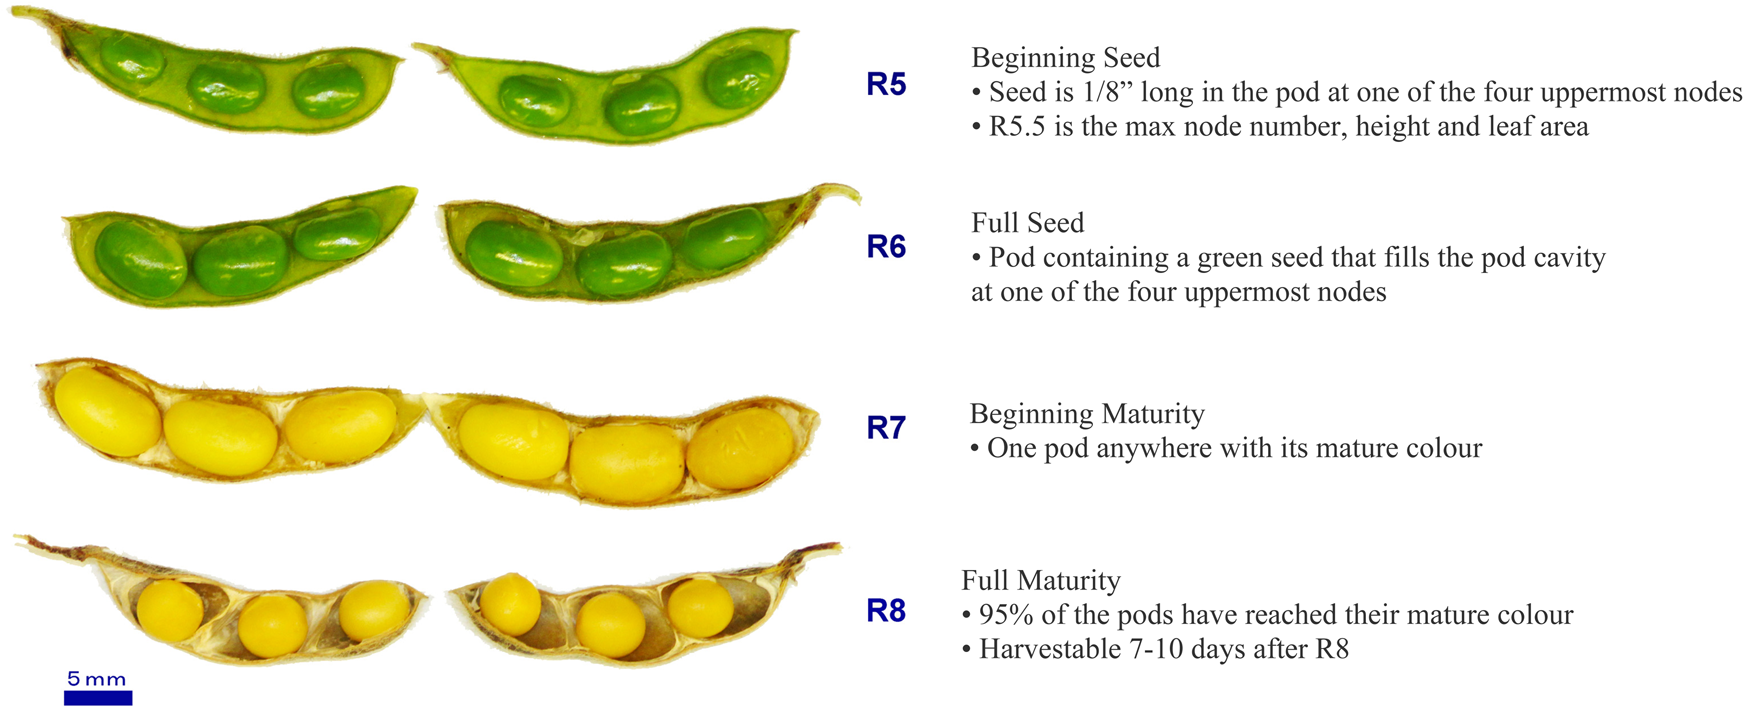
Six soybean accessions known for their disparate fatty acid profiles: PI603479, PI593949A, PI549055, PI549057B, PI538410B and PI561333 were obtained from the United States Department of Agriculture (USDA), coded as T1, T2, T5, T6, T7 and T12, respectively, and used in all the experiments. In order to avoid the variation in seed-filling days among testing soybean plants, these six accessions belong to the same maturity group, MG I, which identifies that they have similar seed-filling periods. The plants were cultivated in the Trent University Aurora greenhouse (Conviron, Winnipeg, MB, Canada) under fluorescent lights providing approximately 60 mol m−2 a day, 70–85% relative humidity, photoperiod of 16 h at 27°C (day) and 8 h at 22°C (night). Seeds of six soybean accessions were collected at four developmental stages (Fig. 1), including (1) R5, 65–70 d after planting (DAP), (2) R6, 75–85 DAP, (3) R7, 105–110 DAP and (4) R8, 115–125 DAP, and freeze-dried. Hormone profiles and FA composition of soybean seeds were analyzed in three replicates at each of the four stages to reveal possible associations between these parameters in the control plants.
Soybean seeds during seed maturation from the last four reproductive (R) stages. R5: beginning seed; R6: full seed; R7: beginning maturity; R8: full maturity.
Hormone profiling
Extraction and purification of CKs and ABA from soybean seeds
A modified protocol (Farrow and Emery, Reference Farrow and Emery2012) was used for the phytohormone extraction. The ABA and CK profiles were analyzed, including CK free bases (FB), their riboside (RB) and nucleotide derivatives (NT), as well as glucoside (GLUC) and methyl-thiol (MET) conjugates.
Fine powder of freeze-dried seed samples (approximately 0.1 g for each sample) was homogenized using a ball mill (Retsch MM300, Qiagen, Valencia, CA, USA) at 4°C over ice-cold (−20°C) modified Bieleski #2 extraction solvent (CH3OH:H2O:HCOOH [15:4:1, v/v/v]) with zirconium oxide grinding beads (Comeau Technique Ltd., Vaudreuil-Dorion, Canada). Following homogenization, 146.9 ng of deuterated abscisic acid (d4-ABA; NRC-PBI, Saskatoon, SK, Canada) and 10 ng of each of deuterated internal standard CKs: ([2H7]BA, [2H7]BAR, [2H5]ZOG, [2H7]DHZOG, [2H5]ZROG, [2H7]DHZROG, [2H5]Z7G, [2H5]Z9G, [2H6]iP7G [2H5]2MeSZ, [2H6]2MeSiP, [2H5]2MeSZR, [2H6]2MeSiPR, [2H6]iPR, [2H5]ZR, [2H3]DHZR, [2H6]iP, [2H3]DHZ, [2H6]iPRMP, [2H3]DHZRMP) (OlChemIm Ltd., Olomouc, Czech Republic) were added to each sample. As deuterated standards of cis-type isomers: cZ, cZR, cZNT and cZROG were not commercially available at the time of the study, the levels of these compounds were quantified based on the recovery of the deuterated standards of the corresponding trans-isomers. Homogenized samples were allowed to extract passively overnight at −20°C. Pellets were removed by centrifugation (10 min at 2800×g), the obtained extracts were collected, and samples were re-extracted with 1 ml of ice-cold Bieleski #2 solvent for 30 min at −20°C. The solids were separated by centrifugation and discarded, and the pooled extracts were evaporated to dryness at 35°C under vacuum (Model SPD111V; Thermo Scientific, Ottawa, ON, Canada). The extraction residues were reconstituted in 200 μl of 1 M HCOOH (pH 1.4). The hormone-containing fractions were purified and concentrated on a mixed-mode, reverse-phase, cation exchange SPE cartridge (Oasis MCX 96-well plate, 60 mg sorbent per well, 60 μm particle size; Waters, Mississauga, ON, Canada) using a Gilson liquid handler (215 SPE System, Gilson, Middleton, WI, USA). Cartridges were activated with high-performance liquid chromatography (HPLC) grade CH3OH and equilibrated using 1 M HCOOH (pH 1.4). After cartridge equilibration, each sample was loaded and washed with 1 M HCOOH (pH 1.4). ABA was eluted first using 1 M CH3OH. CK fractions were eluted based on their chemical properties. CK-NTs were eluted with 0.35 M NH4OH. CK-FBs, CK-RBs, CK-METs and CK-GLUCs were retained based on charge and hydrophobic properties and, thus, were eluted last, using 0.35 M NH4OH in 60% [v/v] CH3OH. Each fraction was evaporated to dryness at 35°C under vacuum. Because CK-NTs cannot be analyzed directly with our methods, they were dephosphorylated by overnight incubation with 3 units of alkaline phosphatase (CIP; New England BioLabs Ltd., Pickering, ON, Canada) in 1 ml of 0.1 M ethanolamine-HCl (pH 10.4) at 37°C. The resulting CK-RBs were dried at 35°C under vacuum. The samples were reconstituted in double-distilled water (dd-H2O) and were further isolated on a reversed-phase C18 solid phase extraction plate (SPE, InnoSep™, C18/18%, 50 mg/1 ml, 96-well plate, Canadian Life Science, Peterborough, ON, Canada), which was first activated with CH3OH and equilibrated using dd-H2O. The resulting CK-RB samples (representing pooled levels of mono-, di- and triphosphates) were loaded onto the C18 plate and washed with dd-H2O. CK-RBs were eluted using 100% CH3OH, and eluents were evaporated at 35°C under vacuum.
Before the analysis, all samples were dissolved in starting conditions solution (CH3OH:CH3COOH:H2O [5:0.08:94.92, vol/vol/vol] for ABA and CH3CN:CH3COOH:H2O [5:0.08:94.92, vol/vol/vol] for CKs). Samples were centrifuged at 2300×g for 10 min to remove debris. The supernatants were stored at −20°C until further processing.
Hormone analysis by high-performance liquid chromatography-electrospray ionization tandem mass spectrometry (HPLC-ESI-MS/MS)
Quantities of hormones in the extracted samples were measured by a Shimadzu LC (Kyoto, Japan) with Autosampler connected to a Sciex Applied Biosystem 5500 Qtrap mass spectrometer, AB Sciex, Concord, Ontario, Canada). Sample aliquot (25 μl) was injected on a Luna C18 reversed-phase column (3 μm, 150 × 2.0 mm; Phenomenex, Torrance, Canada). ABA was eluted using component A: H2O with 0.08% CH3CO2H and component B: CH3OH, both with 0.08% CH3CO2H, at a flow rate of 0.2 ml min−1. CKs were eluted using component A: H2O with 0.08% CH3CO2H and component B: C2H3N, both with 0.08% CH3CO2H, at a flow rate of 0.2 ml min−1.
For the ABA, the initial conditions were 50% B, changing linearly to 80% B over 8 min. This ratio was held constant for 2 min before returning to starting conditions and re-equilibrating for 8 min. The CK fractions were eluted with an increasing gradient of A mixed with B. The initial conditions were 5% A and 95% B, changing linearly in 17 min to 95% A and 5% B. Conditions remained constant for 5 min, and then, immediately returned to initial conditions for 18 min. The effluent was introduced into the electrospray source using conditions specific for each metabolite, where quantification was obtained by multiple reaction monitoring (MRM) of the intact molecule [M + H]+ (CKs) or [M + H]− (ABA) and the specific product ions as described previously (Farrow and Emery, Reference Farrow and Emery2012).
The HPLC-ESI-MS/MS data were processed with the Analyst (v. 1.6) quantification software (AB Sciex, Concord, Ontario, Canada) to determine peak area according to isotope dilution analysis (Farrow and Emery, Reference Farrow and Emery2012). Concentrations of CK types (FB, RB, NT, MET and GLUC) and ABA in all samples derived from six soybean accessions were expressed in picomoles per g dry weight of seed (pmol g dwt−1).
Fatty acid quantification
Crude oil extraction
The soybean oil was obtained after grinding the soybean seeds in a coffee grinder (Hamilton Beach, Picton, ON, Canada) and extracting it with hexane for 12 h in a Soxhlet extractor. The solvent was removed using the rotatory evaporator under reduced pressure at 40°C, and the crude oil was stored at 4°C until the next steps.
Fatty acid methylation and ester preparation
The analysis of fatty acids (FAs) was performed according to a modified procedure described previously (Janeczko et al., Reference Janeczko, Hura, Skoczowski, Idzik, Biesaga-Kościelniak and Niemczyk2008). Briefly, 200 mg of crude oil was dissolved in 2 ml of 0.5 M KOH in CH3OH and heated for 20 min at 120°C. After cooling down, 100 μL of internal standard (n-heptadecanoic acid, C17:0, in CH3OH, 10 mg ml−1) and 1 ml of 12% BCl3 in CH3OH (Sigma-Aldrich, Oakville, ON, Canada) were added, and the mixture was heated at 120°C for 10 min. Next, it was cooled to room temperature, and 1 ml of a saturated solution of NaCl and 1 ml of hexane (C6H14) were added to separate the ester phase. After phase separation by low-speed centrifugation (3000 rpm), the upper C6H14 phase containing methyl esters of fatty acids (FAMEs) was collected. The lower phase was washed twice with the same volume of hexane to improve the extraction yield.
Flame ionization detector-gas chromatography (GC-FID) analysis of FAMEs
Methyl esters of FAs were dissolved in C6H14 and separated by gas chromatography (GC) with flame ionization detector (FID) (Hewlett-Packard 5890, Series II, equipped with Dionex Advanced Computer Interface). The analytical separation was achieved on a free FA phase (FFAP) fused silica capillary column (ZB-FFAP 60 m_0.25 mm i.d., film thickness 0.25 μm, Phenomenex, USA) with helium as a carrier gas. The volume injected was 1 μl, and the split ratio of the carrier gas was 1:80. The temperature of the injector and FID was set at 230°C. The oven temperature was held at 160°C for 5 min and then increased to 210°C at a 2°C min−1 rate, while the final temperature was held for 30 min (Janeczko et al., Reference Janeczko, Hura, Skoczowski, Idzik, Biesaga-Kościelniak and Niemczyk2008). GC peak areas were integrated with a Dionex Advanced Computer Interface (Dionex, Sunnyvale, CA, USA), and data were analyzed by Dionex PeakNet 5.21 Chromatography Workstation.
Quantitation of FAMEs
N-heptadecanoic acid (C17:0) (Sigma-Aldrich, Oakville, ON, Canada) was used as an internal standard to determine percentage recovery in the form of heptadecanoic acid methyl ester (ME) and five major FAMEs (C16:0, C18:0, C18:1, C18:2 and C18:3) were quantitated. Sample FAME levels were determined by the peak area ratio using the standard curves. The standard curves were generated by comparing integrator-areas of serially diluted standards of each standard FAME. Six standard FAMEs, including C16:0, C17:0, C18:0, C18:1, C18:2 and C18:3, were purchased from Sigma-Aldrich (Oakville, ON, Canada). Concentrations of FAs in all samples derived from six soybean accessions were expressed in micromoles per g dry weight of seed (μmol g dwt−1), while oil contents were reported in percentages of seed dried weight (%).
Exogenous hormone treatment
To examine the effect of exogenous CKs and ABA on FA metabolism during soybean seed maturation, transZeatin (tZ) and ABA (Sigma-Aldrich, Oakville, ON, Canada) solutions were used in a form of leaf spray at three concentrations: 50 nM (tZ50, ABA50), 100 nM (tZ100, ABA100) and 1000 nM (tZ1000, ABA1000). The hormone solutions were mixed with two drops of Tween 20 before spraying to drip-off. Each independent treatment was done on a 3-d interval, starting from the end of R4 stage (full pod) until the end of the R6 stage (full seed), which covers the critical seed-filling period. The control plants were sprayed with the same volume of water with two drops of Tween 20. In each independent treatment, 18 soybean plants were used.
Soybean seeds at harvest stage, R8, derived from plants exposed to the exogenous hormone treatments were collected and freeze-dried. FA composition and oil content in soybean seeds were analyzed, with three replicates for each parameter.
Data analysis
Statistical differences between metabolite levels detected at different experimental treatments were determined using an analysis of variance (ANOVA) followed by Duncan's multiple range tests (P < 0.05). Heat-maps were generated using SigmaPlot 12.5 software (Systat Software, Inc., San Jose, CA, USA). Principal component analysis (PCA; Ivosev et al., Reference Ivosev, Burton and Bonner2008; Dang et al., Reference Dang, Tessier, Lenoble, Durrieu, Omanović, Mullot, Pfeifer, Mounier and Garnier2014) was performed using an in-house Matlab script to locate correlated variables, including the detected levels of the hormone forms, all five FAs, and oil content during the four tested stages of six soybean accessions. The correlations and multiple linear regression analysis, guided by the coefficients derived from PCA analysis, were performed using SigmaPlot 12.5 software.
Results
Analysis of the endogenous phytohormone (ABA and CKs) effect on fatty acid/oil profiles during soybean seed maturation
Metabolite heat-maps suggest strong relationships between hormone metabolism and FA/oil accumulation
Twenty-six endogenous hormone forms were scanned using HPLC-MS/MS, resulting in the detection of ABA and 15 CK forms among six soybean lines during seed maturation. The CK forms were categorized into iP-, DZ-, tZ- and cZ-types. The iP-type fraction was represented by only two forms, iPNT and iPR. The DZ-type fraction had five derivatives, DZNT, DZR, DZOG, DZROG and DZ9G. The tZ-type CKs were detected as four different forms, tZNT, tZR, tZROG and tZ9G. Finally, the three hormone derivatives of cZ included: cZNT, cZR and cZROG (supplementary Table S1).
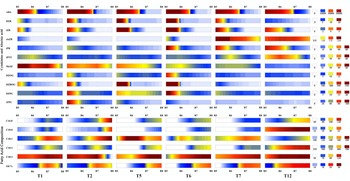
A heat-map was constructed to illustrate the changes in hormone concentrations during the four developmental stages among the tested soybean accessions (Fig. 2, upper panel). As an overall trend, the levels of ABA and CKs decreased during the seed maturation period, since most of the hormones peaked in concentration at the earliest stage, R5, and declined in the later stages. Based on the similarities among ABA, MeSZ, nucleotide and riboside CK profiles (Fig. 1, upper panel; supplementary Table S1), the six soybean accessions could be ascribed to two main groups: (1) T1, T2, T5, T6 and T7, and (2) T12, while three different groups could be differentiated based on the patterns in the levels of glucoside CKs, including (1) T2, (2) T1, T5, T6 and (3) T7 and T12. Overall, compared with all other accessions, T12 had: the latest retention of high ABA levels (did not decline until R7); strikingly lower levels of CK-glucosides (DZOG, DZROG, DZ9G, tZ9G), MeSZ and DZR throughout development; much higher and persistent levels of iP-type CKs (iPR, iPNT).
The heat-maps clustering the hormone levels (pmol g dwt−1) (upper panel) and FA composition (μmol g dwt−1) (below panel) of six soybean accessions: T1, T2, T5, T6, T7 and T12. A heat-map representation for all metabolites at R5, R6, R7 and R8 of seed development stages was constructed to represent a range of relative content levels in the following order from minimum to maximum quantities: white – light blue – blue – dark blue – yellow – orange – red – dark red. The transformations of colours simulated the changes in fatty acid or hormone content across soybean seed development based on the their measurements at the four stages, R5, R6, R7 and R8. This figure shows the continuous process rather than discrete time points. For all accessions, the scale that colours represent for each metabolite is given on the right side of the figure. Note that scales are different among metabolites.

To understand whether the divergence of hormone profiles observed among the soybean accessions corresponded to the variation in FA and oil profiles at the last four stages of seed maturation (R5-R8), FA profiles and oil levels were comprehensively examined using GC-FID. The data were used to generate heat-maps for better visualization of the FA/oil profiles of six soybean accessions (Fig. 2, lower panel; supplementary Table S2). Overall, the heat-map showed that FA accumulation and oil levels in the tested soybean accessions were increasing from R5, reaching the highest levels at R7 and R8 stages. Interestingly, FA respective profiles of T1, T2, T5, T6 and T7 were relatively similar, while compared with all other accessions, T12 had: much higher and persistent levels of C18:0 and C18:2; earlier and much greater accumulation of Oil%; much lower overall levels of C18:1 that never increased; a late increase in C16:0 only observed in one other accession (T2).
These results suggested that the accessions that shared similar hormone profiles also had similar FA profiles. The visual observations, as shown in the heat-map, implicated that hormone metabolism is involved in FA and oil biosynthesis.
Multivariate and correlation analyses confirm strong associations among hormone levels and FA and oil accumulation
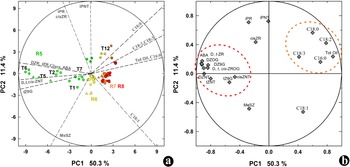
To build upon the results of visual analysis of the heat-maps, we determined whether the involvement of hormones on FA and oil production was supported when simultaneously accounting for multiple relationships using a PCA and an in-house Matlab script (Ivosev et al., Reference Ivosev, Burton and Bonner2008; Dang et al., Reference Dang, Tessier, Lenoble, Durrieu, Omanović, Mullot, Pfeifer, Mounier and Garnier2014). A total of 72 data points, composed of the three replicates of six soybean lines during four development stages (3 × 6 × 4), were arranged into 72 rows, while 22 variables, which included 16 hormone forms, 5 FAs, and oil content, were put into 22 corresponding columns. The first two principal components (PC1, PC2) accounted respectively for 50.3 and 11.4% of the dataset variance (Fig. 3). The PC1 axis demonstrated the dynamics of endogenous hormone levels and fatty acid contents from the R5 to R8 seed development stages. PC1 trends indicate a negative correlation between the endogenous levels of hormones (such as DZR, tZR, Glucs, ABA, DZNT, tZNT and cisZNT) and the accumulation of fatty acids (such as Tot Oil, C16:0). The PCA2 axis mostly reflected variations in the endogenous contents of iPNT and cisZR during the seed development stages (R5 to R8). The PCA analysis confirmed inverse trends whereby there was a gradual accumulation of FAs until they reached their highest level in the latter stages, R7 and/or R8; whereas the hormones were reduced as the seed maturation progressed. It also reflects that the hormone and FA profiles of T12 accession were divergent from those of the other accessions.
2D representation of the two principal components (PC) derived from principal component analysis (PCA) of the hormone/fatty acids (FA) dataset obtained for six soybean accessions during four stages of seed development. (a) Distribution of 72 samples based on their hormone profiles and FA composition. Circle, square, triangle, hexagon, diamond and crossed circle symbols represented soybean accessions: T1, T2, T5, T6, T7 and T12, respectively. Green, yellow, orange and red colours represent seed developmental stages: R5, R6, R7 and R8, respectively. (b) The correlations between 16 ABA/CKs (pmol g dwt−1) and 5 FAs (μmol g dwt−1) and total oil contents (%).

In the next step, we focused on the correlations among particular hormone levels at the earlier stages of seed maturation (R5 and R6) and the FA levels at the harvest stage (R8). Several positive correlations between hormones and FAs were found in addition to some negative ones (Table 1). Noticeably, the levels of particular RB forms, including DZR, iPR and tZR, detected at R5 and R6 stages, were positively correlated with the levels of selected FA and oil level at harvest. R5-DZR, R5-iPR and R5-tZR were correlated with R8-C18:2 and R8: Oil level, while R6-iPR and R6-tZR showed a positive correlation with R8-C18:0. In addition, R5-tZR was correlated with R8-C18:3, and R6-tZR showed a positive correlation with R8-Oil content. Lastly, no significant correlations were found between ABA levels at R5 and R6 with FA/oil levels.
The correlation coefficients (r)* between R8-FAs and R8-Oil%, and R5 and R6 hormone levels

* Only coefficients equal to or larger than 0.5 are presented.
Multiple regression suggests functional linkages between several endogenous hormone derivatives in FA and oil accumulation
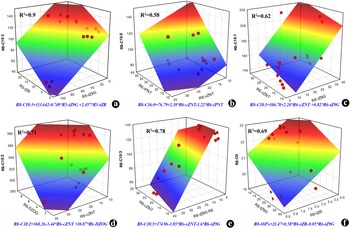
To test for causal relationships between FAs and multiple hormone forms, multiple linear regression analyses were performed (Fig. 4). Positive relationships of R8-C18:3 and R8-Oil content with tZR (the riboside derivative of tZ, the most active CK form in higher plants) were found at the R5, and R6 stages, respectively, while levels of tZ9G (an irreversible N 9-glucoside derivative) at R5 and R6 stages were negatively associated with R8-C18:3 and R8-Oil content, respectively (Fig. 4a, f). Interestingly, there were significant roles for R6-cZNT and R6-tZ9G since the former was involved in four double regression models (Fig. 4b–e) and the latter was prominent in three double models (Fig. 4c, e, f). Furthermore, both of these cases were observed to have negative associations with R8-C18:3 and positive associations with R8:C18:1. Also, R6-cZNT was also part of two other regression models, R8-C16:0 and R8-C18:2, in combinations with R6-iPNT and R6-DZOG, respectively. Specifically, R6-cZNT had a negative association in the model with R8-C18:2, but a positive relationship in the R8-C16:0 model. The determination of relationships between levels of CKs at R5 and R6 stages, and FAs and oil level at seed maturation (R8), implicate a regulatory role for phytohormones in the processes of FA biosynthesis.
The determination formulas of 3D models derived from multiple linear regression analysis between the levels of FA (μmol g dwt−1) or oil contents (%) at R8 and the levels of hormones (pmol g dwt−1) at R5 and R6 soybean seed developmental stage: (a) R8-C18:3 with R5-tZ9G and R5-tZR, (b) R8-C16:0 with R6-cZNT and R6-iPNT, (c) R8-C18:1 with R6-cZNT and R6-tZ9G, (d) R8-C18:2 with R6-cZNT and R6-DZOG, (e) R8-C18:3 with R6-cZNT and R6-tZ9G, and (f) R8-Oil% with R6-tZR and R6-tZ9G. The increases of the levels of FA (μmol g dwt−1) or oil contents (%) at R8 are demonstrated by ordered, rainbow colours (red, orange, yellow, green, blue, indigo and violet) for which violet shows the lowest content and red shows the highest. All independent variables (hormone levels at the R5 or R6 stage) contribute to predicting the values of dependent variables (FA or oil content at the R8 stage) with P < 0.05, n = 15.

Manipulation of FA profile using exogenous hormone treatments during soybean seed maturation
To best gauge the potential for hormones to affect FA profiles, accessions were selected to represent the most divergent metabolite profiles. The hormone and FA profiles of the T12 accession were the most divergent from those of the remaining accessions (T1, T2, T5, T6 and T7) which were all, by comparison, relatively similar. Therefore, for the exogenous hormone treatments, T12, was chosen as the most distinctive accession, and T2 was selected as a representative of the other five accessions.
Exogenous hormone treatments modified oil level by altering FA compositions in seeds at the harvest stage, R8
The effect of the exogenous hormone treatments could be seen in the changes of C16:0, C18:1, C18:2 and C18:3 levels since we did not find any significant changes in C18:0 levels under the applied exogenous ABA or tZ treatments compared with those of controls in both soybean accessions (Tables 2 and 3). However, these changes of FA levels did not usually lead to the increases of oil levels of both soybean accessions, T2 and T12 (Fig. 5), except for the tZ50 treatment that significantly increased R8-Oil level in T2 soybeans (Fig. 5b). We did not find any significant differences in oil levels under any of the ABA treatments compared with that of control in T2 soybean (Fig. 5a). On the other hand, except oil level of ABA100 treatment was comparable with that of control, oil percentage in T12 seeds upon treatment with all the ABA (Fig. 5c) and tZ treatments (Fig. 5d) was lower than that of the controls. These results suggest that both the exogenous ABA and tZ treatments have the potential to change the oil level by altering the FA profile in maturing seeds.
The effect of six exogenous hormone treatments including transZeatin (tZ) and abscisic acid (ABA) at three concentrations, 50 nM (tZ50, ABA50), 100 nM (tZ100, ABA100) and 1000 nM (tZ1000, ABA1000) on oil content (%) in T2 and T12 soybean accessions.

Seed fatty acid (FA) composition, including C16:0, C18:0, C18:1, C18:2 and C18:3 (μmol g dwt−1) at harvest (R8 stage), derived from ABA exogenous hormone treatments in T2 and T12 soybean accessions

* Significant differences were determined with a one-way ANOVA and Duncan's multiple range test and are denoted with different letters (P < 0.05), n = 3.
Seed fatty acid (FA) composition, including C16:0, C18:0, C18:1, C18:2 and C18:3 (μmol g dwt−1) at harvest (R8 stage), derived from tZ exogenous hormone treatments in T2 and T12 soybean accessions

* Significant differences were determined with a one-way ANOVA and a Duncan's multiple range test and are denoted with different letters (P < 0.05), n = 3.
Effect of ABA treatments on FA profiles
T2 accession
ABA1000 treatments increased C16:0 level, but reduced C18:2 content (Table 2). We did not find any significant differences in C16:0 and C18:2 levels under ABA50 and ABA100 treatments as opposed to those of control (Table 2). The contents of C18:1 in ABA50 was comparable to that of control, then it reduced significantly in ABA100, and the highest level of C18:1 found in the highest ABA concentration treatment. We observed that the level of C18:3 showed a hormesis response to exposure to increasing ABA treatments. The hormesis response was demonstrated by a biphasic pattern of C18:3 levels in which the highest level of C18:3 found in ABA100 treatment (Table 2).
T12 accession
The significant changes in FA levels in response to ABA treatments were obtained, even though we did not find any significant increase of FA contents in all ABA treatments compared with those of control (Table 2). Comparing among ABA treatments, the hormesis response to the increase of exogenous ABA concentrations observed clearly in T12 accession (Table 2). The levels of C16:0, C18:2 and C18:3 increase to the highest peak at the optimal ABA concentration, 100 mM while they were lower in the low and high dose of ABA treatments, ABA50 and ABA1000, respectively (Table 2). On the other hand, the level of C18:1 decreased significantly when the ABA treatments were used with higher doses (Table 2).
Effect of tZ treatments on FA profiles
T2 accession
Interestingly, we obtained the significant increases of all four FA levels in tZ50 treatment compared with those of control (Table 3). Moreover, the biphasic dose response of tZ treatment was shown clearly in this soybean accession (Table 3). The levels of C16:0, C18:1, C18:2 and C18:3 were lower in the control and higher tZ doses, 100 and 1000 nM, treatments compared with those of the optimal tZ50 treatment (Table 3).
T12 accession
Generally, the observed differences in the FA levels, among all tZ treatments, were represented by lower levels than those of the controls (Table 3). An exception was the C18:1 content obtained in the tZ100 treatment, which was significantly higher than the control and showed the highest levels of C18:1 (Table 3). On the other hand, the contents of C16:0, C18:2 and C18:3 obtained in the tZ100 treatment were the lowest levels compared with those of other tZ treatments and the control (Table 3).
Discussion
The modification of FA profiles in soybean seeds to enhance oil quality has gained agricultural and economic importance as it is a means to increase the market value of soybean oil. ABA and CKs, along with other phytohormones, are critical regulatory factors of seed development, and particularly seed maturation, the phase at which FA accumulation takes place. Potential associations between FA biosynthesis and hormonal signalling networks have been indicated in numerous reports; however, most studies on the potential involvement of ABA and CKs in FA biosynthesis have been conducted in vitro, and only a limited amount of data exist on the quantitative analysis of ABA and CK metabolites and relationships with FA composition during seed filling or maturation (Liu et al., Reference Liu, Liu, Wang, Jin and Herbert2010; Dunne and Maple-Grødem, Reference Dunne and Maple-Grødem2014; Kant et al., Reference Kant, Burch, Badenhorst, Palanisamy, Mason and Spangenberg2015). Hence, this study aimed to assess the potential for ABA and CK association in FA and oil accumulation during soybean seed maturation.
In our initial quantification of FA, oil and hormones, we found that, while the contents of FAs and oil percentages of all soybean lines increased gradually, and relatively late in development (R5 to R8 stage) and, for the most part, reached their peaks at the harvest stage (R8 stage), levels of hormones peaked much earlier (R5 stage) and declined towards to the harvest stage at which point the lowest ABA and CK contents occurred. Subsequently, multivariate analysis, PCA, of those hormone profiles and FA compositions across four seed maturation stages confirmed an inverse relationship between ABA/CK levels and FA accumulation.
The signalling of hormones, such as ABA and CKs, have been extensively studied during early soybean seed growth and development (Jones and Brenner, Reference Jones and Brenner1987; Morris, Reference Morris, Zamski and Schaffer Arthur1996; Frey et al., Reference Frey, Godin, Bonnet, Sotta and Marion-Poll2004; Jameson and Song, Reference Jameson and Song2016). The decreases of endogenous ABA and CK levels from R5 to R8 stages observed in this study are consistent with many other studies. ABA is associated with seed maturation and control of seed filling, and a balance between ABA and sucrose levels triggers the process of dry matter accumulation (Brocard-Gifford et al., Reference Brocard-Gifford, Lynch and Finkelstein2003; Gibson, Reference Gibson2004; Yan and Chen, Reference Yan and Chen2017). A decrease in ABA level during seed development has been previously reported in tobacco (Audran et al., Reference Audran, Borel, Frey, Sotta, Meyer, Simonneau and Marion-Poll1998), Arabidopsis (Kushiro et al., Reference Kushiro, Okamoto, Nakabayashi, Yamagishi, Kitamura, Asami, Hirai, Koshiba, Kamiya and Nambara2004) and soybean (Liu et al., Reference Liu, Liu, Wang, Jin and Herbert2010). In the early stages of soybean embryogenesis, ABA content is high at the R1 stage, then its level declines from R2 to R4, before finally increasing and reaching a peak at R5 (Finkelstein, Reference Finkelstein and Davies2010). In the latter stages, the concentration of ABA decreases significantly, but, it stays high enough to enforce seed dormancy and prevent premature seed germination (Emery et al., Reference Emery, Atkins, Basra and Basra2006; Finkelstein, Reference Finkelstein and Davies2010).
On the other hand, the expression data of several transcription factors and ABA biosynthesis genes during reproductive stages derived from Phytozome 12 (Goodstein et al., Reference Goodstein, Shu, Howson, Neupane, Hayes, Fazo, Mitros, Dirks, Hellsten, Putnam and Rokhsar2012; Zhang et al., Reference Zhang, Zhao, Li, Sun, Wang, Cai, Dierking and Ma2017; Jo et al., Reference Jo, Pelletier, Hsu, Baden, Goldberg and Harada2020) closely agreed with the ABA trends observed in this study. ABA3_2 and LEC1 were at their peak expression levels at R4 and R5 stages, which closely agreed with the highest ABA contents in R5 found in this study. In addition, ABI3_1 and all FUSs expressed highly towards R7 and R8 stage highlighted their roles in triggering the beginning of seed maturity.
Secondly, in this study, hormone profiling revealed that CKs are quite abundant during the early seed developmental stages, before declining considerably towards the seed maturation. High levels of endogenous CKs in developing soybean seeds during the early stages follow a similar pattern as it was observed in lupine (Emery et al., Reference Emery, Ma and Atkins2000) and rice (Ashikari et al., Reference Ashikari, Sakakibara, Lin, Yamamoto, Takashi, Nishimura, Angeles, Qian, Kitano and Matsuoka2005). Early peaks in CKs are thought to increase cell division and filling and set the stage for growth rates and, ultimately, seed mass (Emery et al., Reference Emery, Ma and Atkins2000). The CK involvement after these stages is much less well known; however, the previously observed reduction in CK biosynthesis-related gene expression (Le et al., Reference Le, Nishiyama, Watanabe, Vankova, Tanaka, Seki, Yamaguchi-Shinozaki, Shinozaki and Tran2012) suggests a decrease in CK content in the later stages of reproductive development. Overall, this confirms the vigorous hormone metabolism during two early stages, R5 and R6, of seed maturation that likely set the stage in some way for FA accumulation.
In soybean, the rate-limiting step of CK biosynthesis is catalyzed by the isopentenyltransferases (IPTs), while CK degradation is catalyzed by the CK dehydrogenases (CKXs). The expression levels of GmIPTs and GmCKXs in different reproductive stages (supplementary Table S4) were acquired from Phytozome (Goodstein et al., Reference Goodstein, Shu, Howson, Neupane, Hayes, Fazo, Mitros, Dirks, Hellsten, Putnam and Rokhsar2012) and Le et al. (Reference Le, Nishiyama, Watanabe, Vankova, Tanaka, Seki, Yamaguchi-Shinozaki, Shinozaki and Tran2012). Those gene expression levels are in line with the endogenous CK contents found in this study; whereby, the reduction of CK contents towards the late stages of the seed maturation resulted from the low expression levels of CK biosynthesis genes. The GmIPT2 and GmIPT14, two IPT genes involved in the tRNA-degradation pathway, were expressed consistently in flowers, pods and seeds, but the activity of de novo CK biosynthesis was low in flowers and limited to GmIPT11 (in pods and seeds) and GmIPT13 in pods. On the other hand, the gene expression level of GmCKXs was the highest in flower, and it remained high at the pod and seed stages.
In contrast to ABA and CK dynamics, which steadily declined, FA and oil increased during the mid- to late-stage soybean seed development. These results align with FA profiles reported previously for soybean and other legumes, for which a continued oil accumulation in the cotyledons was observed during the seed-filling stages (Rubel et al., Reference Rubel, Rinne and Canvin1972; Dornbos and McDonald, Reference Dornbos and McDonald1986; Liu et al., Reference Liu, Liu, Wang, Jin and Herbert2010, Reference Liu, Liu, Li and Herbert2013, Reference Liu, Li, Gu, Deng, Ren, Hong, Lu, Chen, Liang, Liu, Li, Gu, Deng, Ren, Hong, Lu, Chen and Liang2018; Wang et al., Reference Wang, Chen, Tonnis, Pinnow, Davis, An and Dang2018). FA and oil accumulation continued as seeds reached their full size past the end of R6 and early of R7, when they start to turn yellow and are called ‘physiologically mature’, even though the water content is still high (Fehr et al., Reference Fehr, Caviness, Burmood and Pennington1971; Rubel et al., Reference Rubel, Rinne and Canvin1972; Dornbos and McDonald, Reference Dornbos and McDonald1986; Dornbos and Mullen, Reference Dornbos and Mullen1992). The seed-filling period finished at the early R7 stage, and there were no significant differences in oil content in the tested seeds between R7 and the harvest stage, R8 (Fehr et al., Reference Fehr, Caviness, Burmood and Pennington1971; Fehr and Caviness, Reference Fehr and Caviness1977; Dornbos and McDonald, Reference Dornbos and McDonald1986). Most of the soybean genotypes tested in this study predictably had the oil content reaching its maximum values at the R7 or R8 stage.
After establishing hormone patterns, potential causal relationships between hormone levels and FA biosynthesis were explored using correlations and multiple regression analyses of the hormone and FA/oil datasets derived from the six different soybean accessions. In this study, we did not obtain the significant correlations between ABA levels at the R5 or R6 stages and FA contents at the harvest stage (Table 1). Previous work demonstrated that ABA interacts with sugar and triggers the seed-filling period, and this has been reflected in correlations between ABA and the seed growth rate (SGR) reported by others (Liu et al., Reference Liu, Liu, Wang, Jin and Herbert2010; Nguyen et al., Reference Nguyen, Kisiala, Andreas, Emery and Narine2016). However, during this period, SGR is the sum of accumulation rates of different seed reserves, such as FAs, protein, sugars, or starch (Rubel et al., Reference Rubel, Rinne and Canvin1972; Dornbos and McDonald, Reference Dornbos and McDonald1986). So, although ABA activity can be correlated with SGR, no studies thus far have discerned relationships between ABA and specific groups of reserves.
Correlations between total CK levels and the SGR were previously observed (Liu et al., Reference Liu, Liu, Wang, Jin and Herbert2010; Nguyen et al., Reference Nguyen, Kisiala, Andreas, Emery and Narine2016; Kambhampati et al., Reference Kambhampati, Kurepin, Kisiala, Bruce, Cober, Morrison and Emery2017), yet the possible relationships between single or multiple CK derivatives and specific FAs have not been elucidated. We observed compelling data to suggest the involvement of CKs in the regulatory network of FA and oil biosynthesis in soybean seeds. Firstly, the significant correlation coefficients were obtained between different CK forms, especially with two of the potentially active CK forms tZR and iPR (Spíchal, Reference Spíchal2012), and FA and oil content. Although these riboside fractions function mainly as translocation forms, they are also known to have CK activity, albeit lower than those of the freebase forms (Hirose and Takei, Reference Hirose and Takei2008). Secondly, regression analysis revealed statistically significant grounds for the involvement of CKs in FA accumulation. The significant relationships between tZR and tZ9G with C18:3 and oil level at R5 and R6, respectively, indicate that the enhancement of tZR signals during these two early stages could contribute to the increases in total oil as well as C18:3 accumulation. Interestingly, the predominance of cZNT at R6 also demonstrated the importance of the tRNA-degradation CK biosynthesis pathway during the R6 stage. If cZNT could be produced more in the tRNA-degradation CK pathway, then increases in C16:0 and/or C18:1 level could be achieved.
On the other hand, it has been demonstrated that hyper-accumulations of CK derivatives, consisting of CK riboside, nucleotide and glucoside conjugates indicate the CK metabolism was occurring. This suggests that the enhancement of CK activities in previous stages could cause increased accumulation of these CK conjugates. High activity CK profiles were previously reported during embryogenesis (Emery et al., Reference Emery, Atkins, Basra and Basra2006; Finkelstein, Reference Finkelstein and Davies2010). Based on the positive regressions of these CK conjugates with FA and oil levels, it could be implied that a promotion of CK signals during the embryogenesis results in the increases of these FAs and oil levels at the harvest stages. The enhancement of CK activities during the embryogenesis promotes the cell divisions in cotyledons of a dicot plant such as soybean. It is believed that as there are more cells, this enables more space for oil bodies to occupy, and consequently, the FA accumulation can be enhanced (Ohlrogge and Kuo, Reference Ohlrogge and Kuo1984; Nguyen et al., Reference Nguyen, Kisiala, Andreas, Emery and Narine2016).
Generally, the effect of the exogenous CK and ABA on the FA profiles of treated seeds at the harvest stage depended on the concentrations. The dose dependence could be seen via the biphasic changes of the FA levels following the increases of hormone concentrations. The biphasic patterns presented clearly in ABA treatments in both soybean accessions, while tZ treatments also followed the biphasic model in T2 soybean.
On the other hand, looking at the FA profiles in more detail may explain a more specific role for ABA and CKs in FA accumulation. Although both CK and ABA treatments did not change the levels of C18:0 significantly, these treatments altered C16:0 and C18:1 content leading to the corresponding changes of C18:2 and C18:3 contents. The reductions of C16:0 contents were observed in the higher concentration tZ treatments, including 1000 nM in T2 and 100 nM in T12 soybean. It was also found that the application of tZ at the highest concentration, 1000 nM, significantly reduced level of monounsaturated (C18:1) FAs in both tested soybean accessions. This effect is comparable to several previous reports (Kull and Büxenstein, Reference Kull and Büxenstein1974; Kull et al., Reference Kull, Kühn, Schweizer and Weiser1978; Davies and Chapman, Reference Davies and Chapman1984). High concentrations of kinetin, benzyladenine and tZ were found to increase polyunsaturated acid C18:3 and decrease C16:0 level in soybean callus cultured in vitro (Stearns and Morton, Reference Stearns and Morton1975), cucumber (Cucumis sativus) cotyledons (Davies and Chapman, Reference Davies and Chapman1984) and isolated shoots of painted nettles (Coleus blumei) and impatiens (Impatiens sultani) (Kull et al., Reference Kull, Kühn, Schweizer and Weiser1978). It has been suggested that CK treatment promotes desaturation and elongation in FA biosynthesis and, as a result, the increase of unsaturated acids (Kull and Büxenstein, Reference Kull and Büxenstein1974; Davies and Chapman, Reference Davies and Chapman1984). Likewise, the exogenous ABA treatment was found to promote the expression of FA elongase genes which helped to increase the accumulation of monounsaturated FAs, including eicosenoic acid (C20:1) and erucic acid (C22:1) (Holbrook et al., Reference Holbrook, Magus and Taylor1992), and C18:3 (Finkelstein and Somerville, Reference Finkelstein and Somerville1989) derived from in vitro embryos of rapeseed, compared with the embryos that remained on the plant. Thus, the effect of tZ and ABA treatments on C16:0 and C18:1 content could be due to the ability of these hormones to alter and promote the desaturation and elongation in FA biosynthesis. Furthermore, in the FA biosynthesis pathway, C18:1 serves as a precursor for C18:2 and C18:3 (Pham et al., Reference Pham, Lee, Shannon and Bilyeu2011; Li-Beisson et al., Reference Li-Beisson, Shorrosh, Beisson, Andersson, Arondel, Bates, Baud, Bird, Debono, Durrett, Franke, Graham, Katayama, Kelly, Larson, Markham, Miquel, Molina, Nishida, Rowland, Samuels, Schmid, Wada, Welti, Xu, Zallot and Ohlrogge2013; Nguyen et al., Reference Nguyen, Kisiala, Andreas, Emery and Narine2016); therefore, if tZ and ABA treatments modify C18:1 synthesis, they also have an essential impact on the level of C18:2 and C18:3.
In this work, we demonstrated that the exogenous hormone treatments could change the dynamic of FA accumulation. Furthermore, investigating the effect of exogenous treatments on final oil level in the tested soybeans, we have shown that the final harvest (R8) oil level of control seeds was usually higher compared with those under exogenous ABA or CK treatments in both soybean accessions, T2 and T12 (Tables 2 and 3). The ultimate oil levels at the harvest stage derived from the previously mentioned treatments were lower than those of controls in both accessions. Interestingly, only tZ50 treatment successfully increased the oil content of the seeds in T2 accession. Several factors could explain this observation. Firstly, ABA can trigger leaf senescence processes, which can contribute to the scarceness of nutrients due to the loss of photosynthetic ability (Weber et al., Reference Weber, Borisjuk and Wobus2005; Ji et al., Reference Ji, Dong, Shiran, Talbot, Edlington, Hughes, White, Gubler and Dolferus2011; Nguyen et al., Reference Nguyen, Kisiala, Andreas, Emery and Narine2016). This, in consequence, shortens the FA biosynthesis period resulting in the lower oil content at harvest. Secondly, the treatments at toxic levels of tZ may invoke stress responses in T2, which are similar to the response of soybean towards ABA treatments. Finally, we have shown tZ treatment at the optimal concentration could promote FA and oil production significantly. The tZ treatment at the concentration of 50 nM was the optimized treatment for T2 soybean to take advantage of the increase of CK during seed maturation, which is believed to help nutrient allocation through the source/sink relationships, the seeds to maintain their green state, as well as photosynthetic ability longer (Qin et al., Reference Qin, Gu, Zhang, Sun, Kuppu, Zhang, Burow, Payton, Blumwald and Zhang2011; Kuppu et al., Reference Kuppu, Mishra, Hu, Sun, Zhu, Shen, Blumwald, Payton and Zhang2013; Kant et al., Reference Kant, Burch, Badenhorst, Palanisamy, Mason and Spangenberg2015; Décima Oneto et al., Reference Décima Oneto, Otegui, Baroli, Beznec, Faccio, Bossio, Blumwald and Lewi2016). As a result, tZ50 is the only treatment successfully promoting the increases of FA and oil contents in T2 accessions.
Collectively, the present results are the first to investigate the endogenous CK and ABA dynamics and the effect of the exogenous tZ and ABA application on FA profiles during soybean seed maturation comprehensively. The CK and ABA quantitation, together with FA composition analysis during four critical stages of soybean seed maturation, allowed a closer observation at the role of endogenous hormones, CK and ABA in this study, on soybean FA biosynthesis. They expand our understanding of their relationships via the multifaceted associations observed between endogenous CK and FA profiles. Furthermore, the uses of exogenous hormones confirmed the hypothesis that the alteration of hormone levels could lead to the change of FA biosynthesis during seed maturation.
Direct infusion of hormones into seeds was not possible, and so the hormone sprays were applied to the source leaves that provide for the seed sinks. The exogenous hormone treatments on leaf may not fully reflect the roles of the endogenous hormones in developing seeds for oil regulation, but it was the closest approximation available. While much remains to be further explored in soybean or legume plants, in general, regarding the role of hormones in the FA biosynthesis, this study provides unique evidence of the CK and ABA dynamics. It supports previous literature on the involvement of CKs and ABA in the FA production of an oil crop.
Although major efforts have been made in identifying the potential role of phytohormone in the regulation of fatty acid and oil content in crops, further progress will be required to clarify more signalling mechanisms and, more importantly, to integrate any dynamics imposed upon different signalling pathways. To date, the best illustration of a strategy towards a more integrated view of soybean seed development is the study of endogenous profiling and exogenous treatment of phytohormone (ABA and CK). Indeed, details of this study, associate ABA and CK with inducing or changing the fatty acid profiles and oil levels. Promising results from exogenous ABA and CK treatments in our study invite further investigations of more complete signalling cascades involved from regulation of phytohormone triggers in nutrient source leaves to the final output of the FA/oil content in seeds. Furthermore, the integration of perception to final output at the molecular, cellular and tissue levels is, as yet, poorly understood. In further research, the expression levels of numerous vital enzymes regulating the FA [for example, ACC, DGAT and LPAAT genes (Pham et al., Reference Pham, Lee, Shannon and Bilyeu2011; Li-Beisson et al., Reference Li-Beisson, Shorrosh, Beisson, Andersson, Arondel, Bates, Baud, Bird, Debono, Durrett, Franke, Graham, Katayama, Kelly, Larson, Markham, Miquel, Molina, Nishida, Rowland, Samuels, Schmid, Wada, Welti, Xu, Zallot and Ohlrogge2013; Nguyen et al., Reference Nguyen, Kisiala, Andreas, Emery and Narine2016)], and hormone biosynthesis [for example, IPT, LOG and CKX genes (Frébort et al., Reference Frébort, Kowalska, Hluska, Frébortová and Galuszka2011)] should be studied in order to determine the specific roles of various endogenous hormones during FA accumulation in soybean. On the other hand, the relationship among yield, FA composition, and hormonal regulation during seed development needs to be clarified in order to obtain a high yield soybean line with a desired FA composition. The importance of soybean as a crop plant, for which the final fatty acid and oil content is thought to be determined during early development, means that knowledge regarding the regulation of phytohormone in these early development steps, such as that provided in this study, provides key information for modern crop-improvement programmes.
Supplementary material
To view supplementary material for this article, please visit: https://doi.org/10.1017/S0960258521000192.
Acknowledgements
This work was supported by a Natural Sciences and Engineering Council of Canada (NSERC) Discovery grant No. RGPIN-05436 to RJNE and by Trent University.
Author contributions
T.Q.N. contributed to conceptualization, literature research and carried out the experiments. The first manuscript draft was written by T.Q.N. H.N.N. helped to interpret the result and improve the discussion. A.K., S.N. and R.J.N.E. commented on previous drafts and critically revised the work. All authors read and approved the final manuscript.