I. INTRODUCTION
A new family of alumina-forming austenitic (AFA) stainless steels is currently being developed at the Oak Ridge National Laboratory for structural application in aggressive oxidizing environments at 873–1173 K.Reference Brady, Yamamoto, Santella, Maziasz, Pint, Liu, Lu and Bei1,Reference Yamamoto, Brady, Lu, Maziasz, Liu, Pint, More, Meyer and Payzant2 The AFA steels exhibit a useful combination of high creep strength and oxidation resistance at elevated temperatures. The excellent oxidation resistance of the AFA steels is due to the formation of an alumina scale replacing the traditional chromia scale to protect the conventional austenitic steels.Reference Brady, Yamamoto, Santella and Walker3,Reference Yamamoto, Brady, Lu, Liu, Takeyama, Maziasz and Pint4 The adjustment of alloying elements was accomplished based on the chemical composition of the high-temperature ultrafine precipitation strengthened steel family of austenitic steels, and with the additions of Al, B, Nb, C, and other elements, to form nanoscale precipitates with dispersive distribution, and a stable alumina layer on the surface of the AFA steels.
Generally, the microstructure of the AFA steels is a single-phase, face centered cubic austenite, with a number of nanoscale NbC and NiAl based precipitates with dispersive distribution.Reference Brady, Yamamoto, Santella, Maziasz, Pint, Liu, Lu and Bei1,Reference Trotter and Baker5,Reference Yamamoto, Brady, Santella, Bei, Maziasz and Pint6 The level of Al in the AFA steels is higher than that in conventional austenitic steels and this produces alumina on the surface of the steel. A transition from protective alumina scale to internal oxidation of the Al may also occur. In addition, the Al element will also combine with the Ni element to form a NiAl precipitate in which the small particle size increases creep strength at high temperature.Reference Trotter and Baker5,Reference Xu, Zhang, Chen and Lu7,Reference Moon, Lee, Heo, Han, Kang, Ha and Suh8 During the past ten years, most research has focused on the adjustment of the addition of the alloying elements, especially Al and Ni,Reference Yamamoto, Santella, Brady, Bei and Maziasz9 the improvement of creep strength and oxidation resistance,Reference Yamamoto, Takeyama, Lu, Liu, Evans, Maziasz and Brady10,Reference Xu, Zhang, Sun and Lu11 and the effect of alloying elements on the related properties.Reference Yamamoto, Santella, Brady, Bei and Maziasz9,Reference Brady, Magee, Yamamoto, Helmick and Wang12 Until now, however, the heat treatment before the related properties test was still carried out using the traditional process used on the conventional austenitic stainless steels.Reference Zhou, Xu, Mao, Yan, Nieh and Lu13,Reference Trotter, Rayner, Baker and Munroe14 Changes in the microstructure of the AFA steels due to heat treatment have not been thoroughly investigated. Unlike the case with conventional austenitic stainless steels, there are large changes in the alloying elements in the AFA steels and this leads to the alternation of the precipitation strengthening mechanism due to the formation of NiAl precipitate during heat treatment. This means that the microstructure evolution behavior of the AFA steels subjected to conventional heat treatment needs to be examined because they play an important role in the properties of the resulting AFA steels.
The objective of this study is to understand the austenite grain growth behaviors in the AFA steel subjected to holding at various austenitization temperatures during normalizing and annealing, respectively. A modified kinetic model of grain growth derived from isothermal growth kinetics was developed taking the heating history into consideration.
II. EXPERIMENTAL PROCEDURE
The material under investigation was 4 wt% Al-AFA steel which was melted in a vacuum induction-melting furnace, poured into 20 kg ingot, and then homogenized at 1453 K for 5 h. After homogenization, the ingot was hot-rolled at 1473 K to 10 mm thick plate and then it was air cooled. The chemical composition of the AFA steel was determined by inductive coupled plasma-optical emission spectrometry, and the chemical composition obtained in this way is given in Table I. Wire cutting was used to machine the samples to a size of 30 × 30 × 10 mm.
Chemical composition of the AFA steel (mass%).

Before the heat treatment experiment, differential thermal analysis (DTA) was carried out in a high purity argon atmosphere to avoid oxidation. The sample used for DTA was cylinder of Φ5 × 3 mm, to which the following process was applied: the specimen was first heated to 1473 K at a rate of 10 K/min, this temperature was held for 5 min, and then cooled to room temperature at the same rate. The heat treatment experiment was conducted in a vacuum tube furnace with a temperature tolerance of ±5 K, and a vacuum degree of −0.09 MPa in the furnace was retained to avoid oxidation. The samples were first heated from room temperature to a peak temperature (1273, 1373, 1473, and 1523 K) with the same rate applied on DTA, and held for 5 min, followed by cooling to room temperature using two methods: air cooling and furnace cooling, i.e., normalizing and annealing.
Microstructures of the samples were observed by optical microscopy (OM). The OM samples were prepared by grinding with a series of SiC paper from 240 to 1200 grit, followed by diamond paste (0.1 µm) as the final mechanical polishing in sequence, and then etched with a solution of water (30 mL), hydrochloric acid (30 mL), nitric acid (10 mL), and chrysolepic acid (3 g). The phase compositions were identified at room temperature by routine x-ray diffraction (XRD) analysis using Cu Kα radiation, with a step size of 0.02°. Vicker's hardness tests were done with an applied load of 9.8 N (100 g) for 20 s. Measurements of the austenite grain size, based on optical micrographs, were carried out using ImageJ software.
III. RESULTS
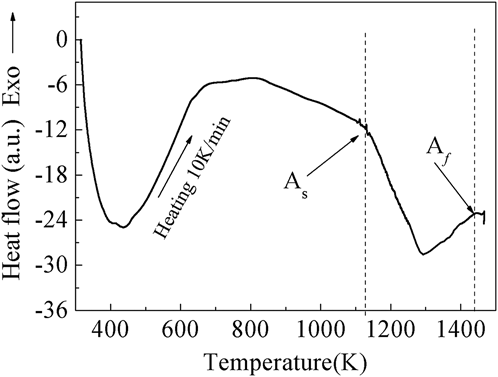
The result of heat flow as a function of temperature for the AFA steel subjected to continuous heating to 1473 K with a rate of 10 K/min is displayed in Fig. 1. During heating, the first endothermic peak at around 400 K indicates the normal absorption of samples with heating. The second endothermic peak at around 1300 K represents a phase transformation, i.e., austenitic transformation. Another endothermic peak during holding at 1473 K should be a normal endothermic process that is due to the homogenization of alloying elements. Applying the method used by Gao et al.,Reference Gao, Wang, Gong, Qu and Lin15 the transformation temperatures of the austenite, A s and A f (the beginning and the ending temperature of austenitic transformation, respectively), can be measured from the DTA curve (as seen in Fig. 1). Thus, the A s and A f obtained were 1130 K and 1439 K, respectively, which means austenitic transformation finishes with a wide range of about 300 K.
Heat flow as a function of temperature for the AFA steel subjected to heating to 1473 K with a rate of 10 K/min.

Figure 2 shows an optical micrograph of the AFA steel after hot-rolling. The matrix of the austenite with a strip shape along the rolling direction can be seen. A large number of coarsened particles which were vertically aligned and along the rolling direction, were precipitated both on the austenite grain boundaries and in the grain interior. During hot-rolling, the recovery of the microstructure of the materials, and the diffusion of atoms, such as Nb, C, Cr, Al, etc., seems to indicate that the formation of precipitates is easier. The precipitates will be coarsened under the following cooling and re-rolling treatment. The optical micrograph denotes a typical microstructure of the hot-rolled materials.
Optical micrograph of the hot-rolled AFA steel.
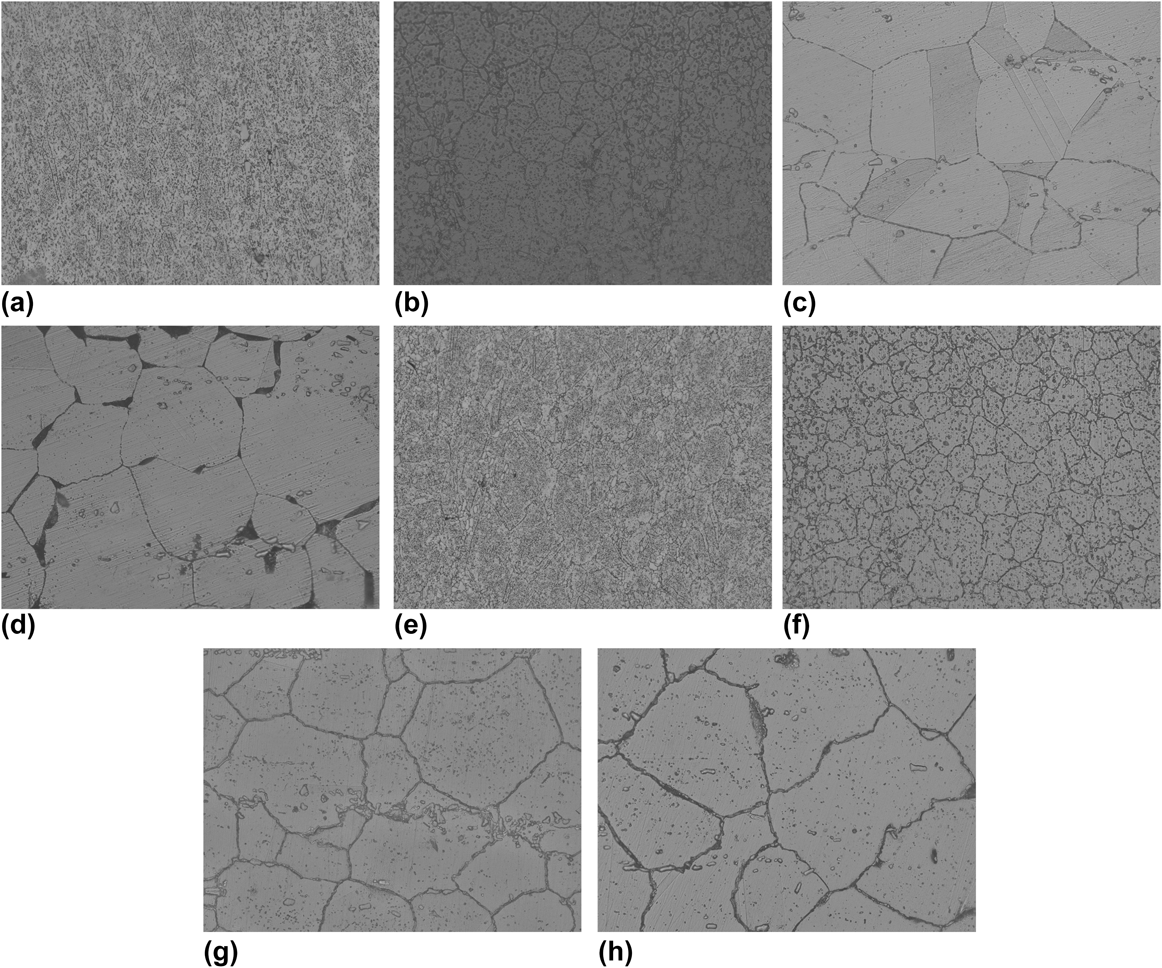
Figure 3 represents optical micrographs of the AFA steel subjected to normalizing and annealing at various temperatures, respectively. As shown in the DTA curve (as seen in Fig. 1), the final temperature of the austenitic transformation is about 1273 K, a temperature at which the austenitization is not complete. Hence, the recrystallization of the austenite may not be complete, and the microstructure showed the coexistence of a partly equiaxed structure and a hot-rolled structure [as seen in Figs. 3(a) and 3(e)]. With the increase in the holding temperature, the completely equiaxed grains can be found, and there may even be some abnormal growth grains due to the extreme superheating. The homogeneous and equiaxed grains can be distinguished for the samples held at 1373 K and 1473 K, and the particles sizes increase with the increase in temperature. It should be noted that, instead, some special large particles of the precipitates located at grain boundaries form, and can be seen when the sample is normalized at the temperature of 1523 K. The dark features at grain boundaries in Fig. 3(d) represent the coarsened precipitates. It could also be seen that the width of the grain boundaries of the annealed samples were larger than that of the normalized samples. The atoms, diffused to the grain boundaries, form a large number of precipitates which increase the width of the grain boundaries. During normalizing, instead, most of the atoms are frozen in the matrix lattice, and the number of precipitates formed on the grain boundaries is smaller. It should also be noted that there are some twin grains for the normalized sample held at 1473 K [as seen in Fig. 3(c)].
Optical micrographs of the AFA steel subjected to normalizing and annealing at various temperatures: normalized at (a) 1273 K, (b) 1373 K, (c) 1473 K, (d) 1523 K, and annealed at (e) 1273 K, (f) 1373 K, (g) 1473 K, (h) 1523 K.
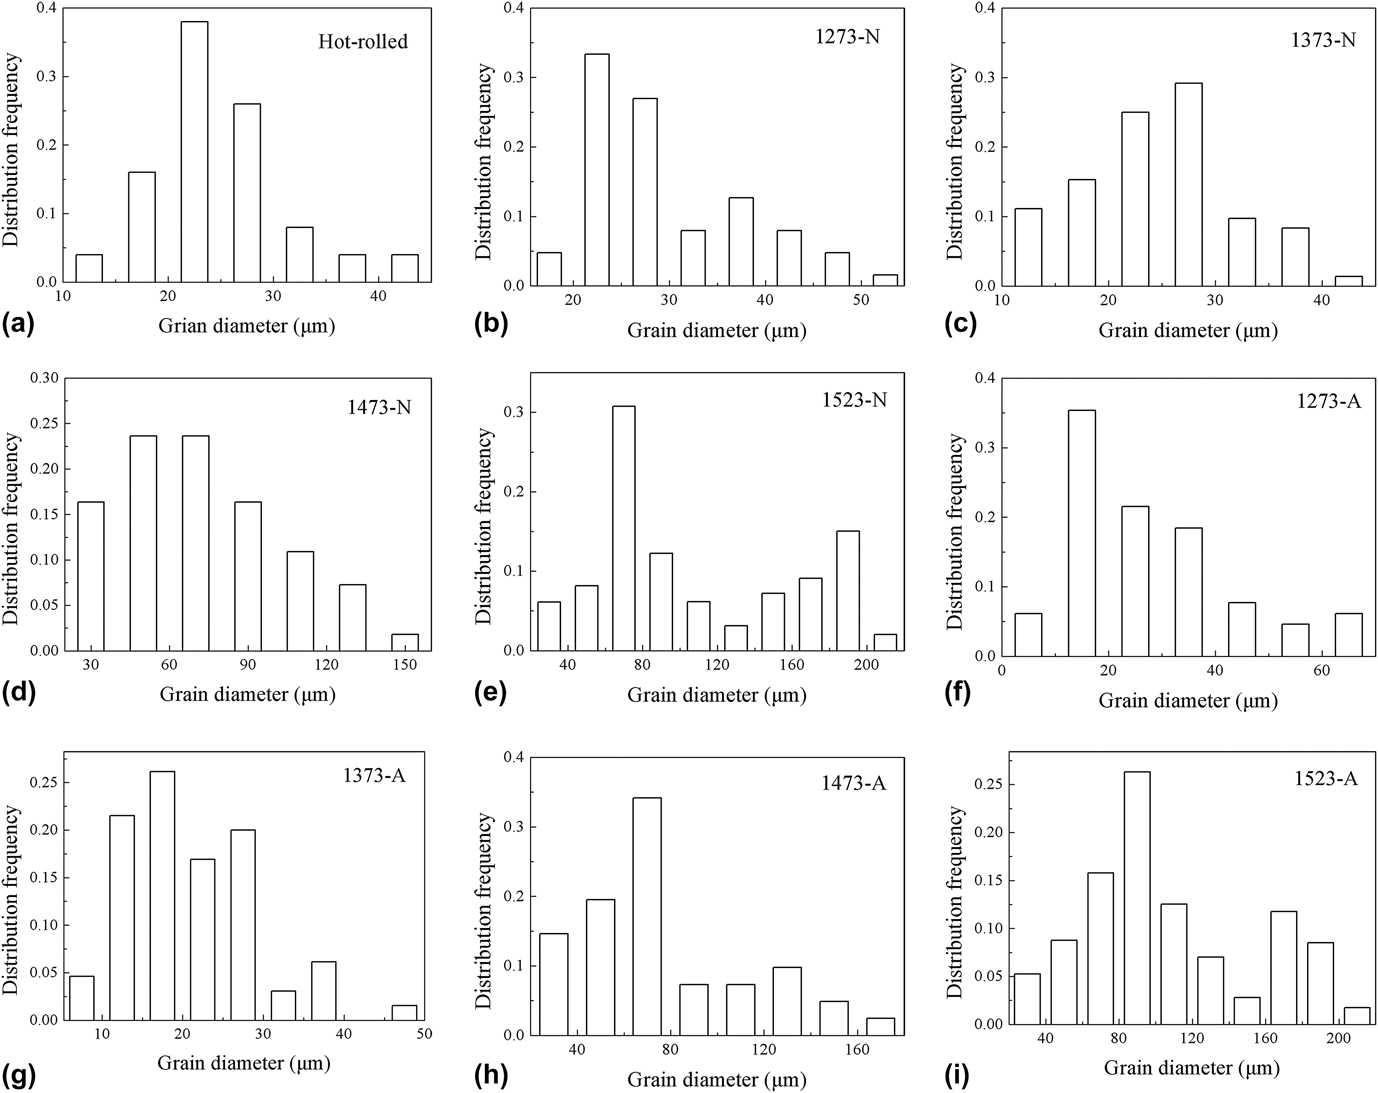
The microstructure of the materials has a large effect on the mechanical properties, and for this reason, the controlling of grain structures in steels is very important.Reference Illescas, Fernández and Guilemany16 The austenite mean grain size is an important parameter which determines the specific mechanical properties.Reference Kaijalainen, Suikkanen, Limnell, Karjalainen, Kömi and Porter17–Reference Wang, Wang and Lu19 This means that the influence of temperature on austenite grain size must be analyzed. In addressing the mean grain size, the distribution of austenite grain sizes for the AFA steel after subjecting to normalizing and annealing were firstly measured and counted from the optical micrographs, and the mean grain size thus can be obtained from this. To obtain sufficiently accurate statistics for the grain size distributions, the number of optical micrographs measured was in a range from 20 to 30. The grain size distributions were measured with computer-aided software. In addressing, the area of each grain was defined as the sum of its net internal area and half the area of its boundary. Applying Banerjee's method,Reference Banerjee, Militzer, Perez and Wang20A was assumed to represent the grain area, and the equivalent area diameter, d A, can be given as:
 $${d_{\rm{A}}} = \sqrt {{{4A} \over \pi }} \quad .$$
The grain diameter was obtained using the measured grain area in Eq. (1). Hence, the grain size distributions obtained as a function of grain diameter are displayed in Fig. 4. The changes in grain size basically obey the Gaussian distribution, except at 1523 K. Despite this, some abnormal grain sizes larger than 120 µm can be found in the samples treated at temperatures higher than 1473 K, and 200 µm of austenite grain size can even be seen at 1523 K. With increasing temperature, the pinning force of the grain boundary decreases with the dissolution of the precipitates, and the mobility of the grain boundary increases, resulting in abnormal growth of the austenite grain.Reference Rios21,Reference Rios22
Distribution frequency as a function of austenite grain diameter for the AFA steel: (a) hot-rolled, normalized at (b) 1273 K, (c) 1373 K, (d) 1473 K, (e) 1523 K, and annealed at (f) 1273 K, (g) 1373 K, (h) 1473 K, (i) 1523 K.
The austenite mean grain size was obtained from the distributions of measured grain sizes. Based on the austenitic transformation temperature of the steel, the austenitization is not complete for the samples held at 1273 K. In theory, the measured grain contains two parts: the first one (the large size) indicating the prior hot-rolled grain and the second one (the small size) representing the newly formed grain. Hence, a new statistical method needs to be considered in which all the grain sizes for the incomplete austenitization sample (holding at 1273 K in the paper) which are larger than the mean grain size of the hot-rolled sample are not counted. This means that only the grain newly formed during austenitization is considered. The thus obtained mean austenite grain size of the samples via temperature is shown in Fig. 5. The mean austenite grain size slightly decreased due to the formation of new austenite at 1273 K, then increased with increasing temperature to 1373 K, and finally sharply increased because of abnormal grain growth at higher temperature.
The obtained mean austenite grain size via temperature for the AFA steel.
As we know, the most important heat treatment variables which affect the austenite grain size of steels are temperature and time. Several kinetic models describing grain growth have been introduced and simulated.Reference Illescas, Fernández and Guilemany16,Reference Rios22,Reference Garzón and Ramirez23 Banerjee,Reference Banerjee, Militzer, Perez and Wang20 Adrian,Reference Adrian and Pickering24 and ManoharReference Manohar, Dunne, Chandra and Killmore25 et al. derived the kinetic models of grain growth in microalloyed steels based on the consideration of precipitates. In most cases, the data may be represented by an empirical equation: the parabolic grain growth equation as a description of the dynamic evolution of a cellular network in which the only driving force is assumed to be that motivated by a reduction in grain boundary curvature,Reference Gill and Cocks26,Reference Burke and Turnbull27 and it is given as:
 $${D^n} - \mathop {{D_0}}\nolimits^n = Kt\quad ,$$
where D and D 0 are the final grain size and the initial grain size, respectively. K is a constant which depends on the steel composition and temperature, but independent of the grain size, n is often termed the grain growth exponent, dependent on temperature or time. For recrystallization or isothermal grain growth, if D 0 is small enough to be neglected when compared to the final grain size, D, the size of continuous grain growth as a function of holding time, can be given using an equation suggested by BeckReference Beck, Kremer, Demer and Holzworth28:
 $$D = K{t^{{1 \mathord{\left/ {\vphantom {1 n}} \right. \kern-\nulldelimiterspace} n}}}\quad .$$
Theoretically, Eq. (3) is suitable to simulate the recrystallization of pure materials.
As seen in Figs. 3 and 4, the austenite grain size is heterogeneous, and the mean grain size obtained in this way cannot absolutely reflect the final grain size. The final grain size can be obtained using the following equationReference Adrian and Pickering24:
 $$D = {9 \over 8}{D_{\rm{m}}}\quad ,$$
where D m is the measured mean grain size. It is assumed that the grain size at temperature 1273 K is the initial grain size, D 0, which is not small enough to be neglected, compared to the grain sizes at other temperatures. Hence, Eq. (2) can be used when examining austenite grain growth as temperature increases.
Consequently, Eq. (2) is applicable to isothermal annealing, because it describes the grain growth of the materials at the same temperature but at varying times during the process.Reference Banerjee, Militzer, Perez and Wang20,Reference Uhm, Moon, Lee, Yoon and Lee29,Reference Moon, Lee and Lee30 For continuous heating, time t in Eq. (2) is a function of temperature and heating rate, and can be divided into two parts: the time of grain growth from the initial temperature, T 0, to the final holding temperature, T, and the holding time at T. Thus, the following relationship is given as:
 $$t = \mu \left( {{{T - {T_0}} \over \varphi }} \right) + t'\quad ,$$
where μ is a coefficient, φ is the heating rate with a unit of K/s, and t′ as holding time at temperature T. In fact, even though the grain growth holds at the austenitization temperature, the grain still grows during austenitized heating, and for short-time holding, the time during heating must be considered. This is because the heating process is different from the holding process, and thus μ is introduced. Substituting Eq. (5) into Eq. (2), and the kinetic model of grain growth can be written as:
 $${D^n} - \mathop {{D_0}}\nolimits^n = K\left( {\mu \left( {{{T - {T_0}} \over \varphi }} \right) + t'} \right)\quad .$$
As assumed above, the grain size at a temperature of 1273 K is considered as the initial grain size, and thus T 0 = 1273 K. K also varies with temperature according to the relationship shown by the Arrhenius form, and Eq. (6) can be rewritten as:
 $${D^n} - \mathop {{D_0}}\nolimits^n = {K_0}\,\exp \left( { - {{{Q_{\rm{G}}}} \over {RT}}} \right)\left( {\mu \left( {{{T - {T_0}} \over \varphi }} \right) + t'} \right)\quad ,$$
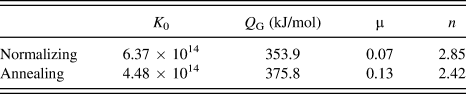
where K 0 is a constant which depends on material compositions and processing conditions, Q G is the activation energy for grain growth, and R is the universal gas constant. For Eq. (7), the parameters, K 0, Q G, μ, and n can be obtained by fitting the experimental data into Eq. (7). The results of the samples subjected to normalizing and annealing are displayed in Fig. 6. During annealing, the decrease in temperature will also lead to the growth of austenite grain, and thus the deviation between the experimental data and the fitted data for annealing is obviously larger than for normalizing. Based on the fitted data, the related parameters, K 0, Q G, μ, and n, in Eq. (7) can be obtained and they are listed in Table II.
The fitted results of austenite grain size as a function of temperature for the AFA steel subjected to (a) normalizing and (b) annealing at various temperatures.
The obtained kinetic parameters of the AFA steel subjected to normalizing and annealing based on the fitted data.
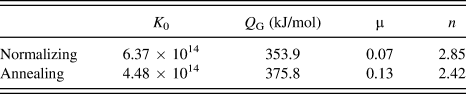
In regard to the heat treatment process, the difference between normalizing and annealing in the experiment is simply due to the cooling method: air cooling and furnace cooling, respectively. For this reason, the activation energy for grain growth, Q G, should be the same value for both normalizing and annealing. The austenite grain starts to grow after the temperature has been increased to a level which can provide sufficient drive force during heating. This means that the activation energy of the austenite grain growth should be constant depending on material compositions, heating rate, and holding time at peak temperature.Reference Manohar, Dunne, Chandra and Killmore25 The difference in the activation energy of the grain growth for AFA steel after normalizing and annealing is derived from the related parameters during model simulation. The coefficient μ reflects the contributed fraction of the heating time after austenite grain growth begins, compared to the total time, and the results showed that the heating time during annealing is more important than the heating time during normalizing. The resulting values of n were 2.85 and 2.42 for normalizing and annealing, respectively. Due to higher peak temperature, the mechanism of austenite grain growth has changed from normal growth to normal + abnormal growth, and the thus obtained value of n represent the normal and the abnormal austenite grain growth as the temperature increases. This will be discussed later.
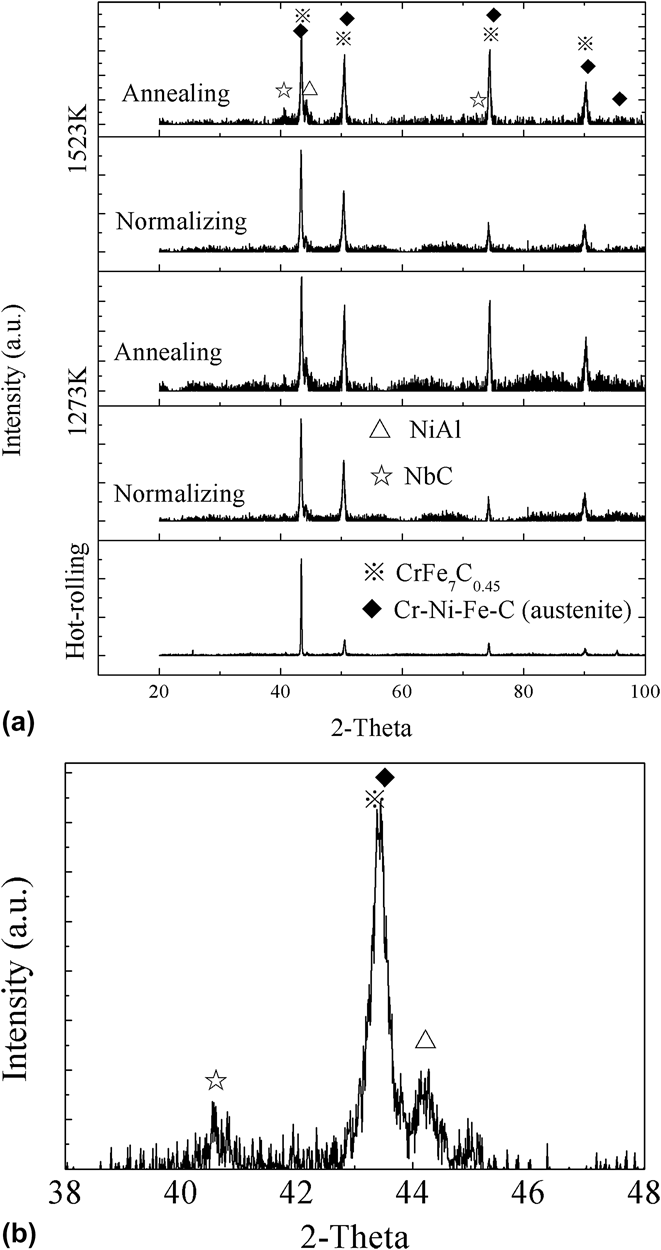
Figure 7 illustrates XRD patterns for the AFA steel samples subjected to hot-rolling, normalizing and annealing at 1273 K and 1523 K, respectively. The corresponding peak in the main phase, austenite, is obviously visible, and the peak in the CrFe7C0.45 phase is very close to the austenite. Similar XRD patterns were obtained for all the samples, but some differences can also be distinguished:
(i) No other peaks can be found after hot-rolling, except the peaks of the austenite and the CrFe7C0.45 phases.
(ii) Whether normalizing or annealing at 1523 K, some small peaks appeared, and the height of the peaks increased with the increase in the holding temperature, and this means that the recognized phases were NiAl and NbC precipitates [as seen in Fig. 7(b)]. It also means that the precipitated content of the NiAl and the NbC phases increase as the holding temperature increases. Generally, routine XRD fails to detect the phase when the expected minute quantity of phase is less than 3 wt%, and for most steels, only the main phase, such as austenite, ferrite, or martensite, can be distinguished.Reference Pous-Romero, Lonardelli, Cogswell and Bhadeshia31–Reference Gao, Gong, Wang, Qu and Huang33 Otherwise, high-energy x-ray transmission analysis must be used. Hence, the appearance of small peaks reflects the increase in precipitates.
(iii) Except in the case of the hot-rolled sample, the full width at half maximum decreased as temperature increased from 1273 K to 1523 K and this also reflects the increase in the size of the austenite grain.
XRD patterns for the AFA steel (a) subjected to hot-rolling, normalizing and annealing at 1273 K and 1523 K, respectively, and (b) magnification in detail.
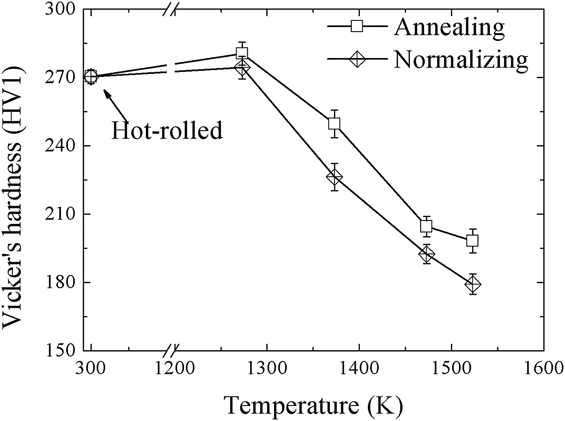
Figure 8 shows the Vicker's hardnesses of the AFA steel subjected to hot-rolling, normalizing, and annealing, respectively, as a function of temperature. Two stages can be distinguished. First, the Vicker's hardness after normalizing and annealing both at 1273 K was slightly higher than after hot-rolling. Second, the hardness value decreased sharply with the increase in the heat treatment temperature. In addition, the hardness value after annealing was also higher than after normalizing at the same temperature. After hot-rolling, the microstructure consists of prolonged austenite grain and precipitates. The former will recrystallize and the latter will decompose during the austenitization process. The grain size of the newly formed austenite for treating at 1273 K is smaller than that which has been hot-rolled, and the precipitates cannot dissolve completely at this temperature (even no dissolutions for the NbC and the NiAl precipitates), and hence, the refinement of the recrystallized grain size results in an increase in the Vicker's hardness. During normalizing or annealing, the austenite grain grows and the precipitates start to dissolve as the temperature increases. Solid solution strengthening will increase if the alloying elements have enough time to diffuse and dissolve into an austenite lattice. On the other hand, the precipitation strengthening decreases. The higher the temperature, the larger the austenite grain size is, and the abnormal grain growth leads to a decrease in Vicker's hardness. In the end, there is not enough time for the solid-solution alloying elements to precipitate, and they will be frozen in the austenite lattice due to fast cooling in air. This means that the influence of the precipitation strengthening during annealing on the Vicker's hardness will be stronger than during normalizing.
Vicker's hardnesses of the AFA steel subjected to hot-rolling, normalizing, and annealing, respectively, as a function of temperature.
IV. DISCUSSION
As is well-known, Eq. (2), as the classical grain growth model, is asserted to be valid for both 2 dimensions and 3 dimensions, and mainly applied in the annealing process, especially isothermal annealing for which the measured grain size is a function of the holding time. For engineering work, however, it is customary to present isochronal growth curves which illustrate the increase of grain size as a function of temperature for a constant holding time.Reference Burke and Turnbull27 For heating at a same rate to different temperatures and holding for a relatively shorter time, the grain size will appear to be related to the temperature. Under these conditions, the function of temperature must be considered, and thus a modified formula, Eq. (7), is obtained and derived from Eq. (2). It should be noted that Eq. (7) is suitable for the situation in which the heating time is not short enough to be neglected, compared to the holding time. According to the results of differing μ values, more consideration needs to be given to the heating time after the beginning of grain growth. In fact, both heating and cooling in the furnace affect the grain size, and the μ value reflects the addition of heating and cooling time during annealing.
n as a kinetic exponent is generally considered to be equal to 2 in some literature studies.Reference Burke and Turnbull27,Reference Staśko, Adrian and Adrian34–Reference Zhou, O'malley and Zurob36 However, the measured values of n are usually larger than 2, and a wide range of values has been found, especially for the alloys or steels. Yue et al. reported that the exponent was 2.77 for austenitization of GCr15 steel.Reference Yue, Zhang, Liao and Gao37 Illescas et al. found that the exponent varied from 2 to 8 in a temperature range of 1323–1523 K for HSLA steel.Reference Illescas, Fernández and Guilemany16 Militzer et al. showed that in A36 steel, the exponent increased to 14.9 under high heating.Reference Militzer, Hawbolt, Meadowcroft and Giumelli38 The variety of the exponents corresponds with the grain growth mechanism. n exponent as 2, indicates that there is a high solubility of the different elements in the steel. For 3 and 4, the effects of the precipitate phases with diffusion are produced in the grain and at the grain boundary, respectively. If the n exponent is above 5, the grain growth is controlled by interface migration without the effect of the long range diffusion of the atoms and this means that the stable precipitates and the “frozen” atoms will restrict grain growth. For isothermal data, n varies with temperature, but the assumption that the initial grain size is at the same temperature and in the same situation as the activation energy of the grain growth. If, instead, it is assumed that the grain size is a function of temperature, i.e., isochronal grain growth, the value of n must be a constant independent of temperature, and this is the result we have found.
Considering the abnormal grain growth under higher temperature (above 1473 K), the obtained value of n independent of temperature, should contain two parts: a normal growth exponent and an abnormal growth exponent. We conducted both normalizing and annealing at the same heating rate, peak temperature, and holding time, and this means that it can be assumed that the normal growth exponent is the same value for both normalizing and annealing. Changes in n are only caused by abnormal growth. As reported in previous literature studies,Reference Atkinson39,Reference Gil, Manero and Planell40 the decrease in n indicates the increase in the grain size, and n as 2 is always applied when the initial grain size is very small. Using the assumption of the initial grain size and temperature mentioned above, the final grain size at other peak temperatures increased, and thus the resulting n was higher than 2. The changes in n indicate the austenite grain growth behavior in the AFA steel subjected to normalizing and annealing.
V. CONCLUSIONS
The microstructures of the AFA steel subjected to normalizing and annealing were investigated, and a kinetic model based on the consideration of heating history was conducted and used to describe the austenite grain growth behavior of the AFA steel. The following conclusions can be drawn:
(1) The austenite grain size of the AFA steel increases as the temperature increases and abnormal grain growth occurs for both normalizing and annealing at temperatures above 1473 K. Some grain boundaries are cracked due to fast cooling during normalization at 1523 K.
(2) With increasing temperature, larger NbC and NiAl second phases are caused and this can be seen using routine XRD. The matrix of the AFA steel is composed in two phases: Cr–Ni–Fe–C austenite and CrFe7C0.45 phase.
(3) For the AFA steel, a kinetic model based on consideration of the heating history is useful for describing the austenite grain growth dependent on temperature, and this is true even when there is abnormal grain growth.
(4) The heating history must be considered for austenitization treatment even when this is only for a short time. The grain growth exponent obtained is 2.85 and larger for normalizing than 2.42 for annealing.
ACKNOWLEDGMENTS
The grant and financial support by the National Natural Science Foundation of China (Grant No. 51501034), the Natural Science Foundation—Steel and Iron Foundation of Hebei Province (Grant No. E2014501056), and the Fundamental Research Funds for the Central Universities (Grant No. N142303001) are gratefully acknowledged. The authors wish to gratefully acknowledge the help of Dr. Madeleine Strong Cincotta (University of Wollongong, Australia) in the final language editing of this paper.