


Introduction
Three undesirable compounds, raffinose, stachyose and phytin, reduce the digestibility and the economic, environmental and dietary value of soybean seed. Phytin, the salt of phytic acid (myo-inositol hexakisphosphate), is a normal component involved in seed phosphate storage and cation chelation. Due to these chelating properties, phytin is a major inhibitor of both calcium absorption (Heaney et al., Reference Heaney, Weaver and Fitzsimmons1991) and iron absorption (Lynch et al., Reference Lynch, Dassenko, Cook, Juillerat and Hurrell1994) in humans. Seeds or seed milling fractions with low phytic acid content improve the absorption of both minerals in comparison to normal phytate (Heaney et al., Reference Heaney, Weaver and Fitzsimmons1991; Lynch et al., Reference Lynch, Dassenko, Cook, Juillerat and Hurrell1994). Phytin also results in high phytate contents in the manure of chickens and pigs (Sebastian et al., Reference Sebastian, Kerr, Pearlstein, Hitz and Drackley2000; Hitz et al., Reference Hitz, Carlson, Kerr and Sebastian2002) which leads to detrimental environmental effects such as the accumulation of runoff phosphorus in lakes and streams resulting in their subsequent eutrophication (Sharpley et al., Reference Sharpley, Daniel, Sims, Lemunyon, Stevens and Perry2003). In comparison to normal-phytate barley, low-phytate barley has been shown to reduce faecal and urinary total phosphorus by 40% and increase absorbable (digestible) inorganic phosphorus which does not result in environmental damage (Htoo et al., Reference Htoo, Sauer, Zhang, Cervantes, Liao, Araiza, Morales and Torrentera2007).
Raffinose family oligosaccharides (RFO; raffinose, stachyose, verbascose) accumulate during normal soybean seed maturation. Stachyose accumulates concomitantly with the onset of desiccation tolerance during seed maturation, decreases concomitantly with loss of desiccation tolerance during seed hydration leading to germination, and has been proposed to be involved in desiccation tolerance during seed maturation and in cool-temperature stress tolerance during seed hydration and germination (Caffrey et al., Reference Caffrey, Fonseca and Leopold1988; Koster and Leopold, Reference Koster and Leopold1988; Blackman et al., Reference Blackman, Obendorf and Leopold1992; Obendorf 1997; Buitink et al., Reference Buitink, Thomas, Gissot and Leprince2004; Rosnoblet et al., Reference Rosnoblet, Aubry, Leprince, Vu, Rogniaux and Buitink2007; Obendorf et al., Reference Obendorf, Zimmerman, Ortiz, Taylor and Schnebly2008b). Consumption of RFO from mature seed products results in flatulence in humans and non-ruminants as well as reduced digestibility in chickens and pigs (Sebastian et al., Reference Sebastian, Kerr, Pearlstein, Hitz and Drackley2000). Reducing raffinose and stachyose has been shown to increase the metabolizable energy in soybean feed (Sebastian et al., Reference Sebastian, Kerr, Pearlstein, Hitz and Drackley2000) and to reduce flatulence in humans (Suarez et al., Reference Suarez, Springfield, Furne, Lohrmann, Kerr and Levitt1999). Thus raffinose, stachyose and phytin are undesirable in both animal feed and commercial soy products. Because chemical removal of phytin, raffinose and stachyose from seeds is costly and inefficient, the genetic reduction of these three components would increase the economic, dietary and environmental value of soybean seeds (Sebastian et al., Reference Sebastian, Kerr, Pearlstein, Hitz and Drackley2000).
Soybean seeds with low raffinose and low stachyose (LRS phenotype) expressing a mutant stc1 gene conferring reduced raffinose synthase (RFS) activity but normal stachyose synthase (STS) and galactinol synthase (GolS) activities (Sebastian et al., Reference Sebastian, Kerr, Pearlstein, Hitz and Drackley2000; Hitz et al., Reference Hitz, Carlson, Kerr and Sebastian2002) (Fig. 1, Table 1) resulted in field emergence and yield comparable to those of seeds with normal raffinose and stachyose (Neus et al., Reference Neus, Fehr and Schnebly2005). LRS seeds expressing the mutant stc1 phenotype had increased accumulation of galactosyl cyclitols (fagopyritols and galactopinitols) (Obendorf et al., Reference Obendorf, Zimmerman, Ortiz, Taylor and Schnebly2008b, Reference Obendorf, Zimmerman, Zhang, Castillo, Kosina, Bryant, Sensenig, Wu and Schnebly2009) and were tolerant to imbibitional chilling (Obendorf et al., Reference Obendorf, Zimmerman, Ortiz, Taylor and Schnebly2008b). Seeds with low raffinose, stachyose and phytin (LRSP phenotype with 50% less phytin than the normal Mips phenotype) expressing a mutant mips gene conferring reduced myo-inositol-phosphate synthase (MIPS) activity (Sebastian et al., Reference Sebastian, Kerr, Pearlstein, Hitz and Drackley2000; Hitz et al., Reference Hitz, Carlson, Kerr and Sebastian2002) (Fig. 1) had decreased field emergence and seed performance, especially when seeds were produced in subtropical environments (Meis et al., Reference Meis, Fehr and Schnebly2003), as well as sensitivity to imbibitional chilling (Obendorf et al., Reference Obendorf, Zimmerman, Ortiz, Taylor and Schnebly2008b). Seeds expressing the mutant mips phenotype (wild-type Mips sequence designation GM mI 1-PS-1A, AY038802; Hitz et al., Reference Hitz, Carlson, Kerr and Sebastian2002) with low stachyose and phytin (LRSP1, LRSP2) accumulated very small amounts of galactosyl cyclitols (galactinol, galactopinitols, fagopyritol B2, fagopyritol B3) (Fig. 1, Table 1; Obendorf et al., Reference Obendorf, Zimmerman, Ortiz, Taylor and Schnebly2008b, Reference Obendorf, Zimmerman, Zhang, Castillo, Kosina, Bryant, Sensenig, Wu and Schnebly2009), but these seeds can accumulate galactinol, raffinose and stachyose after incubation with myo-inositol (Hitz et al., Reference Hitz, Carlson, Kerr and Sebastian2002).
Proposed pathways for synthesis of cyclitols, cyclitol galactosides and RFOs (adapted from Ma et al., Reference Ma, Horbowicz and Obendorf2005). If an enzyme catalysing a reaction has not been identified, it is indicated as ‘(unknown)’. Some reactions may be reversible. The line encircles reactions that typically occur in embryonic tissues of maturing seeds. DP, degree of polymerization; gol, galactinol; GolS, galactinol synthase (EC 2.4.1.123); HK, hexokinase (EC 2.7.1.1); IMP, myo-inositol-phosphate monophosphatase (EC 3.1.3.25); IMT, myo-inositol 4-O-methyltransferase (EC 2.1.1.129); IPK, inositol polyphosphate kinases (including inositol-tetrakisphosphate 1-kinase, EC 2.7.1.134; inositol polyphosphate multikinase, EC 2.7.1.151; inositol pentakisphosphate 2-kinase EC 2.7.1.158); mI 3K, inositol 3-kinase (EC 2.7.1.64); MIPS, myo-inositol-phosphate synthase (EC 5.5.1.4); mips, mutant form of Mips gene (Gm mI 1-PS-1A, AY038802); myo-i, myo-inositol; RFS, raffinose synthase (EC 2.4.1.82); stc1, mutant form of Stc1 gene; STS, stachyose synthase (EC 2.4.1.67); STS?, stachyose synthase or similar enzyme but not confirmed experimentally; UDP, uridine diphosphate; UDP-gal, uridine diphosphate galactoside; UDPG-4′-epimerase, uridine diphosphate galactose 4′-epimerase (EC 5.1.3.2); UDPGPP, uridine diphosphate glucose/galactose pyrophosphorylase (EC 2.7.7.10). For chemical structures, see Obendorf (Reference Obendorf1997).

Seed phenotypes of the soybean lines used

Fortunately, it is thought that increasing fagopyritols and galactopinitols may substitute for the roles of RFO in seeds with low RFO (Chien et al., Reference Chien, Lin, Juo and Her1996; Obendorf, Reference Obendorf1997; Horbowicz et al., Reference Horbowicz, Brenac and Obendorf1998; Obendorf et al., Reference Obendorf, Horbowicz, Dickerman, Brenac and Smith1998). Typically, mature soybean seeds contain about 15 different soluble carbohydrates (55% sucrose, 30% RFO, 10% galactosyl cyclitols, and small amounts of free cyclitols), mostly in the embryonic tissues (cotyledon and axis), comprising 15% of seed dry weight (Obendorf et al., Reference Obendorf, Horbowicz, Dickerman, Brenac and Smith1998, Reference Obendorf, Zimmerman, Ortiz, Taylor and Schnebly2008b, Reference Obendorf, Zimmerman, Zhang, Castillo, Kosina, Bryant, Sensenig, Wu and Schnebly2009). Of the four Mips genes in soybean, Mips1 is highly expressed (particularly in cotyledons; Chappell et al., Reference Chappell, Scaboo, Wu, Nguyen, Pantalone and Bilyeu2006) in immature seeds. Mips2, Mips3 and Mips4 are poorly expressed in immature seeds; by contrast Mips4 is highly expressed in leaves (Hegeman et al., Reference Hegeman, Good and Grabau2001; Hitz et al., Reference Hitz, Carlson, Kerr and Sebastian2002; Chappell et al., Reference Chappell, Scaboo, Wu, Nguyen, Pantalone and Bilyeu2006; Nunes et al., Reference Nunes, Vianna, Cuneo, Amaya-Farfán, de Capdeville, Rech and Aragão2006; Chiera and Grabau, Reference Chiera and Grabau2007). In Arabidopsis, MIPS is localized in the endosperm during seed development (Mitsuhashi et al., Reference Mitsuhashi, Kondo, Nakaune, Ohnishi, Hayashi, Hara-Nishimura, Richardson, Fukaki, Nishimura and Mimura2008). Soybean does not form endospermic seeds. While myo-inositol and phytin synthesis may occur in soybean seed embryos (Fig. 1), there is no evidence for synthesis of d-chiro-inositol, d-ononitol (1d-4-O-methyl-myo-inositol) and d-pinitol (1d-3-O-methyl-chiro-inositol) in embryos (Obendorf et al., Reference Obendorf, Odorcic, Ueda, Coseo and Vassallo2004; Chiera et al., Reference Chiera, Streeter and Finer2006). Transgenic somatic embryos of soybean containing the inositol methyl transferase (IMT) gene from Mesembryanthmum crystallinum led to an increase in d-ononitol, as compared to non-transgenic embryos, and an increase in d-pinitol in maturing embryos (Chiera et al., Reference Chiera, Streeter and Finer2006). myo-Inositol, d-chiro-inositol, and d-pinitol synthesis occur in leaf and perhaps other maternal tissues (Dittrich and Brandl, Reference Dittrich and Brandl1987; Streeter, Reference Streeter2001; Streeter et al., Reference Streeter, Lohnes and Fioritto2001; Gomes et al., Reference Gomes, Obendorf and Horbowicz2005; Ma et al., Reference Ma, Horbowicz and Obendorf2005). In addition to sucrose, these three free cyclitols are transported to the seed and unloaded from the seed coat to the embryo where they are stored as galactosyl cyclitols (galactinol, galactopinitols, fagopyritols) mostly in cotyledon and axis tissues of maturing seeds (Obendorf et al., Reference Obendorf, Horbowicz, Dickerman, Brenac and Smith1998, Reference Obendorf, Zimmerman, Zhang, Castillo, Kosina, Bryant, Sensenig, Wu and Schnebly2009; Gomes et al., Reference Gomes, Obendorf and Horbowicz2005; Kosina et al., Reference Kosina, Castillo, Schnebly and Obendorf2009) (Fig. 1). Galactinol is the galactosyl donor for the synthesis of raffinose, stachyose and verbascose (RFO; galactosides of sucrose) in the cotyledons and axis of maturing seeds (see Fig. 1). About 70% of RFO accumulate in maturing soybean seeds after maximum seed dry weight (Obendorf et al., Reference Obendorf, Zimmerman, Zhang, Castillo, Kosina, Bryant, Sensenig, Wu and Schnebly2009). Accumulation of fagopyritols and galactopinitols follow a similar pattern. Exogenous feeding of free cyclitols to soybean stem–leaf–pod explants would provide a model for the upregulation of d-pinitol and d-chiro-inositol synthesis in maternal tissues with potential to increase accumulation of galactopinitols and fagopyritols in maturing seeds with low raffinose and stachyose or low raffinose, stachyose and phytin.
Measuring soluble carbohydrate accumulation in seed coat cups in planta can be used to study phloem unloading in soybean seed coats (Thorne and Rainbird, Reference Thorne and Rainbird1983; Gomes et al., Reference Gomes, Obendorf and Horbowicz2005; Kosina et al., Reference Kosina, Castillo, Schnebly and Obendorf2009). Kosina et al. (Reference Kosina, Castillo, Schnebly and Obendorf2009) suggested that it may be possible to demonstrate the unloading of maternal or exogenously supplied d-chiro-inositol, and other substrates, from seed coat cups made surgically on soybean stem–leaf–pod explants. Indeed, increasing the supply of d-chiro-inositol to soybean stem–leaf–pod explants increased the accumulation of fagopyritol B1 in mature seeds of LRS, LRSP1, LRSP2 and CHECK (Obendorf et al., Reference Obendorf, Sensenig, Wu, Ohashi, O'Sullivan, Kosina and Schnebly2008a), but seed coat unloading on stem–leaf–pod explants has not been demonstrated. The hypothesis is that using this technique we can show whether or not the free cyclitols fed to stem–leaf–pod explants are unloaded to the developing embryo in lines with modified seed composition, an important step if they are to be converted to galactosyl cyclitols in the embryo. The objectives were to determine whether free cyclitols fed to stem–leaf–pod explants would unload from the seed coats of soybean seeds expressing the mutant stc1 phenotype with low raffinose and stachyose (LRS), seeds expressing the mutant mips phenotype with low raffinose, stachyose and phytin (LRSP1, LRSP2), and seeds expressing the normal Stc1 and Mips phenotype with normal raffinose, stachyose and phytin (CHECK). Maternal and embryonic tissues also were analysed to determine whether cyclitols were being stored, transported to and unloaded by the seed coat, and taken up by the embryo. Here we describe the successful seed coat unloading of d-chiro-inositol in stem–leaf–pod explants. Accumulation of fed d-chiro-inositol also was observed in maternal tissues, including leaf and pod wall.
Materials and methods
Plant materials
Seeds for each of four proprietary soybean [Glycine max (L.) Merrill] lines with low raffinose and stachyose (LRS) seeds expressing the mutant stc1 phenotype; low raffinose, stachyose and phytin (LRSP1, LRSP2) seeds expressing the mutant mips phenotype (wild-type Mips sequence designation GM mI 1-PS-1A, AY038802; Hitz et al., Reference Hitz, Carlson, Kerr and Sebastian2002); and normal raffinose, stachyose and phytin (CHECK) seeds expressing the normal Stc1 and Mips phenotype were provided by Steve Schnebly, Pioneer Hi-Bred, in November 2003. All were advanced breeding lines in related, but not isogenic, Group II maturity agronomic backgrounds developed by traditional breeding. The stc1 and mips alleles in the breeding lines utilized in this study were described by Sebastian et al. (Reference Sebastian, Kerr, Pearlstein, Hitz and Drackley2000), Hitz et al. (Reference Hitz, Carlson, Kerr and Sebastian2002) and Meis et al. (Reference Meis, Fehr and Schnebly2003). To accommodate a series of experiments, five replicate plants of each of four lines were seeded weekly in 4-litre pots after inoculation with Bradyrhizobium japonicum and watered daily as needed. Blocks of 20 plants were moved weekly and rotated. Plants from the first or second generation of greenhouse-grown seed were grown in a climate-controlled greenhouse at 21°C for 10-h nights and at 27°C for 14-h days supplemented with 640 μmol m− 2 s− 1 incandescent light from Sylvania metal halide (1000 watt BU) lamps.
Substrates, reagents, standards
Fructose, glucose, maltose, sucrose, raffinose, stachyose, myo-inositol, galactinol, l-asparagine, phenyl α-d-glucoside, trimethylsilylimidazole and pyridine were purchased from Sigma-Aldrich (St. Louis, Missouri, USA). Verbascose was purchased from Megazyme International Ireland Ltd. (Wicklow, Ireland). d-Pinitol, d-ononitol and d-chiro-inositol were purchased from Industrial Research Limited (Lower Hutt, New Zealand). Fagopyritols, digalactosyl myo-inositol (DGMI) and trigalactosyl myo-inositol (TGMI) were purified from buckwheat (Fagopyrum esculentum Moench) bran. Galactopinitols were purified from hairy vetch (Vicia villosa L.) or chickpea (Cicer arietinum L.) seeds.
Explant treatments
Soybean stem–leaf–pod explants with one internode, one leaf and one pod with three immature seeds (280–300 mg fresh weight each; about 35 d after pollination; at mid-seed fill before accumulation of RFO, fagopyritols and galactopinitols) were prepared for feeding and unloading analysis as described by Gomes et al. (Reference Gomes, Obendorf and Horbowicz2005). Six replicate explants of each line were used. The cut, basal end of the internode (stem) of each explant was placed in a 125-ml Erlenmeyer flask (one explant per flask) containing 100 ml of one of four solutions: 10 mM myo-inositol, 10 mM d-pinitol, 10 mM d-chiro-inositol or a control solution without cyclitols. All solutions contained 10 mM sucrose, 10 mM asparagine and 10 μM kinetin. Water potential of the solutions was not determined. Each solution was loaded into an explant through the cut stem and transported to the leaf by the transpiration stream and to the seed coat through the phloem (Fig. 2). Previous feeding experiments used 50 mM solutions for accumulation of soluble carbohydrates into embryo and seed coat tissues (Gomes et al., Reference Gomes, Obendorf and Horbowicz2005); 10 mM was used in the current study for both unloading and accumulation into seed parts and leaf and pod tissues as this is closer to physiological contents. Seed coat cup unloading analysis was performed on the middle seed using the surgical method of removing the distal half of the seed coat and the entire embryo from the intact seed coat cup (Fig. 2) as described by Thorne and Rainbird (Reference Thorne and Rainbird1983), Ellis and Spanswick (Reference Ellis and Spanswick1987), Gomes et al. (Reference Gomes, Obendorf and Horbowicz2005) and Kosina et al. (Reference Kosina, Castillo, Schnebly and Obendorf2009). Because buffer, salts and mannitol (Thorne and Rainbird, Reference Thorne and Rainbird1983) interfere with cyclitol analysis, unloaded compounds were collected in water. Empty seed coat cups were rinsed two times with distilled water to remove residues or cotyledon fragments (Ellis and Spanswick, Reference Ellis and Spanswick1987). The seed coat cup was filled with 200 μl double distilled water (ddH2O) and four 200-μl samples were collected at 30-min intervals for 2 h (cups refilled after each sampling). After collection of seed coat cup exudates on separate explants at 0, 1, 2, 3, 4 and 5 d of feeding for each solution, pods were removed for collection of the proximal immature seed parts, including seed coat, axis and cotyledon, and a pod wall section for analysis of soluble carbohydrates. The distal immature seed parts and duplicate pod wall sample were used to estimate dry weight fraction of tissues after drying at 95°C for 48 h. Three 1-cm2 leaf punches were harvested at 0, 1, 2, 3, 4 and 5 d of feeding for each explant. Leaf punches were immediately frozen at − 80°C until extracted for analysis.
Diagram of the soybean explant system. Explants were prepared from plants at growth stage R5 by cutting at the base of the internode (stem) above and below the selected node. Each explant had one internode (stem), one node, one leaf and one pod containing three immature seeds at mid-seed fill and before the accumulation of RFO, fagopyritols and galactopinitols. The cut, basal end of the internode (stem) of each explant was placed in a 125-ml flask (one explant per flask) containing 100 ml of cyclitol solution or a control solution without cyclitols. Each solution was loaded into an explant through the cut stem and transported to the leaf by the transpiration stream and to the seed coat through the phloem. Seed coat cup unloading analysis was performed on the middle seed using the surgical method of removing the distal half of the seed coat and the entire embryo from the intact seed coat cup (Thorne and Rainbird, Reference Thorne and Rainbird1983; Ellis and Spanswick, Reference Ellis and Spanswick1987; Gomes et al., Reference Gomes, Obendorf and Horbowicz2005; Kosina et al., Reference Kosina, Castillo, Schnebly and Obendorf2009). Soluble carbohydrates were collected in water in the seed coat cup, dried, derivatized and analysed by gas chromatography. (See online for a colour version for this figure.)

Sample preparation
Frozen leaf punches and seed parts were ground to a fine powder in liquid nitrogen and homogenized in ethanol:water (1:1, v/v) to extract carbohydrates and terminate potential reactions affecting carbohydrate composition. Phenyl-α-d-glucoside was added as an internal standard for carbohydrate quantification. Homogenates were centrifuged at 15,000 × g, and supernatants were filtered through 10,000 MW cut-off filters (Nanosep 10K Omega, Pall Corporation, East Hills, New York, USA) by centrifugation at 15,000 × g. Filtrate was dried under nitrogen gas and stored overnight over P2O5 to remove traces of water. Seed coat cup exudates were added to ethanol (1:1, v/v) and a known amount of internal standard (phenyl-α-d-glucoside). Exudate samples were dried as described for tissue extracts. Dry residues were derivatized with trimethylsilylimidazole:pyridine (1:1, v/v) at 85°C for 45 min.
Sample analysis
Derivatized samples were analysed by gas chromatography (GC) as described by Horbowicz and Obendorf (Reference Horbowicz and Obendorf1994) with minor changes (Gomes et al., Reference Gomes, Obendorf and Horbowicz2005) using a Hewlett-Packard 6890 GC (Agilent Technologies, Palo Alto, California, USA) equipped with a flame ionization detector, split-mode injector (1:50), and a HP-1MS capillary column (15 m × 0.25 mm i.d., 0.25 μm film thickness). Oven temperature was programmed to an initial temperature of 150°C, adjusted to 200°C at 3°C min− 1, adjusted to 325°C at 7°C min− 1, and held at 325°C for 20 min. The injection port was operated at 335°C and the detector at 350°C. The carrier gas was nitrogen at 2.5 ml min− 1. Amounts below the level of detection were presented as zero.
Statistical analysis
Seed coat cup unloading responses were analysed by analysis of variance with day of feeding (n = 5), substrate fed (n = 4), lines (n = 4) and sampling time (n = 4) as independent variables and individual unloaded soluble carbohydrates as the dependent variables. Statistical analysis was performed after a square root transformation of the responses to correct for non-constant residual variance. Significant differences (P < 0.05) were assigned after a Tukey correction for multiple comparisons or Student's t-test using JMP Statistical Discovery Software, SAS Institute Inc. (Cary, North Carolina, USA). No significant differences among responses are shown by the same letter. Seed coat cup unloading rates are reported as μg h− 1. Soluble carbohydrates in leaf tissues are reported as μg cm− 2 leaf area, and soluble carbohydrates in seed parts and pod wall are reported as μg (g dry weight)− 1.
Results
Seed coat cup unloading
Compounds unloaded by seed coat cups on soybean explants included sucrose and the free cyclitols d-chiro-inositol, myo-inositol and d-pinitol (Fig. 3). The reducing sugars glucose, fructose and maltose were detected in variable but small amounts (data not shown). Raffinose family oligosaccharides (raffinose, stachyose, verbascose), galactosyl cyclitols (galactinol, galactopinitols, fagopyritols) and d-ononitol were not present in seed coat cup exudates or were below the level of detection. Seed coat cup unloading rates for d-chiro-inositol, myo-inositol, d-pinitol and sucrose were 9.1, 3.9, 17.6 and 176.8 μg h− 1, respectively, when averaged across treatments and sampling periods. There was no significant line × unloading time interaction or substrate × unloading time interaction. Unloading rates are shown as a function of main effects of feeding treatments as a function of day of feeding (Fig. 3A–D) or pooled over days 1–5 of substrate feeding (Fig. 3E–P). After feeding solutions containing d-chiro-inositol, the d-chiro-inositol unloading rate increased from day 0 to day 5 (Fig. 3A). After feeding solutions containing myo-inositol, the myo-inositol unloading rate increased from day 0 to day 4 (Fig. 3B). After feeding solutions containing d-pinitol, the d-pinitol unloading rate was variable and significantly higher only on day 3 compared to day 0 (Fig. 3C). As expected, unloading rates for d-chiro-inositol, myo-inositol and d-pinitol, respectively, were highest after feeding explants solutions containing d-chiro-inositol, myo-inositol and d-pinitol (Fig. 3E–G). This observation confirms the primary objective and demonstrates that free cyclitols fed to stem–leaf–pod explants are unloaded from the seed coats of soybean seeds. The sucrose unloading rate was not significantly different among feeding treatments because all feeding solutions contained sucrose (Fig. 3H). The d-chiro-inositol unloading rates were similar among the four soybean lines after feeding a solution containing d-chiro-inositol, and all were significantly higher than the control solution without d-chiro-inositol (Fig. 3I), confirming that an increase in unloading of d-chiro-inositol from seed coat cups on explants of all four lines can be measured experimentally.
Seed coat unloading. Explant seed coat cup unloading rates for d-chiro-inositol after feeding d-chiro-inositol (A, E, I, M), myo-inositol after feeding myo-inositol (B, F, J, N), d-pinitol after feeding d-pinitol (C, G, K, O), and sucrose after feeding a control solution without cyclitols (D, H, L, P) as a function of days of feeding (0–5) with pooled lines and unloading times (A–D); substrate feeding treatment [d-chiro-inositol (chiro), myo-inositol (myo), d-pinitol (pin), or control solution (cont)] with pooled lines and unloading times (E–H); line (LRS, LRSP1, LRSP2 and CHECK) with pooled unloading times and days 1–5 (I–L); and unloading time (0–30, 30–60, 60–90 and 90–120 min) with pooled lines and days (1–5) of feeding (M–P). Responses were pooled for days 1–5 (E–P). Bars not connected by the same letter are significantly different (P < 0.05) after a Tukey correction for multiple comparisons. In graphs I, J and K, an asterix (*) means the value after feeding cyclitols (solid bars) was significantly different (P < 0.05) compared to feeding a control solution without cyclitols (open bars) for each line.

myo-Inositol unloading rates were significantly higher for the LRS, LRSP1 and CHECK lines than the control solution without myo-inositol (Fig. 3J). Of interest, feeding myo-inositol to LRS and CHECK explants significantly (P < 0.05, Student's t-test) increased d-chiro-inositol unloading rate (3.90 ± 0.49 μg h− 1), a 44% increase compared to feeding a control solution for days 1–4 without cyclitols (2.71 ± 0.43 μg h− 1) when LRSP1 and LRSP2 were excluded from the analysis (not shown in Fig. 3).
The d-pinitol unloading rates for LRSP1, LRSP2 and CHECK lines were significantly higher than for LRS, but only the CHECK line was higher than the control solution without d-pinitol (Fig. 3K). Sucrose unloading rates from seed coats on explants were not significantly different among lines (Fig. 3L) and were similar to sucrose unloading rates in planta (0.5–1 μmole h− 1) (Thorne and Rainbird, Reference Thorne and Rainbird1983; Gomes et al., Reference Gomes, Obendorf and Horbowicz2005; Kosina et al., Reference Kosina, Castillo, Schnebly and Obendorf2009). Rates of unloading decreased during the four sequential 30-min sampling periods when fed d-chiro-inositol (Fig. 3M), myo-inositol (Fig. 3N), d-pinitol (Fig. 3O) or a control solution with sucrose but without cyclitols (Fig. 3P).
Explant leaf composition
Compared to day 0, d-chiro-inositol (days 1–5), myo-inositol (days 2, 3) and d-pinitol (days 2, 4, 5) increased in leaves of explants fed solutions containing d-chiro-inositol, myo-inositol and d-pinitol, respectively (Fig. 4A–C), demonstrating the uptake of these substrates by explants. Sucrose accumulation at days 1–5 was not significantly different from day 0 (Fig. 4D). LRS and LRSP2 leaf tissues had significantly more d-chiro-inositol than LRSP1 and CHECK leaf tissues after feeding solutions containing d-chiro-inositol (Fig. 4E). After feeding solutions containing d-chiro-inositol, leaf tissues of all lines had higher contents of d-chiro-inositol, as compared to feeding control solutions without d-chiro-inositol (Fig. 4E).
Leaf soluble carbohydrates. Leaf disc (three times 1 cm− 2) contents (μg cm− 2 leaf area) of d-chiro-inositol after feeding d-chiro-inositol (A, E) to explants, myo-inositol after feeding myo-inositol (B, F) to explants, d-pinitol after feeding d-pinitol (C, G) to explants, and sucrose after feeding a control solution without cyclitols (D, H) to explants as a function of days (0–5) of feeding (A–H) or as a function of line [LRS, LRSP1 (P1), LRSP2 (P2) and CHECK (CK)] (E–H) (days 1–5 pooled). Solid bars represent the cyclitol feeding treatment and open bars represent the control feeding treatment without cyclitols. Bars not connected by the same letter are significantly different (P < 0.05) after a Tukey correction for multiple comparisons. In graphs E, F, and G, an asterix (*) means the value after feeding cyclitols (solid bars) was significantly different (P < 0.05) compared to feeding a control solution without cyclitols (open bars) for each line.

After feeding solutions containing myo-inositol, the myo-inositol contents in leaf tissues of LRS and LRSP2 were higher than after feeding control solutions without myo-inositol (Fig. 4F). Leaf tissues of LRS and LRSP2 also accumulated higher contents of myo-inositol than leaf tissues of CHECK (Fig. 4F). Interestingly, feeding myo-inositol to LRS explants doubled d-chiro-inositol in leaf tissues compared to feeding a control solution without myo-inositol (Fig. 5A), consistent with the unloading rates described above and evidence for the conversion of myo-inositol to d-chiro-inositol in LRS soybean explants. Feeding a 10 mM myo-inositol solution to explants for 1–5 d did not increase d-chiro-inositol in pod wall (Fig. 5B), seed coat (Fig. 5C) or cotyledon (Fig. 5D) in any line at this immature seed stage. Previous results, after feeding a 50 mM myo-inositol solution to explants of an agronomic soybean cultivar (expressing the normal Stc1 and normal Mips seed phenotype) for 7 d, followed by 14 d of slow drying of seeds in pods attached to explants, demonstrated a significant increase, compared to feeding a control solution without cyclitols, of d-chiro-inositol in seed coats after 2 d of slow drying, of d-chiro-inositol in cotyledons after 2 and 4 d of slow drying, and of fagopyritol B1 in cotyledons and axes of mature, dry seeds (Gomes et al., Reference Gomes, Obendorf and Horbowicz2005).
myo-Inositol conversion. d-chiro-Inositol contents in leaf blade (μg cm− 2 leaf area) (A), pod wall (mg g− 1 dry weight) (B), seed coat (mg g− 1 dry weight) (C) and cotyledon (mg g− 1 dry weight) (D) tissues after feeding myo-inositol (solid bars) or a control solution without cyclitols (open bars) to explants for 1–5 d as a function of line [LRS, LRSP1 (P1), LRSP2 (P2) and CHECK (CK)]. Bars not connected by the same letter are significantly different (P < 0.05) after a Tukey correction for multiple comparisons. In graph A, an asterix (*) means the value for d-chiro-inositol after feeding myo-inositol (solid bars) was significantly different (P < 0.05) compared to feeding a control solution without cyclitols (open bar) for LRS.

After feeding solutions containing d-pinitol, only leaf tissues of LRS accumulated significantly more d-pinitol than after feeding control solutions without d-pinitol (Fig. 4G). Contents of d-pinitol were initially high in leaf samples from all soybean lines, resulting in fewer significant increases after feeding solutions containing 10 mM d-pinitol to explants.
Leaf sucrose contents were not significantly different among lines after feeding control solutions containing sucrose but without cyclitols (Fig. 4H). This response was expected since all solutions contained 10 mM sucrose.
Pod wall composition
d-chiro-Inositol contents of pod wall tissues of LRS, LRSP2 and CHECK lines were significantly higher after feeding solutions containing d-chiro-inositol to explants compared to control solutions without cyclitols (Fig. 6A). Only LRS pod wall tissues had significantly higher myo-inositol content after feeding myo-inositol to explants compared to feeding a control solution without cyclitols (Fig. 6B). d-Pinitol contents were variable in pod wall tissues and not significantly different between lines or between feeding d-pinitol or a solution without cyclitols (Fig. 6C). Pod wall sucrose contents were small and not different between lines (Fig. 6D).
Pod and immature seed soluble carbohydrates. Pod wall (A–D), seed coat (E–H), cotyledon (I–L) and axis (M–P) contents (mg g− 1 dry weight) of d-chiro-inositol after feeding d-chiro-inositol (A, E, I, M) to explants for 1–5 d, myo-inositol after feeding myo-inositol (B, F, J, N) to explants for 1–5 d, d-pinitol after feeding d-pinitol (C, G, K, O) to explants for 1–5 d, and sucrose after feeding a control solution without cyclitols (D, H, L, P) to explants for 1–5 d as a function of line [LRS, LRSP1 (P1), LRSP2 (P2) and CHECK (CK)]. Solid bars represent the cyclitol feeding treatment and open bars represent the control feeding treatment without cyclitols. Bars not connected by the same letter are significantly different (P < 0.05) after a Tukey correction for multiple comparisons. In graphs A, B and F, an asterix (*) means the value after feeding cyclitols (solid bars) was significantly different (P < 0.05) compared to feeding a control solution without cyclitols (open bars) for each line.

Seed coat composition
d-chiro-Inositol contents in the seed coat were variable and not significantly different between lines or feeding treatments (Fig. 6E). Only CHECK seed coats had a significantly higher level of myo-inositol after feeding solutions containing myo-inositol than feeding a control solution without myo-inositol (Fig. 6F). Seed coat d-pinitol content was not significantly higher after explants were fed d-pinitol than a control solution without d-pinitol and lines were not significantly different (Fig. 6G). Seed coat sucrose content was not different among lines (Fig. 6H).
Cotyledon and axis composition
d-chiro-Inositol, myo-inositol and d-pinitol contents in cotyledon tissues of the proximal seed were not significantly higher after feeding d-chiro-inositol, myo-inositol or d-pinitol, respectively, to explants compared to feeding a control solution without cyclitols (Fig. 6I, J and K). myo-Inositol was significantly lower in LRSP2 cotyledons expressing the mutant mips phenotype than in CHECK cotyledons expressing the normal Mips phenotype (Fig. 6J). Sucrose contents in cotyledon tissues were not different among lines (Fig. 6L). Axis d-chiro-inositol, myo-inositol, d-pinitol and sucrose contents were variable, perhaps due to the small sample weights (1–2 mg dry weight per axis), with few significant differences between lines or feeding treatments (Fig. 6M–P). The absence of significant increases of cyclitols in cotyledons of the immature proximal seed was not a surprise. Immature seeds at about 35 d after flowering (mid-seed filling) were used in the explants that were fed for 0 to 5 d when the immature proximal seed tissues were harvested for analysis. This stage of seed development is before the accumulation of raffinose family oligosaccharides, fagopyritols and galactopinitols (Obendorf et al., Reference Obendorf, Zimmerman, Zhang, Castillo, Kosina, Bryant, Sensenig, Wu and Schnebly2009). When explants were fed a d-chiro-inositol solution for 7 d followed by 2 weeks of slow drying of seeds in the pod, the mature dry seeds of all four lines accumulated significantly more fagopyritols, compared to the control, in cotyledons of mature dry seeds (Obendorf et al., Reference Obendorf, Sensenig, Wu, Ohashi, O'Sullivan, Kosina and Schnebly2008a), and demonstrated a significantly higher accumulation of total d-chiro-inositol compared to the control without cyclitols. Two vascular bundles feed the soybean pod along the dorsal edge where seeds are attached to the placenta by the funiculus. Branches from one dorsal pod phloem bundle feed seeds one (proximal position) and three (distal position). The other dorsal pod phloem bundle feeds seed two (middle position) in a three-seeded pod (see Thorne, Reference Thorne1980, Reference Thorne1981). The middle seed was used for collection of soluble carbohydrates from the seed coat cup. It is expected that the proximal and distal seeds fed by one dorsal pod vascular bundle may receive lesser amounts of cyclitols to each seed (and therefore it is likely to be more difficult to detect a significant increase, especially with short feeding times) than the single seed, in the middle position of a three-seeded pod, fed by the second vascular bundle.
Discussion
Unloading of fed d-chiro-inositol, myo-inositol, d-pinitol and sucrose from seed coat cups attached to soybean stem–leaf–pod explants has been demonstrated for the first time. Free d-chiro-inositol fed to soybean stem–leaf–pod explants accumulated in leaf tissues, and were unloaded by the seed coat (Table 2). A portion of the d-chiro-inositol accumulated in pod wall tissues of LRS, LRSP2 and CHECK explants. Free myo-inositol fed to soybean stem–leaf–pod explants was unloaded by the seed coat in LRS, LRSP1 and CHECK explants. Some was accumulated in the leaf of LRS and LRSP2 explants and in the pod wall of LRS explants (Table 2). Exogenous feeding of d-pinitol resulted in significant increases in d-pinitol, compared to feeding a control solution, in the leaf of LRS explants and seed coat unloading of CHECK explants (Table 2). Sucrose unloading rates by explant seed coat cups were similar to the in planta unloading rates reported for seed coat cups on intact plants of the same soybean lines (Kosina et al., Reference Kosina, Castillo, Schnebly and Obendorf2009). Feeding solutions containing d-chiro-inositol, myo-inositol or d-pinitol, respectively, to soybean stem–leaf–pod explants increased the d-chiro-inositol, myo-inositol or d-pinitol unloaded from explant seed coat cups in four, three and one, respectively, of the lines. Unloading rates for d-chiro-inositol, myo-inositol and d-pinitol were maximal after 5, 4 and 3 d, respectively, of feeding explants solutions containing d-chiro-inositol, myo-inositol or d-pinitol.
Summary of significant increases in contents of d-chiro-inositol in the different tissues after feeding a d-chiro-inositol solution, of myo-inositol after feeding a myo-inositol solution, and of d-pinitol after feeding a d-pinitol solution to LRS, LRSP1, LRSP2 and CHECK explants, compared to feeding a control solution without cyclitols. The seed coat cup unloading (Fig. 3), leaf blade (Fig. 4), pod wall (Fig. 6) and seed coat (Fig. 6) values were significantly higher than values after feeding a control solution without cyclitols
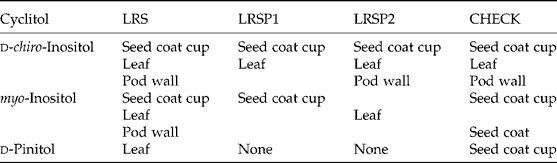
Contents of d-chiro-inositol in maternal and embryo tissues of explants were initially low for all lines. Therefore, the impact of feeding d-chiro-inositol to stem–leaf–pod explants was a large increase in d-chiro-inositol in maternal tissues (leaf, pod, seed coat) and in seed coat exudates. By contrast, contents of d-pinitol in maternal and embryo tissues of explants were initially high in all lines. Therefore, the relative increase, although significant, in free d-pinitol was less striking in maternal tissues and seed coat exudates after feeding free d-pinitol to explants, and d-pinitol contents in embryo tissues of the immature seed were not significantly increased. In the control feeding treatment without cyclitols, the unloading rate for d-pinitol was fivefold greater than for d-chiro-inositol and myo-inositol (Fig. 3E, F and G) reflecting the large pool of d-pinitol in maternal tissues.
Contents of myo-inositol in maternal tissues of explants were also initially low and not significantly different among lines. Therefore, the impact of feeding myo-inositol to stem–leaf–pod explants was a significant increase in myo-inositol in leaf (LRS, LRSP2), pod (LRS), seed coat (CHECK) and in seed coat exudates (LRS, LRSP1, CHECK) (Table 2). Feeding myo-inositol to stem–leaf–pod explants increased d-chiro-inositol in LRS leaf blade tissues and d-chiro-inositol feeding increased d-chiro-inositol unloading by seed coat cups. These results suggest the increased myo-inositol in LRS leaves is converted to d-chiro-inositol that is subsequently unloaded by seed coats to immature embryos where it may increase fagopyritol synthesis during seed maturation. Feeding a 10 mM d-chiro-inositol solution to LRS, LRSP1, LRSP2 and CHECK explants increased fagopyritol B1 accumulation and total d-chiro-inositol accumulation in mature, dry seeds of all four lines (Obendorf et al., Reference Obendorf, Sensenig, Wu, Ohashi, O'Sullivan, Kosina and Schnebly2008a).
The mutant mips phenotype (low raffinose, low stachyose, and 50% of normal phytin as well as low myo-inositol and low galactinol) (Sebastian et al., Reference Sebastian, Kerr, Pearlstein, Hitz and Drackley2000; Hitz et al., Reference Hitz, Carlson, Kerr and Sebastian2002) results in reduced field emergence (Meis et al., Reference Meis, Fehr and Schnebly2003) whereas the LRSP1 and LRSP2 specifically are sensitive to imbibitional chilling (Obendorf et al., Reference Obendorf, Zimmerman, Ortiz, Taylor and Schnebly2008b). The mutant stc1 phenotype (low raffinose and stachyose) seeds which exhibit normal field emergence (Neus et al., Reference Neus, Fehr and Schnebly2005) and tolerance to imbibitional chilling (Obendorf et al., Reference Obendorf, Zimmerman, Ortiz, Taylor and Schnebly2008b) are known to accumulate higher galactinol and higher di- and tri-α-galactosides of myo-inositol, d-pinitol and d-chiro-inositol compared to LRSP1 and LRSP2 seeds (Obendorf et al., Reference Obendorf, Zimmerman, Ortiz, Taylor and Schnebly2008b, Reference Obendorf, Zimmerman, Zhang, Castillo, Kosina, Bryant, Sensenig, Wu and Schnebly2009). Collectively, these results provide evidence for a potential role of galactosyl cyclitols in the improvement of field performance. The successful seed coat cup unloading of fed cyclitols indicates that upregulation of their synthesis in maternal tissues may be a mechanism of getting more of the desirable cyclitols to embryos expressing the mutant mips phenotype (low stachyose and low phytin in mature seed). This has the potential of increasing accumulation of fagopyritols or other galactosyl cyclitols (Fig. 1) and, thereby, improving seed performance in the field.
Since myo-inositol contents are normal in all maternal tissues of all lines, upregulating the conversion of myo-inositol to d-pinitol and d-chiro-inositol in maternal tissues would increase maternal d-pinitol and d-chiro-inositol for transport to the embryos of maturing seeds where they accumulate as galactopinitols and fagopyritols. Endogenous maternal increases in d-chiro-inositol should be functionally similar to in vitro feeding of d-chiro-inositol to explants. LRS seeds expressing the mutant stc1 phenotype with reduced RFS activity but fully functional STS and GolS activities (Table 1) should be able to respond to endogenously increased d-pinitol and d-chiro-inositol with an accumulation of both galactopinitols and fagopyritols in maturing seeds (Fig. 1). If more d-pinitol and d-chiro-inositol are unloaded to the embryo, accumulation in the LRS embryo as their respective galactosyl cyclitols should increase during seed maturation and desiccation. In LRSP1 and LRSP2 seeds expressing the mutant mips phenotype with reduced MIPS activity and very low myo-inositol and galactinol contents in the seed, increasing the supply of d-pinitol would not be an effective means of increasing galactopinitols due to limiting galactinol contents, but increasing the supply of d-chiro-inositol would be an effective means of increasing fagopyritol B1. Indeed, feeding d-chiro-inositol to soybean stem–leaf–pod explants increased the accumulation of fagopyritol B1 in mature LRS seeds expressing the mutant stc1 phenotype, LRSP1 and LRSP2 seeds expressing the mutant mips phenotype, and CHECK seeds expressing the normal Stc1 and Mips phenotype (Obendorf et al., Reference Obendorf, Sensenig, Wu, Ohashi, O'Sullivan, Kosina and Schnebly2008a), and also in other cultivars (Gomes et al., Reference Gomes, Obendorf and Horbowicz2005) and species (Lahuta et al., Reference Lahuta, Górecki and Horbowicz2005; Ma et al., Reference Ma, Horbowicz and Obendorf2005).
Evidently, upregulating myo-inositol would also increase phytin (Loewus and Murthy, Reference Loewus and Murthy2000) so the goal therefore would be to upregulate the maternal conversion of myo-inositol to d-chiro-inositol which is unloaded by seed coats when fed to explants. The enzyme(s) catalysing the conversion of myo-inositol to d-chiro-inositol in soybean has not been isolated, but it may be active in leaves or other maternal tissues since there was an increase of d-chiro-inositol unloading in response to myo-inositol feeding of LRS soybean explants (Fig. 5A) and normal soybean plants (Gomes et al., Reference Gomes, Obendorf and Horbowicz2005). In buckwheat explants, myo-inositol feeding significantly increased d-chiro-inositol in leaves and embryos, and increased accumulation of all six fagopyritols in mature buckwheat seeds (Ma et al., Reference Ma, Horbowicz and Obendorf2005). Only the fagopyritol B series of fagopyritols (fagopyritol B1, fagopyritol B2, fagopyritol B3) accumulate during soybean seed maturation (Obendorf et al., Reference Obendorf, Horbowicz, Dickerman, Brenac and Smith1998, Reference Obendorf, Sensenig, Wu, Ohashi, O'Sullivan, Kosina and Schnebly2008a, Reference Obendorf, Zimmerman, Ortiz, Taylor and Schneblyb, Reference Obendorf, Zimmerman, Zhang, Castillo, Kosina, Bryant, Sensenig, Wu and Schnebly2009). Soybean galactinol synthase forms fagopyritol B1 (Obendorf et al., Reference Obendorf, Odorcic, Ueda, Coseo and Vassallo2004; see Fig. 1), and the galactinol synthase enzyme is active in maturing seeds of all four lines (Table 1). Feeding 10 mM d-chiro-inositol to soybean explants increased fagopyritol B1 in cotyledons of mature seeds from LRS, LRSP1, LRSP2 and CHECK lines (Obendorf et al., Reference Obendorf, Sensenig, Wu, Ohashi, O'Sullivan, Kosina and Schnebly2008a).
We conclude that upregulation of d-chiro-inositol synthesis in leaf or other maternal tissues may be effective for increasing unloaded d-chiro-inositol to embryos and increasing the accumulation of fagopyritols during seed maturation in LRS seeds expressing the mutant stc1 phenotype and LRSP1 or LRSP2 seeds expressing the mutant mips phenotype. Analysis of seed coat cup exudates can be used to verify upregulation of maternally synthesized d-chiro-inositol that is transported to the seed and is unloaded from the seed coat to the soybean embryo where it may be stored as an increased accumulation of fagopyritols during seed maturation and desiccation.
Acknowledgements
This research was conducted as part of Multistate Projects W-1168 and W-2168 (NY-C 125-802; NY-C 125-852) and supported in part by Morley and Hatch-Multistate Undergraduate Research Grants (S.M.K.), a President's Council for Cornell Women Undergraduate Research Grant (S.M.K.), and Cornell University Agricultural Experiment Station federal formula funds received from Cooperative State Research, Education and Extension Service, US Department of Agriculture. Any opinions, findings, conclusions or recommendations expressed in this publication are those of the authors and do not necessarily reflect the view of the US Department of Agriculture. The results were included as part of a Biology Undergraduate Research Honors Thesis (Cornell University, May 2007) by S.M.K. We gratefully acknowledge Angela D. Zimmerman, Bethan A. Lemley, Carly I. Gomes, Elizabeth M. Sensenig, Hanna S. Kubica, Jennifer Wu and Harpartap Singh for assistance with experiments, and Françoise Vermeylen for advice on statistical analysis.



