1. INTRODUCTION
The study of suprathermal electrons produced by laser–plasma instabilities (LPIs) has long been recognized as critical for the development of the inertial confinement fusion (ICF) approach (Fraley and Mason, Reference Fraley and Mason1975; Yaakobi et al., Reference Yaakobi, Pelah and Hoose1976). In both direct-drive ICF (Craxton et al., Reference Craxton, Anderson, Boehly, Goncharov, Harding, Knauer, McCrory, McKenty, Meyerhofer and Myatt2015) and indirect-drive ICF (Lindl, Reference Lindl1995), suprathermal electrons can deposit their energy into the nuclear fuel (preheat), leading to a reduction of pressure at the moment of maximum compression during the target implosion. In the case of shock ignition (Perkins et al., Reference Perkins, Betti, LaFortune and Williams2009), suprathermal electrons in the laser spike may benefit the launching of a second shock or preheat the shell, depending on their energies (Theobald et al., Reference Theobald, Nora, Seka, Lafon, Anderson, Hohenberger, Marshall, Michel, Solodov and Stoeckl2015). In addition, the angular properties of suprathermal electrons determine the fraction absorbed in the fuel or shell. Spectrally and angularly resolved measurements of suprathermal electrons are crucial in laser-driven ICF researches.
Commonly, suprathermal electrons are considered to be accelerated by electron plasma waves (EPWs) (Kruer, Reference Kruer1988), which can be generated by stimulated Raman scattering (SRS) (Estabrook et al., Reference Estabrook, Kruer and Lasinski1980; Riconda and Weber, Reference Riconda and Weber2016), two-plasmon decay (TPD) (Langdon et al., Reference Langdon, Lasinski and Kruer1979), and resonance absorption (RA) (Bezzerides et al., Reference Bezzerides, Gitomer and Forslund1980). In previous experiments, Ebrahim et al. used a 10.6 µm CO2 laser to irradiate the plasma produced by 1.06 µm laser pulse at the electron density of 1/4 critical density of 10.6 µm (Ebrahim et al., Reference Ebrahim, Baldis, Joshi and Benesch1980); the emission of the escaped suprathermal electrons, which were detected by electron spectrometers (ESMs) at various angles, reached the maximum value in the plane of polarization of the CO2 laser and peaked at 45° with respect to the k vector of the CO2 laser beam; TPD was considered to be one of the main contributors. Later, similar experiments (Villeneuve et al., Reference Villeneuve, Keck, Afeyan, Seka and Williams1984) performed with a shorter wavelength (0.35 µm) interaction beam directly irradiating plastic planar targets exhibited considerably weaker directionality; assuming isotropic emission, <10−3 of the incident energy was converted into suprathermal electron energy. In recent experiments, a wide divergence of suprathermal electrons was observed by measuring the radiation emitted by suprathermal electrons on spherical targets (Yaakobi et al., Reference Yaakobi, Solodov, Myatt, Delettrez, Stoeckl and Froula2013).
Thus, accurate measurements of the energy spectrum and angular distribution of suprathermal electrons are necessary for LPI and ignition studies. In previous experiments, the emission properties either were not obtained at the same shot, or they did not cover enough angles at the same time. In our latest experiments, 19 ESMs, the highest number ever employed, were used to measure the emission properties of suprathermal electrons escaping from planar targets simultaneously. A double temperature distribution of the electron energy spectrum was detected, whereas the angular distributions appeared all similar, obeying a Gaussian distribution for targets of different thicknesses; however, the full width at half maximum (FWHM) varied. Besides, the conversion rates of laser energy into escaped suprathermal electron energy for 10-μm-thick Al foil targets were estimated.
2. EXPERIMENTAL SETUP
A schematic drawing of the experimental setup is shown in Figure 1(a). The ninth beam of ShenGuang II facility at the Shanghai Institute of Optics and Fine Mechanics was used at a wavelength of 0.53 µm, which delivered up to ~1000 J in the 2-ns-wide square main pulse with a small prepulse, as shown in Figure 1(b). The laser beam was focused perpendicularly onto the targets with a continuous-phase plate, and the FWHM of the focal spot was 350 µm (f/4.5). The targets were Al foils with thicknesses of 2.0 ± 0.1 and 10.0 ± 0.5 µm. The ESMs were placed at the rear of the targets to measure the suprathermal electrons escaping from the targets in the horizontal and vertical planes; the angular intervals were 10°. Unfortunately, there was an angle of 15° between the plane of polarization and the vertical plane, but the experimental results along the two directions showed only a little differences. The ESMs were made of ferrimagnetic materials and calibrated by an intense-pulsed electron beam (Shen et al., Reference Shen, An, Liu, Remnev, Nashilevskiy, Li, Zhang, Zhong, Cui and Liang2016; Liu et al., Reference Liu, An, Shen, Kang, Zhou, Lei and Lin2017). The Fuji BAR-SR2025 imaging plate (IP) was selected as detector (Tanaka et al., Reference Tanaka, Yabuuchi, Sato, Kodama, Kitagawa, Takahashi, Ikeda, Honda and Okuda2005). Owing to the 6-μm-thick protective layer on the IP, electron energies lower than 20 keV could not be detected. Each position of ESM was collimated by a laser pointer, and their collecting solid angle was set to a value lower than 10−5 sr. In addition, some signal collectors were placed near the ESMs to collect the optical signals.
(a) Schematic diagram of the experimental setup. The gray elements represent the electron spectrometers (ESMs); their sizes are about 106 × 36 × 160 mm and their distances to the target center are about 570 mm; the 19 ESMs can be installed in 22 different positions, depending on the experimental requirements. The yellow elements near the ESM at 0° are optical signal collectors. The green cone represents the 0.53 µm laser pulse. (b) Typical time waveform of the incident pulse and signals from the optical signal collector for 2- and 10-μm-thick Al foil targets.

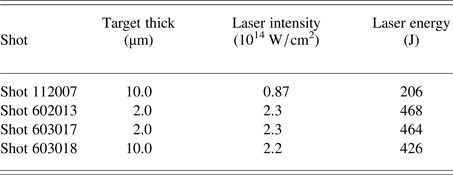
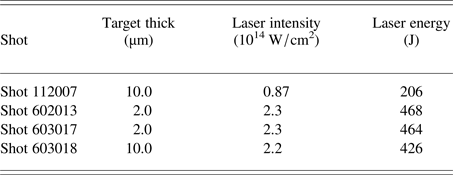
One of optical signal collector next to the 0° ESM with the optical filter was used to record 0.53-μm wavelength signal from targets, which was used to judge whether the target was burned through or not. The typical time waveform of the incident pulse and the signal from the optical signal collector are shown in Figure 1(b). The results indicated that, contrary to the 2-μm-thick Al foil, the 10-μm-thick Al foil target could not be burned through during the main pulse. Details of the different shots used in this work are reported in Table 1.
Shot details
3. EXPERIMENTAL RESULTS
3.1. Suprathermal electron energy spectra
The escaped suprathermal electrons were detected by using ESMs. Typical suprathermal electron spectra for the 10-μm-thick (shot 112007 and shot 603018) and 2-μm-thick (shot 602013) Al foil targets at different angles with respect to the k vector of the incident laser are shown in Figure 2. The results revealed that the spectra obtained from the 10-μm-thick target were more uniform than those observed from the 2-μm-thick target along different directions.
Measured escaping suprathermal electron energy spectra (a–c) for 10-μm-thick Al foil target at different angles along upward, left, and right directions, respectively, and (d–e) for 2- and 10-μm-thick Al foil targets at different angles along left directions of shot 602013 and shot 603018, respectively. (f) Fitted electron temperature of 2- and 10-μm-thick Al foil targets at different angles and directions.

The suprathermal electrons generated by TPD, SRS, and RA are considered to obey a 3D Maxwellian distribution (Villeneuve et al., Reference Villeneuve, Keck, Afeyan, Seka and Williams1984). This distribution function can be expressed as
 $$\displaystyle{{dN} \over {dE}} = 2{\rm \pi} ^{ - 1/2}N_0(kT)^{ - 3/2}E^{1/2}\exp \left( {\displaystyle{{ - E} \over {kT}}} \right),$$
where N 0 is the total number of electrons, kT is the electron temperature, and E is the kinetic energy of a single particle. By plotting ln (E −1/2 dN/dE) versus E and fitting the straight line, the electron temperatures can be obtained, as shown in Figure 2(f). The electron temperature distributions for the 10- and 2-μm-thick Al foil targets were clearly different. For the 10-μm-thick target, the electron temperatures at different angles were all equal to ~40 keV, while for the 2-μm-thick target, the electron temperature decreased as the angle increased. As shown in Figure 2(d), the electron energy spectra of the 2-μm-thick Al foil target exhibited a double temperature distribution, especially at ±30°; the lowest temperatures were below 25 keV.
3.2. Angular distribution of total suprathermal electron energy
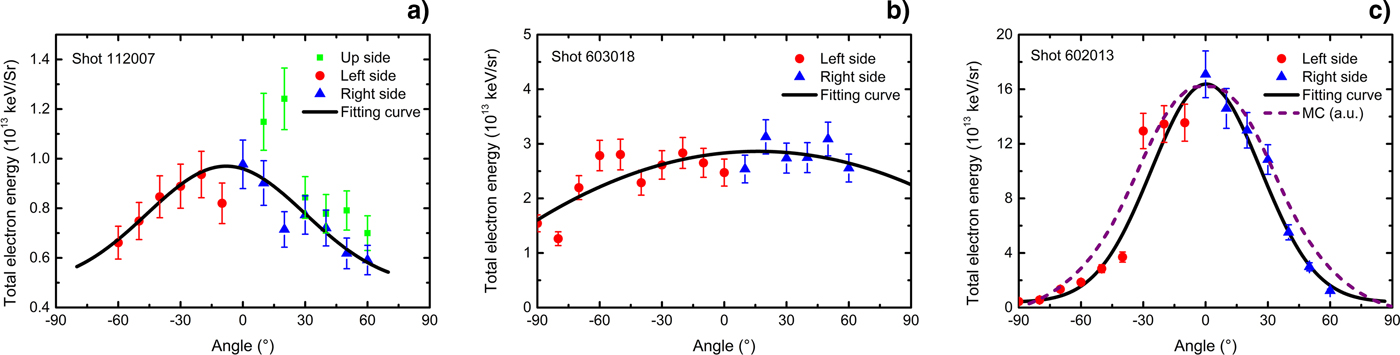
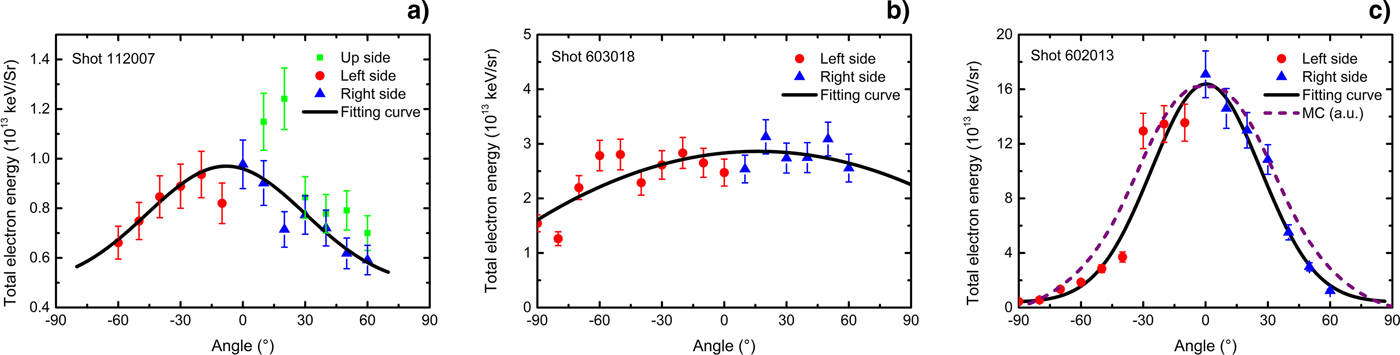
The total energy of escaped electrons in the range of 50–400 keV at different angles was calculated (Fig. 3). The result for shot 112007 in Figure 3(a) shows that there was little difference in integrated energy values obtained at the same angle but in different directions. Clearly, the angular distribution observed for the 10-μm-thick target [Figs 3(a) and (b)] was flatter than that of the 2-μm-thick target [Fig. 3(c)]; the FWHM of the energy curve observed for the 2-μm-thick Al foil target for shot 602013 [Fig. 3(c)] was ~62°. The difference in angular distribution between the 10- and 2-μm-thick Al foil targets was analyzed. To exclude the influence of the thick target, a Monte Carlo simulation experiment involving electrons with the energy and angular distribution of shot 602013, passing through an 8-μm-thick Al foil, was performed using the EGSnrc code system (Kawrakow and Rogers, Reference Kawrakow and Rogers2000). As shown in Figure 3(c), the simulated curve appeared still significantly narrower than the experimental curve observed for the 10-μm-thick Al foil target in Figure 3(b). The different generation mechanisms and self-generated magnetic field characteristics (Gao et al., Reference Gao, Nilson, Igumenschev, Hu, Davies, Stoeckl, Haines, Froula, Betti and Meyerhofer2012) may be responsible for this outcome.
Total electron energy from 50 to 400 keV at different angles for (a) shot 112007 (10-μm-thick Al foil, 206 J, 8.7 × 10¹³ W/cm2), (b) shot 603018 (10-μm-thick Al foil, 426 J, 2.2 × 10¹⁴ W/cm2), and (c) shot 602013 (2-μm-thick Al foil, 468 J, 2.3 × 10¹⁴ W/cm2). The dots and triangles represent experimental data points, while the curves are the best fit to the data by using the Gaussian function. The dashed curve with arbitrary units in (c) is the result of the Monte Carlo simulation of an electron beam based on the electron phase space data from shot 602013, passing through an 8-μm-thick Al foil.
3.3. Conversion rate of suprathermal electrons
The conversion rate of laser energy into escaped suprathermal electron energy was calculated over the π sr solid angle behind the target, around the k vector of the incident laser. The 1/4 sphere (π sr) was divided into seven zones whose plane angle ranges were approximately 0–5, 5–15, 15–25, 25–35, 35–45, 45–55, and 55–60°. The formula for calculating the conversion rate is given by
 $$\eta = \displaystyle{{\mathop \sum \nolimits_{i = 1}^7 E_{{\rm el}}(i)/\Omega _{{\rm ESM}} \times \Omega (i)} \over {E_{{\rm in}}}},$$
where E
el(i) is the total energy of suprathermal electrons from 50 to 400 keV, measured by one or two ESMs in the ith zone, ΩESM is the ESM aperture, Ω(i) is the solid angle of the ith zone, and E
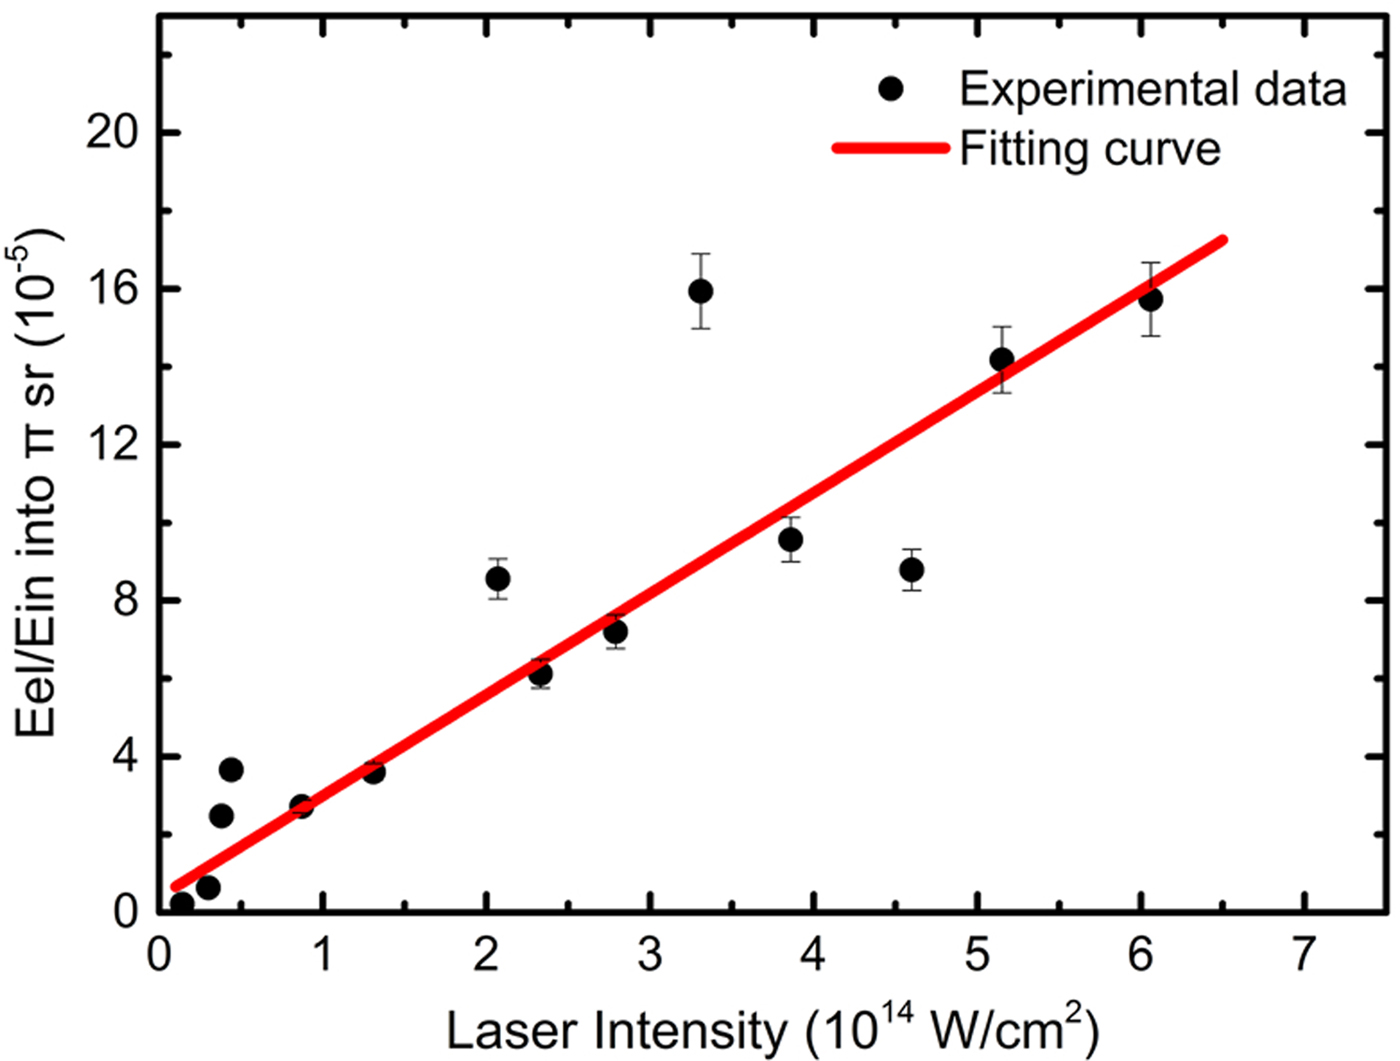
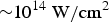
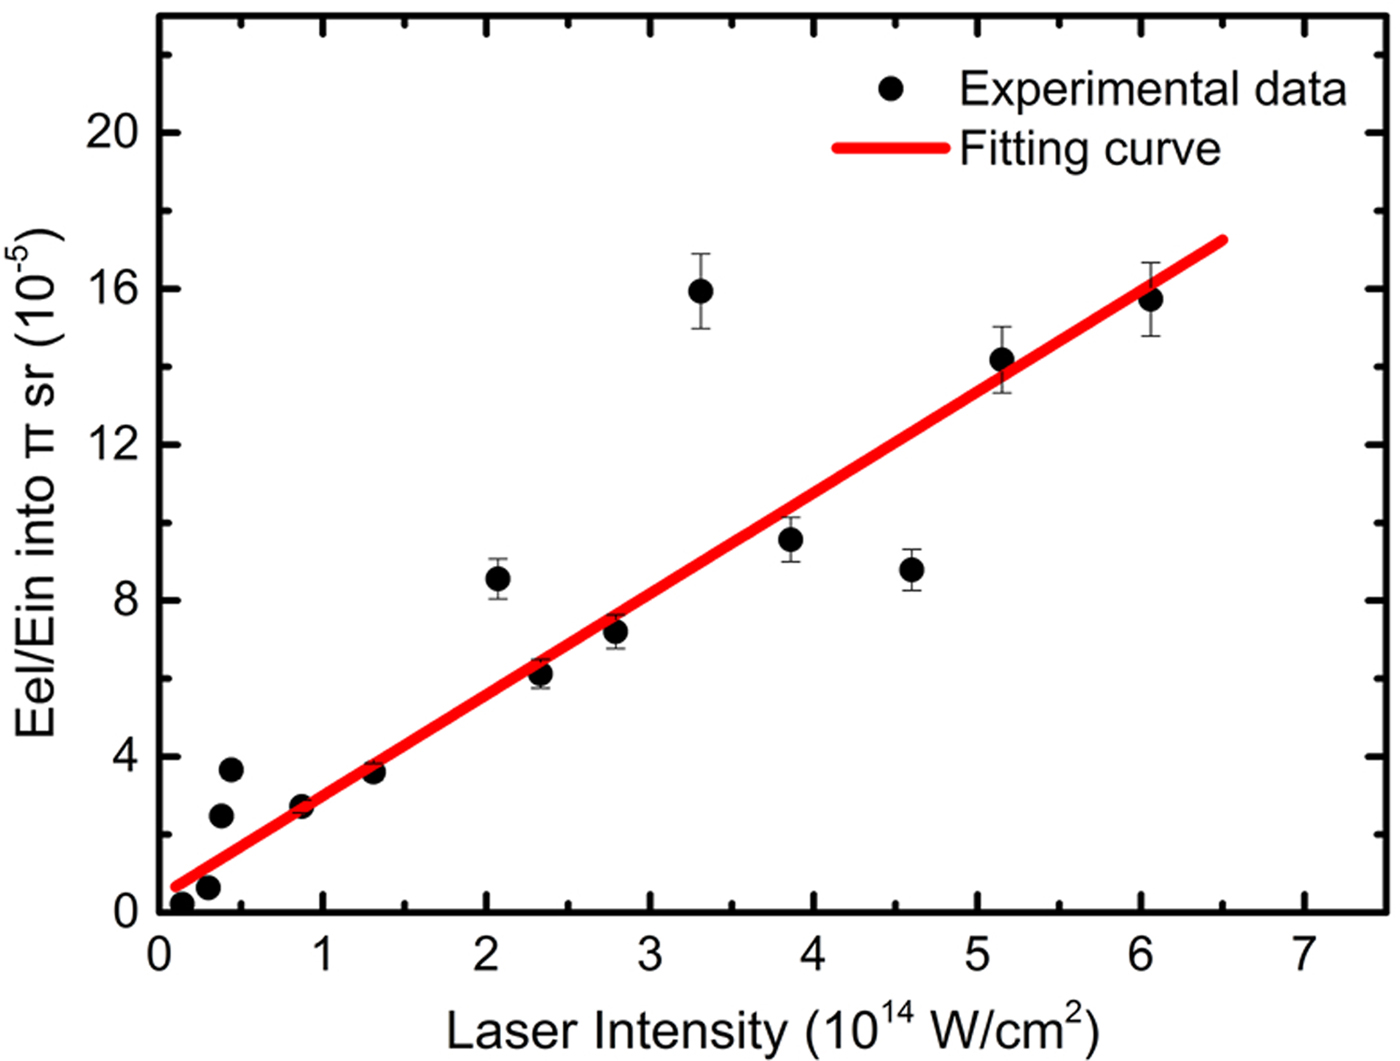
in is the incident laser energy. As the burn-through of the 2-μm-thick Al foil targets causes light energy leakage, only the conversion rates of the experiments involving the use of the 10-μm-thick Al foil were calculated; the variation of the conversion rate as a function of the laser intensity is shown in Figure 4. The conversion rate appeared to increase linearly with the laser intensity varying from 0.2 × 10¹⁴ to 7 × 10¹⁴ W/cm2, while the growth rate was ~2.59 [10−5/1014(W/cm2)]. When the intensity of the main pulse reached 4 × 10¹⁴ W/cm2,
 $\sim \!\!10^{ - 4}$
of the incident energy was converted into suprathermal electron energy over the π sr solid angle along the direction of the laser.
Conversion rate of incident laser energy into suprathermal electron energy versus laser intensity in the vacuum. Only the suprathermal electrons in the π sr solid angle behind the target around the k vector of the incident laser were calculated. The black dots represent experimental data points, whereas the red curve, whose growth rate is 2.59, indicates the results of the linear fitting.
4. DISCUSSION
Generally, under the laser conditions adopted in this work, suprathermal electrons are thought to be accelerated by EPWs, which are mostly produced by RA, TPD, and SRS. However, wave–particle interaction in laser-produced plasma is a very complex phenomenon that may have various origins and involve different linear and non-linear mechanisms. In this paper, our discussion mainly concentrates on the characteristics of the electron energy spectra and the angular distribution.
4.1. Characteristics of electron energy spectra
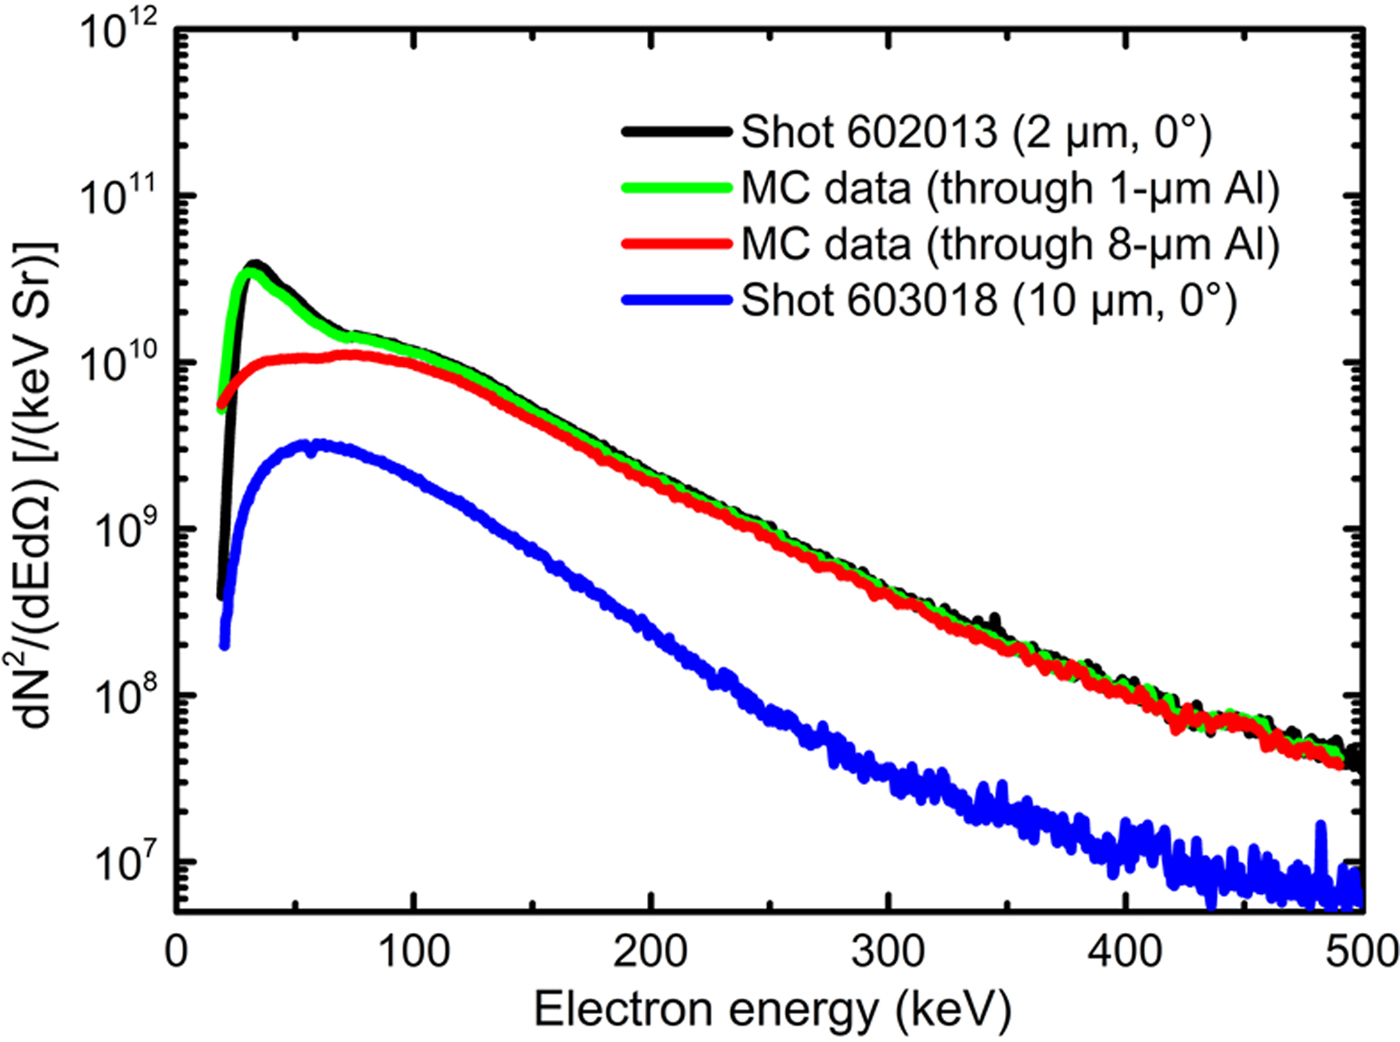
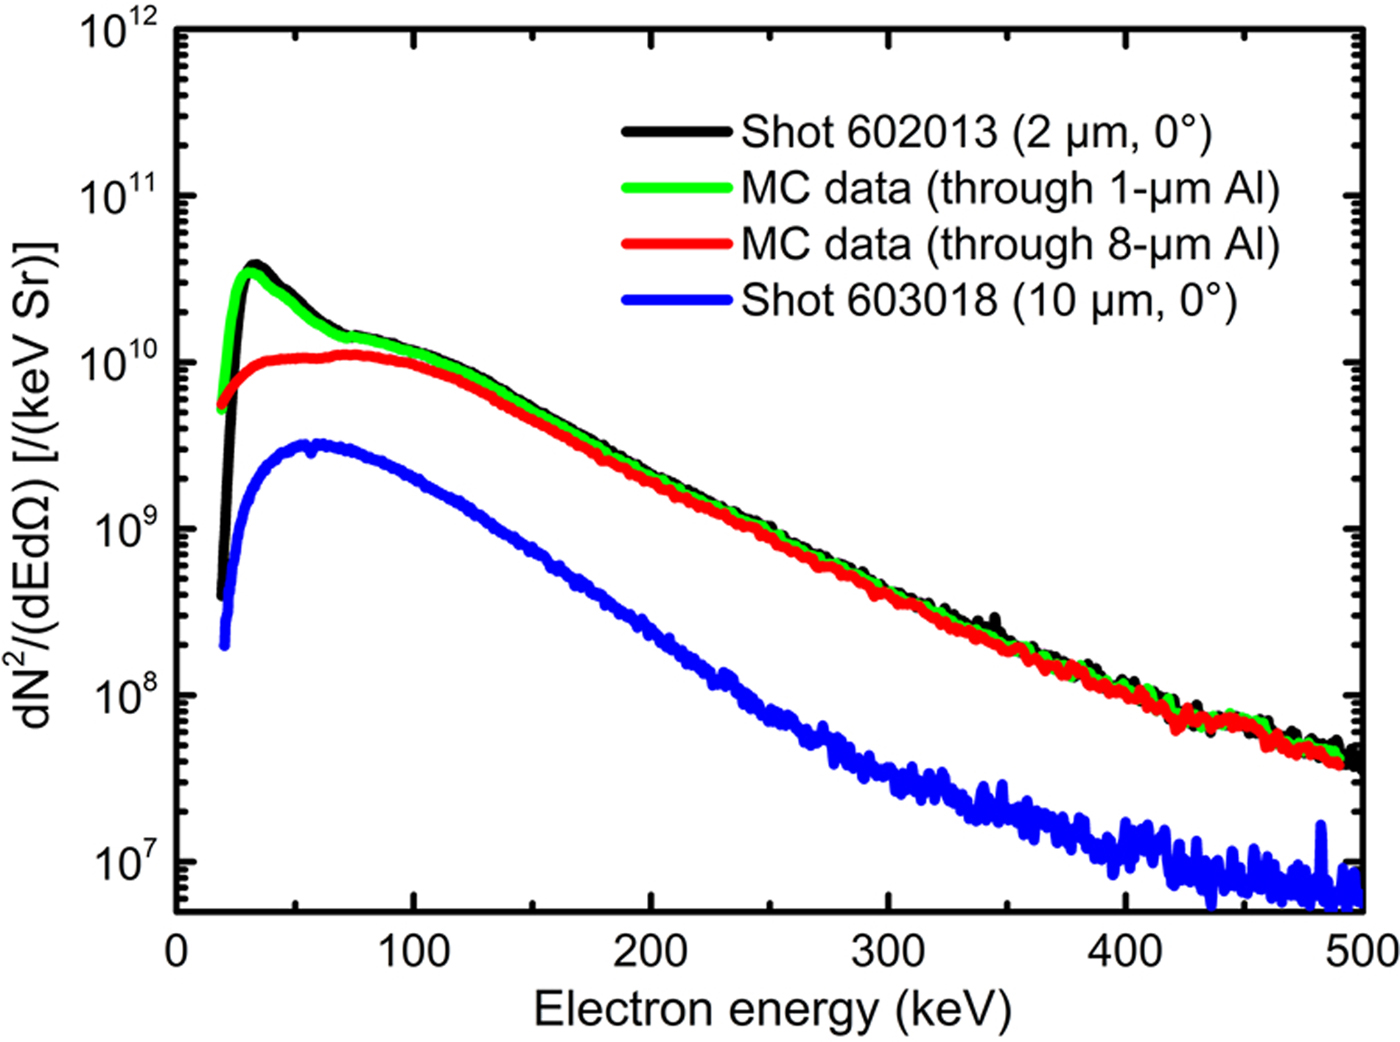
As shown in Figure 5, the electron energy spectra obtained for the 2- and 10-μm-thick targets are compared. The EGSnrc Monte Carlo code was used to simulate electrons from the 2-μm-thick target (shot 602013) passing through 1- and 8-μm-thick Al foils. The simulation of the 1-μm-thick Al foil was used to test the simulation parameter settings, owing to its little influence on the spectrum, and the 8-μm-thick Al foil was used to represent the non-ablated part of the 10-μm-thick Al foil target during the main pulse. The results reveal that most of the electrons with a double temperature distribution will disappear in the lower temperature range when they pass through an 8-μm-thick Al foil, producing a single temperature distribution spectrum as that obtained for the 10-μm-thick Al target. This indicates that the suprathermal electrons generated in the corona of plasmas actually have a double temperature distribution.
Comparison of electron energy spectra between experiments under similar laser conditions and Monte Carlo (MC) simulations. The green and red curves, which indicate the MC simulation results, show that, when an electron beam with double temperature distribution (Shot 602013) passes through an 8-μm-thick Al plate, the electrons will become a single temperature distribution as that obtained for the 10-μm-thick Al target (Shot 603018).
In addition, according to a previous work (Rousseaux et al., Reference Rousseaux, Amiranoff, Labaune and Matthieussent1992), the kinetic oscillation energy just before wave breaking of the RA in a linear density profile was calculated as
 $$\Delta E_{\max} ({\rm keV}) \cong 2 \times 10^{ - 6}\sqrt {I_0\lambda _{\rm \mu} L_{\rm \mu}}, $$
where I
0 (W/cm2) is the intensity of the incident laser, λμ is the laser wavelength in microns, and L
μ is the density scale length of plasmas at the critical density (n
c) in microns. At I
0 = 2.3 × 10¹⁴ W/cm2, λμ = 0.53 μm, and
 $L_{\rm \mu} /\lambda _{\rm \mu} \sim \!1$
near n
c, it can be obtained that ΔE
max is
 $\sim \!\!16\,{\rm keV}$
, which is consistent with the lower temperature. Thus, these electrons at lower temperatures can be assumed as generated by RA instability, while other electrons at higher temperatures may be generated by SRS and TPD instabilities. Besides, the intensity difference of the electron spectra obtained for 2- and 10-μm-thick targets under similar laser conditions may be caused by the different plasma density distributions. As the 2-μm-thick target was burned through during the main pulse, the density scale length of plasmas below 1/4 critical density became longer than that formed in the 10-μm-thick target experiments; this may reduce the threshold intensity of TPD and SRS (Rousseaux et al., Reference Rousseaux, Amiranoff, Labaune and Matthieussent1992), causing the generation of more electrons.
4.2. Angular distribution
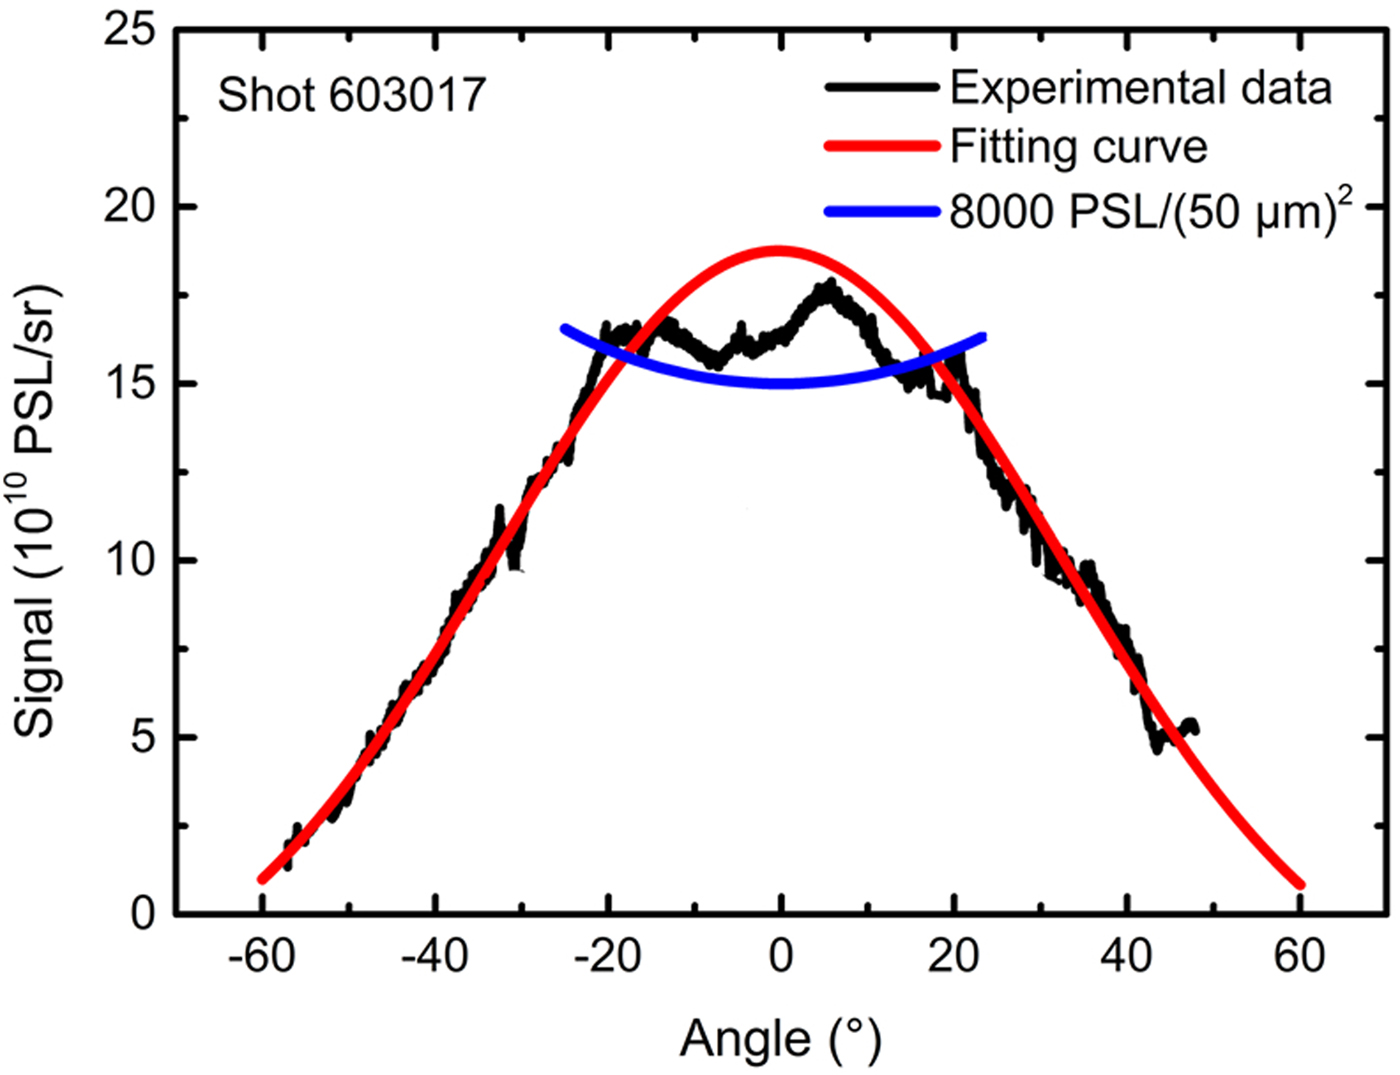
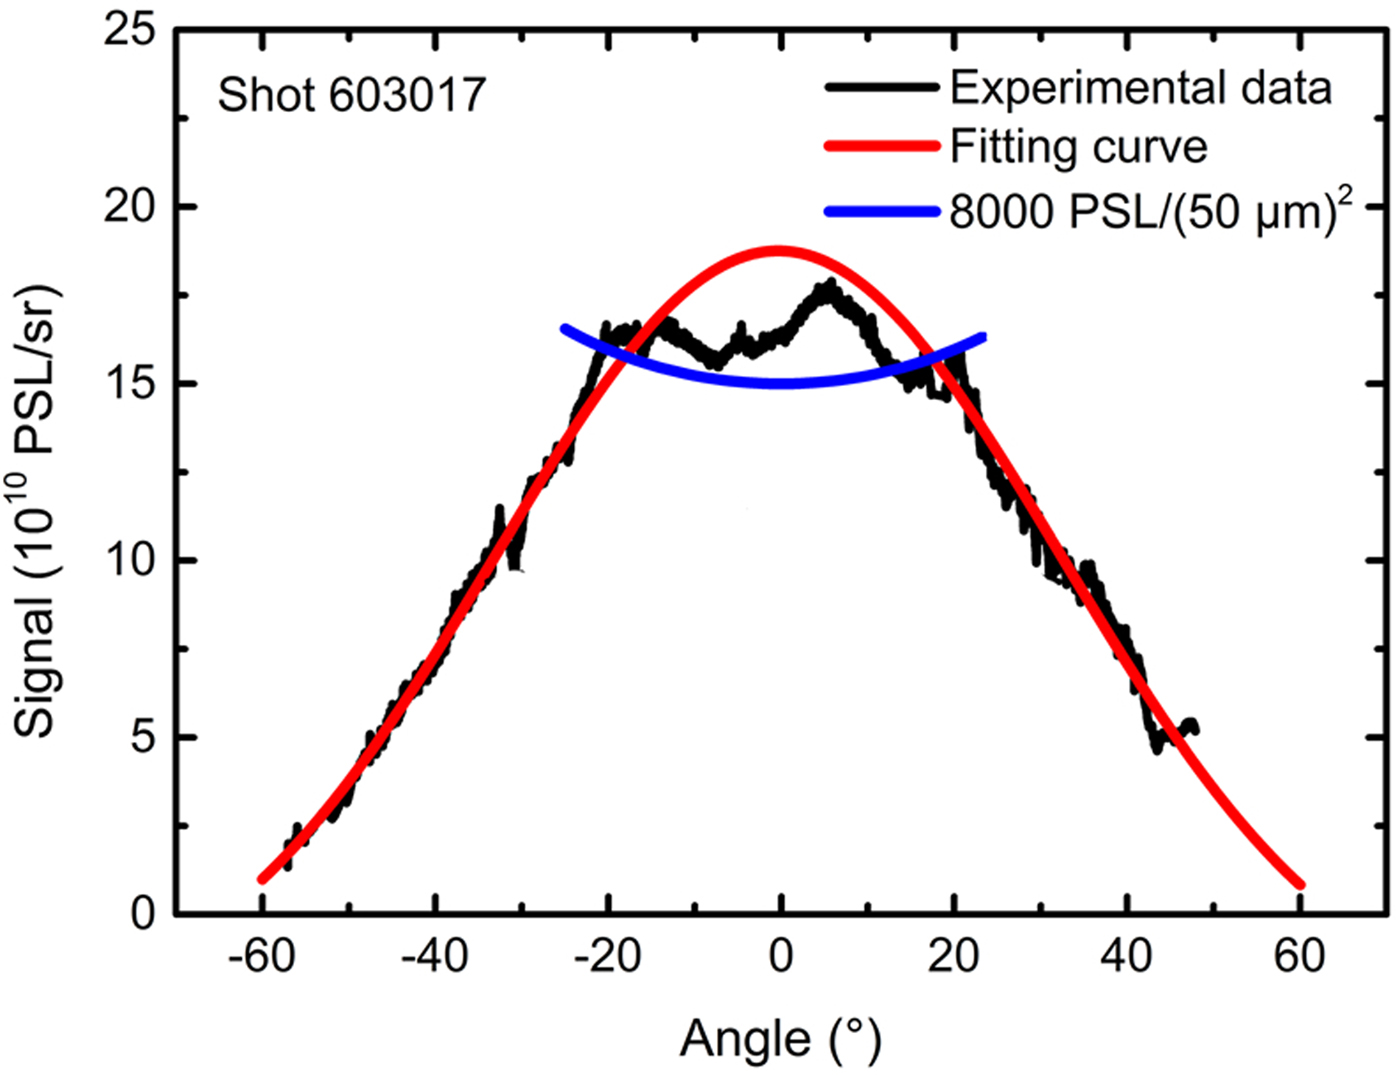
Although 19 ESMs were used to detect the angular distribution of the electron emission, they could not cover all the angles in space. To fully detect the emission directions of the suprathermal electrons, several IPs covered with 15-μm-thick Al foils were placed behind the 2-μm-thick Al foil target during the shot 603017 experiment. In this shot, the laser condition was similar to that used for shot 602013. Both suprathermal electrons and X rays, as well as other particles, can be detected by IPs. Fortunately, as the 2-μm-thick Al foil target could be burned through, a small amount of hard X rays could be generated through bremsstrahlung. Besides, most low-energy X rays, electrons with energy lower than 45 keV, and other particles could be absorbed by the 15-μm-thick Al foil on the IPs, along with the 6-μm-thick protective layer. Furthermore, the sensitivity of the IPs (BAS-SR) to the X rays was lower than that to the suprathermal electrons by one order of magnitude (Maddox et al., Reference Maddox, Park, Remington, Izumi, Chen, Chen, Kimminau, Ali, Haugh and Ma2011). Thus, the results in Figure 6 partly show the emission intensity of suprathermal electrons. Considering the intensity of the signals, optical density filters were inserted to avoid the saturation of the IP reader (Tanimoto et al., Reference Tanimoto, Ohta, Habara, Yabuuchi, Kodama, Tampo, Zheng and Tanaka2008). Unfortunately, the signals in the central region were still too intense and thus saturated the IP [higher than 8000 PSL/(50 μm)2], resulting in a flat-topped experimental peak. However, the fitting (without saturated data) results revealed that the angular distribution of the suprathermal electrons was consistent with the Gauss distribution observed for the results obtained using the ESMs.
Intensity of suprathermal electrons versus angle for shot 603017 (2-μm-thick Al, 2.3 × 10¹⁴ W/cm2). The black curve represents the experimental data, the flat top of this curve may be caused by the imaging plate saturation; the blue curve represents the signal intensity of 8000 PSL/(50 μm)2. The Gaussian function was used to fit the experimental data (red curve); the full-width at half-maximum was ~69°.
In addition, the angular distribution of suprathermal electrons is directly related to the EPW propagation directions. For electrons with energy ranging from 50 to 400 keV (Fig. 3), EPW propagation directions mainly depend on the wave-vector and frequency matching conditions of TPD and SRS. (1) For TPD instability, in a homogeneous plasma, the EPW vectors of maximum TPD growth theoretically travel both up and down the density gradient at tens of degrees (depending on the plasma conditions) relative to the laser beam (Vu et al., Reference Vu, DuBois, Russell and Myatt2010); the experiments with CO2 lasers were in good agreement with these theoretical findings (Ebrahim et al., Reference Ebrahim, Baldis, Joshi and Benesch1980), as the largest suprathermal electron signals were observed at 45° with respect to the laser direction. (2) For SRS instability, the experiment conducted by Drake et al. with a 0.53 µm laser showed that the backscattered Raman light was usually a few times more intense than the sidescattered light (Drake et al., Reference Drake, Turner, Lasinski, Estabrook, Campbell, Wang, Phillion, Williams and Kruer1984), indicating that forward traveling EPWs would be excited more than side traveling EPWs, considering the wave-vector matching conditions. If we ignore the disturbance factors, such as hot spots in the focal spot, the angular distribution is just determined by the combination of TPD and SRS instabilities. Thus, if the SRS instability is dominant, the Gauss distribution of suprathermal electrons can be explained, and this assumption was supported by an experiment conducted at the OMEGA laser facility (Theobald et al., Reference Theobald, Nora, Seka, Lafon, Anderson, Hohenberger, Marshall, Michel, Solodov and Stoeckl2015). In this experiment, strong reductions of backscattered SRS emission and suprathermal electrons were observed when smoothing by spectral dispersion with 1 THz bandwidth was switched; however, the 3/2ω emission caused by TPD instability was only slightly reduced, indicating that the SRS appeared to be the primary generation mechanism of suprathermal electrons.
Moreover, the distribution of electron temperature shown in Figure 2(f) also suggests that the SRS instability is dominant in the 2-μm Al target experiments. As we know that the approximate temperature of suprathermal electrons accelerated by Landau damping or wavebreaking can be given
 $T_{{\rm se}}\sim \!\!1/2m_{\rm e}(\upsilon _{\rm \varphi} )^2$
, where υφ is the phase velocity of the EPW (Campbell et al., Reference Campbell, Goncharov, Sangster, Regan, Radha, Betti, Myatt, Froula, Rosenberg and Igumenshchev2017). In the plasma,
 $\upsilon _{\rm \varphi} \sim \upsilon _{\rm g}^{{\rm EM}} = c\sqrt {1 - n_{\rm e}/n_{\rm c}} $
, where
 $\upsilon _{\rm g}^{{\rm EM}} $
, n
e, and n
c are the group velocity of the electromagnetic wave in the plasma, the electron density of the plasma, and the critical density, respectively. It can be noted that the phase velocity decreases with the increase of electron density. Considering the fact that the TPD instability theoretically only occurs near n
c/4, while the SRS instability can occur in the lower density, so we believe that the phase velocity of the EPWs generated by SRS instability can be higher than by TPD instability, and the SRS instability is more likely to be important for the higher temperature. In the experiments of 2-μm Al foil target, due to the target burned through, the lower plasma density promotes the occurring of SRS instability. It leads to the electron temperature higher at the smaller angles as the result of 2-μm Al target experiment shown in Figure 2(f).
5. CONCLUSION
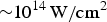
To summarize, suprathermal electrons from 0.53-μm laser-produced plasma were investigated by using 19 ESMs. The obtained electron energy spectra presented a double temperature distribution, in which the lower electron temperature was below 25 keV, while the higher was ~50 keV. The angular distribution of the total suprathermal electron energy from planar foil targets agreed with the Gaussian distribution well, peaking along the k vector of the incident laser. This distribution characteristic implies that suprathermal electrons produced by SRS instability were dominant. Based on their energy and angular distribution, the conversion rates of laser energy into escaped suprathermal electron energy over the π sr solid angle were calculated. Roughly 1/10 000 of laser energy was converted to suprathermal electron energy at a laser intensity of
 $\sim \!\!10^{14}\,{\rm W/c}{\rm m}^2$
; the conversion rate increased approximately linearly with the laser intensity (from 0.2 × 10¹⁴ to 7 × 10¹⁴ W/cm2), exhibiting a growth rate of ~2.59 [10−5/(1014 W/cm2)].
ACKNOWLEDGMENTS
The authors gratefully acknowledge the valuable advice of Baifei Shen and the experimental support of Xiaowei Yang, Junjian Ye, Guo Jia, and the technical team of the SGII Facility. This work was supported by the Chinese Academy of Sciences grant No. CXJJ-16S042.