Introduction
To investigate how biodiversity will be impacted by regional warming there is a need to understand how species distributions will change across temporal and geographic scales (Helmuth Reference Helmuth2009). Understanding the ecological and physiological mechanisms underlying current distributions will indicate which characteristics are likely to be the key components determining range changes (e.g. Poloczanska et al. Reference Poloczanska, Hawkins, Southward and Burrows2008). The magnitude and variability in experienced temperature is a physiological factor of particular importance to ectotherms as it has a fundamental effect on their body temperature and therefore the rate of all physiological processes within the organism (e.g. Hochachka & Somero Reference Hochachka and Somero2002). Many species distributions are correlated with environmental temperature (Salisbury Reference Salisbury1926, Root Reference Root1988, Calosi et al. Reference Calosi, Bilton, Spicer, Votier and Arfield2010) and temperature is therefore often seen as the most important physical mechanism underlying species distribution limits (e.g. Parmesan & Yohe Reference Parmesan and Yohe2003, Pörtner & Knust Reference Pörtner and Knust2007). Testing for correlations between physiological limits and distributional temperature envelopes will provide evidence of the influence of temperature in controlling species distributions (e.g. Calosi et al. Reference Calosi, Bilton and Spicer2008, Reference Calosi, Bilton, Spicer, Votier and Arfield2010, Angilletta Reference Angilletta2009).
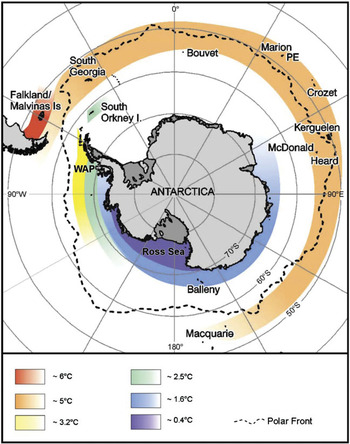
The constant cold of the Southern Ocean continental shelves is a unique thermal environment for the evolution of marine life, being at one end of the temperature continuum in the sea. As with many areas of the world’s oceans, currents, upwelling, downwelling and tidal cycles disrupt the correlation between thermal environment and latitude (e.g. Helmuth et al. Reference Helmuth, Harley, Halpin, O’donnell, Hofmann and Blanchette2002). However, even within the Southern Ocean there are latitudinal and depth gradients in temperature (both in magnitude and variability). Within the Southern Ocean annual maximum surface temperatures range from -1.9 to +5°C with variability ranging from 0.4–5°C over 22 degrees of latitude (76–54°S; Barnes et al. Reference Barnes, Fuentes, Clarke, Schloss and Wallace2006, Fig. 1).
Variation in sea surface temperatures in the Southern Ocean (based on monthly maxima and minima) showing the linear thermal gradient from the Ross Sea through the western Antarctic Peninsula to South Georgia. Modified from Barnes et al. Reference Barnes, Fuentes, Clarke, Schloss and Wallace2006.

Organisms have a limited number of responses to enhance their survival if the experienced climate is outside their optimal envelope: they can adjust to new conditions through existing physiological flexibility (acclimation), they can migrate to regions with more suitable climate, or they can adapt to changing conditions (“move, adapt or die” modified by Peck Reference Peck2005). Most of the Antarctic ectotherms investigated to date have evolved very limited thermal tolerances, which indicate they have limited physiological flexibility. For example, shallow water ectotherms from the West Antarctic Peninsula (WAP) mainly have acute temperature windows for survival of only 6–12°C. Over longer periods survival limits are much lower with a limit of only 1–6°C over several months’ exposure (Peck et al. Reference Peck, Clark, Morley, Massey and Rossetti2009b). Limits for activity of some molluscs found on the WAP are also very sensitive, with limits for swimming in the scallop Adamussium colbecki (Smith) being below 2°C, and righting in the limpet Nacella concinna (Strebel) and burrowing in the clam Laternula elliptica (King & Broderip) between 2 and 3°C (Peck et al. Reference Peck, Webb and Bailey2004). This suggests that some WAP species may start to become limited by temperatures above 1°C, which is also the average maximum annual summer temperature of surface Antarctic water at the WAP (1998–2005; Barnes et al. Reference Barnes, Fuentes, Clarke, Schloss and Wallace2006). However, summer temperatures usually only peak for a short period; a few weeks at most (Barnes et al. Reference Barnes, Fuentes, Clarke, Schloss and Wallace2006). So although WAP organisms have sufficient thermal tolerance to cope with current summer temperatures they experience on the WAP, these temperature limits are below the normal summer maximum temperature for surface water around the sub-Antarctic island of South Georgia (up to 5°C; Barnes et al. Reference Barnes, Fuentes, Clarke, Schloss and Wallace2006, Whitehouse et al. Reference Whitehouse, Meredith, Rothery, Atkinson, Ward and Korb2008) where several of the same species also occur. This suggests that to survive in the shallows at South Georgia stenothermal species may require greater physiological flexibility than has been demonstrated at the WAP (Morley et al. Reference Morley, Lurmann, Skepper, Pörtner and Peck2009a).
Species often experience different thermal regimes at different latitudes throughout their geographic range but even within locations there are substantial differences in thermal environment with depth. At South Georgia this is particularly striking as there can be more than 6°C variability in sea temperature from the surface to continental slope depths at a single point in time (see Brandon et al. Reference Brandon, Naganobu, Demer, Chernyshkov, Trathan, Thorpe, Kameda, Berezhinskiy, Hawker and Grant2004). Species may therefore be able to orientate themselves over this depth gradient to avoid the warmer water masses found at South Georgia. This would equate to the migration response to a changing environment.
Although acute thermal tolerance range can be the best predictor of current latitudinal range extent in some species (Calosi et al. Reference Calosi, Bilton, Spicer, Votier and Arfield2010), acclimatory ability is often thought to be the major factor determining the ability of species to survive future climate change (Stillman Reference Stillman2003). Species are often at their most sensitive at range edges (e.g. Stillman Reference Stillman2003) and it has recently become clear that many Antarctic species reach their northernmost limits at South Georgia (Barnes et al. Reference Barnes, Griffiths and Kaiser2009). Comparisons of the physiological limits of species that occur on the WAP and at South Georgia may therefore provide further insights into the sensitivity of these species and indicate if they will be able to cope with the current rapid regional warming in the Scotia and east Bellingshausen seas (Meredith & King Reference Meredith and King2005, Turner et al. Reference Turner, Overland and Walsh2007, Whitehouse et al. Reference Whitehouse, Meredith, Rothery, Atkinson, Ward and Korb2008).
In this study we use the 1–2°C physiological threshold temperature identified above for shelf species from the WAP, to test if the higher temperature of water masses at South Georgia limits the depth distribution of species that occur at both locations. The 1°C isotherm will be used to separate three water masses at South Georgia (based on summer CTD profiles in Collins et al. Reference Collins, Jones, Clark, Fielding, Slakowski, North, Reid and Watts2006), Surface Antarctic Water (SAW), Winter Water (WW) and Circumpolar Deep Water (CDW). The depth distribution of mollusc (bivalve and gastropod) species that co-occur at the WAP and South Georgia will then be compared using data in the SOMBASE database (Griffiths et al. Reference Griffiths, Linse and Crame2003).
Methods
Temperature depth profiles
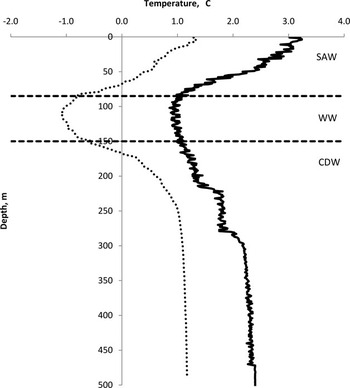
Three distinct summer water masses can be identified in the Southern Ocean: Surface Antarctic Water (SAW), an intermediate layer of Winter Water (WW) and the deep Circumpolar Deep Water (CDW) which is again often separated into different oceanographic layers, depending on temperature (Fig. 2; Brandon et al. Reference Brandon, Naganobu, Demer, Chernyshkov, Trathan, Thorpe, Kameda, Berezhinskiy, Hawker and Grant2004, Whitehouse et al. Reference Whitehouse, Meredith, Rothery, Atkinson, Ward and Korb2008). From a physiological perspective these water masses can be delineated by the c. 1.0°C isotherm. This isotherm was chosen to separate the water masses as it is a key physiological temperature for WAP marine ectotherms. This was the average maximum annual temperature at 15 m in Marguerite Bay between 1997 and 2006 (Barnes et al. Reference Barnes, Fuentes, Clarke, Schloss and Wallace2006) and sea temperatures above 1°C are known to cause physiological limitation for some Marguerite Bay species (e.g. brittle stars, Peck et al. Reference Peck, Massey, Thorne and Clark2009a). CTD profiles from 2006 (Collins et al. Reference Collins, Jones, Clark, Fielding, Slakowski, North, Reid and Watts2006) show that the average depth of the three water masses, ASW, WW and CDW, defined by the 1.0°C isotherm at South Georgia were approximately < 90 m, 90–150 m and > 150 m respectively. ASW at South Georgia typically reaches a summer maximum of 5°C (see Barnes et al. Reference Barnes, Fuentes, Clarke, Schloss and Wallace2006, Whitehouse et al. Reference Whitehouse, Meredith, Rothery, Atkinson, Ward and Korb2008), whilst WW maintains a temperature as cold as 0.5°C. CDW at South Georgia typically has a water temperature above 1.0°C but its upper layers can be as warm as 3°C (Brandon et al. Reference Brandon, Naganobu, Demer, Chernyshkov, Trathan, Thorpe, Kameda, Berezhinskiy, Hawker and Grant2004). On the WAP (including the South Shetland Islands) all three water masses are cooler. ASW has a maximum temperature of 3°C at the northern end of the peninsula, but an average maximum of 1.0°C further south in Marguerite Bay (Barnes et al. Reference Barnes, Fuentes, Clarke, Schloss and Wallace2006). WW has a minimum temperature of around -1.0°C but crucially its minimum temperature remains below 1.0°C across the latitudinal range from the WAP to South Georgia (Brandon et al. Reference Brandon, Naganobu, Demer, Chernyshkov, Trathan, Thorpe, Kameda, Berezhinskiy, Hawker and Grant2004). CDW from the Antarctic Peninsula remains around 1.0°C (Fig. 2).
Example depth temperature profiles from CTD casts at Marguerite Bay (15/02/10, Rothera Times Series) on the western Antarctic Peninsula (dotted line) and an average profile for South Georgia (solid line; between 11/01/06–29/01/06, Collins et al. Reference Collins, Jones, Clark, Fielding, Slakowski, North, Reid and Watts2006). The depths of surface Antarctic water (SAW 0–90 m), winter water (WW, 90–150 m) and circumpolar deep water (CDW, > 150 m) delimited by the depth of 1°C water at South Georgia, is shown (separated by dashed lines).

Species depth distribution
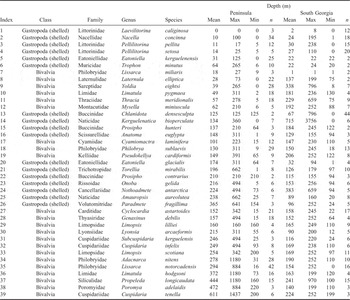
Species lists were created for the WAP (including the South Shetland Islands) and South Georgia by selecting all recorded species of mollusc from their distributions in SOMBASE (Griffiths et al. Reference Griffiths, Linse and Crame2003) using the regions defined in Clarke et al. (Reference Clarke, Griffiths, Linse, Barnes and Crame2007). These lists were then queried to find the mean depth and depth range for species that occur at both the WAP and South Georgia. Depth records for the species from each region were compiled from SOMBASE. Data records come from 232 sampling stations on the Peninsula and 182 at South Georgia covering the shelf and slope, down to 3000 m. Only species with more than one depth record from each region were used to reduce potential sampling bias. A full list of species can be found in Table I. Although species often span considerable depth ranges, and therefore often inhabit more than one water mass, comparisons of the mean depths of species found on the WAP and South Georgia were used to pick out general patterns that could be used to test whether temperature could be a factor limiting distributions.
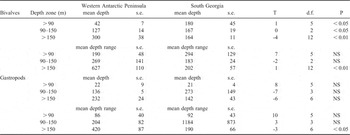
Mean depth and mean depth range (metres ± 1 s.e.) for bivalve and gastropod species that co-occur at both the western Antarctic Peninsula and South Georgia. Species separated into three groups based on the 1.0°C isotherm that separates three different water masses found at South Georgia: Antarctic shallow water < 90 m, winter water 90–150 m, Antarctic deep water > 150 m (see Fig. 2). Test results of the Wilcoxon ranked signs test and significant values are shown (Sokal & Rohlf Reference Sokal and Rohlf2009).

To test for differences in depth distribution between the WAP and South Georgia, the mean depths of each bivalve and gastropod species that occur at both locations was averaged and the depth range calculated. The mean depth of each species at the WAP was allocated into one of the three water masses that are thermally distinct within the Southern Ocean (ASW, WW, CDW), as defined by the depth of the 1°C isotherms at South Georgia (see above; Fig. 2). The depths of the species within these three groups were then compared with the depths of the same species at South Georgia. Data were not normally distributed, and could not be normalized through transformation, so non-parametric Wilcoxon signed rank tests were used to test for differences separately for each water mass and for bivalves and gastropods. The sample size in each size category was small, so the power of the comparisons was reduced, but the Wilcoxon test provided a means for the first comparisons of species distributions to see if they are coincident with (and possibly limited by) temperature at South Georgia. The depth ranges (depth between the shallowest and deepest record) of gastropods and bivalves within these same water mass categories were also compared.
Results
Surface Antarctic Water (< 90 m)
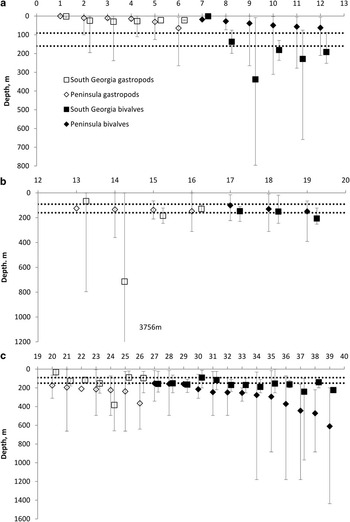
Bivalves found at mean depths < 90 m on the WAP (42 ± 7 m; Table I) were found significantly deeper at South Georgia (180 ± 45 m; T = 1, P < 0.05, df = 5; Fig. 3a). Five out of six species had deeper mean depths at South Georgia; of these, four had mean depths in the upper CDW with one in the cold WW. Bivalves seemingly avoided the warm surface waters and were centred in deeper water experiencing an average summer temperature of 1.2°C. The shallowest fauna (within the surface 35 m), were largely gastropods (five of the seven on the peninsula and six out of seven at South Georgia; Table II) and in both locations their mean depth was very similar, 22 ± 9 m vs 21 ± 4 m respectively (T = 8, P > 0.05, df = 5). There was no difference in the depth range of bivalves or gastropods between the WAP and South Georgia (T > 7, P > 0.05, df = 5).
Mean depths (and depth range) of gastropod and bivalve molluscs that occur on both the western Antarctic Peninsula and South Georgia shelf areas; species numbers (x-axis) refer directly to the species names in Table II. Each species is allocated to one of three categories based on increasing mean depth of occurrence on the WAP, a. shallower than 90 m, b. 90–150 m, c. > 150 m; depths that refer to waters masses of different temperature found at South Georgia (see Fig. 2). The depth zone for winter water (90–150 m) is shown by the dotted lines. Data analysed from SOMBASE database.

The depth distributions of bivalve and gastropod molluscs from the western Antarctic Peninsula and South Georgia. Index numbers for each species are the same as in Fig. 3. Data from SOMBASE (Griffiths et al. 2003). Mean, maximum and minimum depth in metres and sample size (n).

Winter Water (90–150 m)
Due to the restricted depth range of winter water at South Georgia, few species had distributions centred between 90–150 m on the WAP (three bivalves and four gastropods). At South Georgia both gastropods and bivalves had distributions centred on the cold winter water. However, although there was no significant difference in the mean depth of gastropods (T = -7, P > 0.05, df = 3; Fig. 3b) bivalves were found approximately 40 m deeper at South Georgia (167 ± 19 m), just deeper than the WW centred at an average temperature of 1.1°C (T = 0, P < 0.05, df = 2). There was also no difference in the respective depth ranges of either gastropods (T = -2, P > 0.05, df = 3) or bivalve molluscs (T = 3, P > 0.05, df = 2) between the WAP and South Georgia.
Circumpolar Deep Water (> 150 m)
Bivalves with mean depths deeper than 150 m on the WAP had significantly shallower mean depths at South Georgia (164 ± 11 m), centred just below the colder WW (T = -4, P < 0.01, df = 12; Fig. 3c) at a mean summer temperature of 1.1°C. If CDW bivalves were centred at the same depth at South Georgia as they are on the WAP (300 ± 38 m) they would be in the warmer upper waters of the CDW, at a mean temperature of 2.2°C at South Georgia, but which remains at or less than 1.1°C on the WAP (Fig. 2; Brandon et al. Reference Brandon, Naganobu, Demer, Chernyshkov, Trathan, Thorpe, Kameda, Berezhinskiy, Hawker and Grant2004). This gives an indication that these warmer CDW temperatures at South Georgia may be shaping the depth distributions of deep shelf bivalve species at South Georgia. This is supported by the fact that these bivalve species also had a significantly wider depth range at the WAP (T = 1, P < 0.01, df = 12) than South Georgia. There was no significant difference in the mean depth (T = -6, P > 0.05, df = 6) of gastropod species found deeper than 150 m on the WAP (232 ± 24) and also found at South Georgia (142 ± 43), although six out of seven gastropods had a shallower mean depth at South Georgia. The depth range of gastropods on the WAP (420 ± 87) was significantly wider than the same species at South Georgia (190 ± 66 m; T = -3, P < 0.05, df = 6).
Discussion
The depth distributions in this analysis provide evidence that temperature could be a major physical factor influencing the distribution limits for the bivalves at South Georgia. There is a tendency for bivalves to be centred on the colder winter water (colder than the 1°C isotherm), with 11 of the 22 species found at South Georgia having mean depths in this narrow depth range. This suggests that the warmer waters at South Georgia (2–5°C) may be physiologically sub-optimal or limiting for WAP bivalves. Although there is a wide literature establishing that temperature is a fundamental physiological factor determining range limits (e.g. Calosi et al. Reference Calosi, Bilton and Spicer2008, Reference Calosi, Bilton, Spicer, Votier and Arfield2010) its effects are rarely isolated from interactive factors, such as photoperiod, habitat, food availability and ecological interactions, which all have the potential to vary over the same latitudinal and depth gradients (e.g. competitive interactions, Poloczanska et al. Reference Poloczanska, Hawkins, Southward and Burrows2008). The fact that bivalve distributions were both shifted deeper (away from SAW) or shallower (away from the upper CDW) indicates that many factors such as food availability or light intensity, which have a unidirectional gradient change with depth, are unlikely to be the primary underlying cause.
Gastropods did not show any significant differences in depth distribution between the WAP and South Georgia suggesting that different factors are affecting their distribution and they might have greater physiological temperature tolerance than bivalves. Comparisons of these two mollusc classes might therefore provide insights into the mechanisms underlying distribution patterns within the Southern Ocean. To test for taxonomic robustness of temperature-controlled distribution, the depth ranges of an unrelated (and perhaps sessile) group could be compared between the two regions, such as sponges, corals or bryozoans, for which databases are currently in the process of being established.
Latitudinal comparisons of physiological tolerance
The climate variability hypothesis (Stevens Reference Stevens1989) predicts that species from more thermally variable environments will be able to cope with a wider range of temperatures (Gaston et al. Reference Gaston, Chown, Calosi, Bernado, Bilton, Clarke, Clusella-Trullas, Ghalamber, Konarzewski, Peck, Porter, Pőrtner, Rezende, Schulte, Spicer, Stillman, Terblanche and van Kleunen2009). However, the results of studies of the acclimatory ability of species across environments have found different results, depending on whether samples were taken in the centre or edge of their species range. For example, European freshwater beetles, sampled from the centre of their ranges had higher acclimatory capacity if they inhabited warmer environments (Calosi et al. Reference Calosi, Bilton and Spicer2008). Whereas marine porcelain crabs sampled from the upper limit of their range on the shore had lower acclimatory capacity then those sampled from lower on the shore. Stillman (Reference Stillman2003) concluded that species that are adapted to live close to their physiological limit may have limited capacity to cope with further change. This principle has been extended to explain why tropical ectotherms are also sensitive to small increases in temperature (Compton et al. Reference Compton, Rijkenberg, Crent and Piersma2007, Deutsch et al. Reference Deutsch, Tewksbury, Huey, Sheldon, Ghalambor, Haak and Martin2008, Tewksbury et al. Reference Tewksbury, Huey and Deutsch2008, Morley et al. Reference Morley, Tan, Day, Martin, Pörtner and Peck2009b).
The Antarctic limpet Nacella concinna is a species whose physiology has been extensively studied and for which South Georgia represents its northern geographic limit. So although N. concinna experiences a wider seasonal range of water temperatures at South Georgia (-1 to +5°C) than at the WAP (-2 to +1°C) it might not be expected to have a greater acclimatory capacity at its range edge. Although distributed over a wide depth range (0–110 m; Walker Reference Walker1972) N. concinna has a similar mean depth within the SAW at both the WAP (10.1 m) and South Georgia (24.4 m) indicating that their distribution has not been shifted away from the warmer surface waters at South Georgia. The temperature limit for righting of N. concinna from Marguerite Bay (2–3°C; Peck et al. Reference Peck, Webb and Bailey2004) therefore suggests that, unless they have increased physiological flexibility at South Georgia, which allows them to cope with summer temperatures, they will lose the ability to right during the six months when surface temperature at South Georgia remains above 2°C (December–May; Barnes et al. Reference Barnes, Fuentes, Clarke, Schloss and Wallace2006).
In a latitudinal comparison of physiological capacity, N. concinna at South Georgia showed greater acclimatory capacity, after three months at 3°C, than those from Marguerite Bay (Morley et al. Reference Morley, Lurmann, Skepper, Pörtner and Peck2009a). Although mitochondrial membrane density was reduced in the foot muscle of 3°C compared to 0°C acclimated N. concinna from both locations, the function of a key metabolic enzyme (citrate synthase) was only maintained in South Georgia limpets (Morley et al. Reference Morley, Lurmann, Skepper, Pörtner and Peck2009a), indicating that they have a greater capacity to acclimate to their warmer experienced environment. However, in response to acute temperature increases (2.5°C per week) there was no difference in the lethal limit (10–12.5°C) and a 2.5°C lower critical limit of acclimated South Georgia limpets compared to those from Marguerite Bay (Morley et al. Reference Morley, Hirse, Pörtner and Peck2009c). These complicated differences in thermal response suggest that care must be taken when deciding the rate of temperature change at which physiology is assessed (e.g. Peck et al. Reference Peck, Clark, Morley, Massey and Rossetti2009b). It does, however, support the principle that increased long-term physiological flexibility may come at a cost in terms of acute thermal sensitivity of species living at their range limits. If these differences in physiological flexibility can be correlated with experienced thermal environment and current distributions it will allow predictions of probable future changes in these distributions. It is notable that N. concinna are only found in the low intertidal at South Georgia, in cryptic habitats, because, at this northern range limit, air temperatures often exceed its acute thermal threshold during low water emersion (Davenport Reference Davenport1997). Some of the most thermally sensitive species living in the WAP surface water, the bivalve Adamussium colbecki (Peck et al. Reference Peck, Webb and Bailey2004) and the brittle star Ophionotus victoriae Bell (Peck et al. Reference Peck, Massey, Thorne and Clark2009a) are not found at South Georgia. Latitudinal comparisons of the thermal sensitivity of more species are needed to investigate differences in physiological flexibility.
Isolation, genetic exchange and species distribution limits
South Georgia is the northernmost shelf area in the Atlantic sector of the Southern Ocean and is a strong hotspot for northern limits of Southern Ocean species (e.g. for 36 gastropod and seven bivalve molluscs, 48 cheilostome bryozoans, three ascidians, 14 fish (see Barnes et al. Reference Barnes, Griffiths and Kaiser2009) and a number of other fauna, such as asteroids and isopods (data from SCAR-MarBIN). As far as is known to the authors, the Antarctic species which have not been recorded north of South Georgia have also not been found in warmer waters than those at South Georgia. Also of note is that although at their northernmost limit, many such species are common and even locally abundant in the shallows, and thus ideal for experimental evaluations of thermal biology in relation to species range. Indeed, this may be one of the few places on Earth where this type of study can be carried out on stenotherms. Comparisons within the Southern Ocean have great potential for understanding important indicators of range changes and other responses to climate change.
Of particular importance for comparisons between the continental shelves of the WAP and South Georgia is their geographic isolation and how this limits recruitment and genetic exchange between populations (e.g. Linse et al. Reference Linse, Cope, Lorz and Sands2007). Molecular studies have supported at least some South Georgia and WAP populations as being conspecifics (e.g. Linse et al. Reference Linse, Cope, Lorz and Sands2007) including Nacella concinna. Due to the easterly flow of the circumpolar current from the northern Antarctic Peninsula to South Georgia and Shag Rocks then eastwards, larval and adult supply is unidirectional from the WAP to South Georgia (e.g. Thorpe et al. Reference Thorpe, Heywood, Stevens and Brandon2004, Linse et al. Reference Linse, Cope, Lorz and Sands2007). This current travels faster in the surface waters than at depth (Brandon et al. Reference Brandon, Naganobu, Demer, Chernyshkov, Trathan, Thorpe, Kameda, Berezhinskiy, Hawker and Grant2004) but intuitively it seems probable that most larval drift and rafting of adults occurs in surface waters. To travel from the northern tip of the Peninsula to South Georgia in surface waters could take between 4–7 months (Thorpe et al. Reference Thorpe, Heywood, Stevens and Brandon2004), and although development and larval lifetimes are very long in Antarctica (Stanwell-Smith & Peck Reference Stanwell-Smith and Peck1998), this would still create a degree of isolation between the shelves (Thorpe et al. Reference Thorpe, Heywood, Stevens and Brandon2004). Survival of larvae in the SAW during transport to South Georgia would be affected by exposure to gradual or sudden changes in temperature as larvae drift through frontal zones, and this is likely to be crucial for colonization success.
The northern distributional limits of species which occur at South Georgia could be set by physiological or geographic limitation. The lack of continuous shelf (or continental slope) northwards means that even species that could cope with conditions at lower latitudes (e.g. raised sea temperatures) have little possibility to do so. Larvae or adults of benthic species that drift past or from the South Georgia shelf have no other northerly shelf within 4500 km and are unlikely to survive. Whether species at realized northern limits are constrained by physiology, ecology or geography is likely to be important to their potential to respond to change, such as regional warming. The factors setting range limits are likely to differ between species, but at least some populations at the edge of their physiological range have much less flexibility and scope than those which are mid-range (Stillman Reference Stillman2003). Only by combining species distributions with measures of physiological tolerance can these two factors be separated.
Acknowledgements
This perspective forms part of the British Antarctic Survey Polar Science for Planet Earth Programme. It was funded by the Natural Environment Research Council and is a contribution to Antarctica New Zealand’s Latitudinal Gradient Program. Thanks go to Hugh Venables, Mark Belchier and Sophie Fielding for supplying the CTD data and HV, Katrin Linse and Chester Sands for useful discussions during the preparation of this manuscript. Thanks go to Dave Bowden and an anonymous reviewer who provided comments that improved the manuscript.