

Sources
The principal sources of information on which this chronicle is based are British Broadcasting Corporation, Monitoring Global News line – Asia-Pacific Political and British Broadcasting Corporation, Monitoring Global News line – Asia-Pacific Economic. These sources, now only available electronically, do not have reference numbers and are only identifiable by date of publication of material. The inclusion of each of these dates would unnecessarily clutter the text and such dates have therefore been omitted, except, at many points, for the original sources from which the BBC reports themselves are taken.
Abbreviations
- XHNA
Xinhua (New China) News Agency
- CNA
Central News Agency (Taipei)
- RTHK
Radio-Television Hong Kong
- ZTS
Zhongguo tongxun she (China Reporting Agency), Hong Kong
- ZXS
Zhongguo xinwen she (China News Agency), Beijing
- RMRB
Renmin ribao (People's Daily)
- SCMP
South China Morning Post
- KCNA
Korean Central News Agency
1. Internal Developments
aThe Seventh Session of the 11th National People's Congress (NPC) Standing Committee
bThe Second Session of the 11th NPC
cParty and Political Affairs
dDefence
eStatistical Communiqué on National Economic and Social Development during 2008
fTibet
gEconomic Affairs
hHealth
iSocial Affairs
jMacau Special Administrative Region (SAR)
2. Foreign Relations
aDiplomatic Tours
bCountries, Territories and Regions
1. Internal Developments
a The Seventh Session of the 11th NPC Standing Committee
The Seventh Session of the 11th National People's Congress Standing Committee meeting opened on 25 February and concluded its business on 28 February. The session was presided over by Wu Bangguo, Chairman of the NPC Standing Committee. It passed the Food Safety Law, Amendment No. 7 to the Criminal Law (intended to protect personal information collected by government departments from being divulged or abused) and the revised Insurance Law. These were then promulgated via Presidential Decrees Nos. 9, 10 and 11 signed by President Hu Jintao.
The session also ratified the “Treaty on Judicial Assistance in Civil and Commercial Cases between the People's Republic of China and the Republic of Peru,” the “Extradition Treaty between the People's Republic of China and the United States of Mexico” and the “Consular Agreement between the People's Republic of China and Japan.”
The meeting voted and approved the draft work report of the NPC Standing Committee, having further improved it through discussion. It decided that the report would be delivered to the Second Session of the 11th NPC by Chairman Wu Bangguo on behalf of the Standing Committee.
The session voted and approved the report submitted by the Credentials Committee of the NPC Standing Committee on the credentials of a number of NPC Deputies. The actual number of deputies to the 11th NPC is 2,985.
The meeting voted and approved the draft agenda of the Second Session of the 11th NPC which will be submitted to the preparatory session for deliberation and approval. It voted and approved the membership of the presidium and the Secretary General for the Second Session of the 11th NPC which will be submitted to the preparatory meeting for approval. It voted and approved the list of people to attend the Second Session of the 11th NPC as observers.
In conclusion, Wu Bangguo made a speech in which he said that the main business of the meeting had been to prepare for the Second Session of the 11th NPC. All those present had unanimously agreed that in the past year the 11th NPC and Standing Committee had seriously implemented the spirit of the 17th Party Congress and the Third Plenary Session of the 17th Central Committee as well as other guidelines and directives, and had firmly adhered to the correct political direction of NPC work. Wu said that the coming year would be critical for carrying out the 11th Five-Year Programme, and a crucial year for coping with the impact of the international financial crisis and maintaining stable and fairly quick economic development and social harmony. The task of reform, development and stability would be very serious. It was necessary to ensure that forthcoming NPC Session would be marked by the characteristics of democracy, unity, pragmatism and endeavour. It was also necessary for them to listen modestly to the opinions of deputies and consciously accept the people's supervision (XHNA, 28 Feb.).
b The Second Session of the 11th NPC
The Second Session of the 11th NPC opened on 5 March. It was chaired by Wu Bangguo (Chairman of the NPC Standing Committee) and its main business was to hear the “Report on the Work of the government” delivered by the Premier Wen Jiabao on behalf of the State Council (full text taken from live broadcast by Chinese Central Television TV-1, 5 Mar.).
Review of government work during the previous five years
Wen said that 2008 had been an “extraordinary year” in which China had faced historically rare major challenges and tests, but stated that nonetheless China had made significant new achievements in reform and opening up, and in its socialist modernization. These achievements included continued steady and relatively fast growth in the economy with GDP rising by nine per cent, prices being kept under control, further improvements in living standards for the population, and further reforms in key areas such as taxation and finance. He noted the significant victories won in dealing with a number of extraordinarily serious natural disasters, the successful hosting of the Beijing Olympics, and the Shenzhou-7 manned space flight among China's most special achievements. He singled out the following areas for comment:
(i) Macroeconomic management: China had reacted in a timely fashion to the challenges posed by the global economic crisis. In the middle of the year as international energy and food prices shot up, macro controls had been adjusted to prevent domestic prices rising too fast and to maintain steady economic growth. After September when “the international situation took a sudden turn for the worse,” China reacted quickly to shift the focus of macro controls again to prevent any speedy downturn in economic expansion. It implemented an “aggressive fiscal policy and moderately easy monetary policy”; measures included cutting the base interest rate five times, granting a number of tax concessions on stock and property transactions, and increasing lending to support small and medium enterprises. Ten new measures were introduced to stimulate domestic demand and were carried out “in the most urgent fashion.”
At the same time China had managed to keep up the pressure on dealing with the “three rural issues” (the problems faced by agriculture, peasants and the rural areas), increasing both investment (by 37.9 per cent) and subsidies for the rural areas significantly. Minimum food prices were raised three times, cumulatively over 20 per cent.
China had continued to place high emphasis on innovation and economic restructuring. Sixteen major new technological projects were undertaken and overall central investment in science and technology reached 116.3 billion yuan, an increase of 16.4 per cent.
Work continued on “eliminating backward production capacity” and improving energy efficiency. A considerable number of small power plants and coal mines were closed, and major new investments were made in energy, transport and water conservancy. Over the last three years energy consumption per unit of GDP was reported to have fallen by 10.8 per cent, and some progress was made in reducing chemical oxygen demand and sulfur dioxide emissions.
(ii) Improving living conditions and provision of social services: Wen noted a number of major achievements in the provision of improved social security coverage. The numbers covered by basic pension funds and basic medical insurance in the urban areas increased by 17.53 million and 20.28 million people respectively. Basic subsistence for both rural and urban residents was “comprehensively strengthened” and 66.19 million people were assisted. Living allowances for low-income groups and for undergraduates were increased.
Education saw “new progress in facilitating fairness.” Free compulsory education was implemented for both urban and rural areas, and free textbooks were provided to students in rural areas who had free education. Maintenance standards for schools were improved. Vocational education was expanded considerably, and scholarships were provided for students from rural areas or impoverished urban families.
Significant achievements in health care were noted. Wen announced that 91.5 per cent of the rural population was now taking part in the rural co-operative healthcare system, and there were substantial increases in the number of urban residents covered by basic medical insurance.
(iii) Further reform: Wen said that the institutional reform of the State Council had basically been completed and that reform of local institutions was progressing steadily. New corporate tax laws had been put in place, long overdue price reforms for petroleum products had been “launched smoothly,” and draft proposals for medical and health system reform had been launched. China had improved the quality and diversification of its export markets, and had expanded the opening of its service industries. Overseas energy resource co-operation had been actively promoted, aid had been increased, and Chinese companies had been encouraged to “stride out.”
Wen said that the whole nation had united to deal with the Wenchuan earthquake, delivering the speediest relief efforts, the greatest mobilization and the biggest allocation of resources in history. The central government had provided 38.4 billion yuan in relief and 74 billion yuan of reconstruction funding. Support and donations had come from the whole of China, compatriots from Hong Kong, Macau, Taiwan and overseas, and from the international community.
While celebrating China's achievements over the past year (“the result of the correct leadership of the Party Central Committee, with Comrade Hu Jintao as the General Secretary”), Wen noted that China was facing unprecedented difficulties and challenges:
– the international financial crisis continued to deepen, with shrinking international demand and the rise of protectionism;
– the economic decline caused by the crisis was now the “main contradiction” leading to overcapacity in some industries, serious unemployment, declines in tax revenue and increases in government expenditure;
– China still suffered from its own chronic institutional and structural contradictions. Consumption demand was still too low, the development of tertiary industry was falling behind, innovation was weak, energy consumption too high, environmental pollution was serious, and the gap between rich and poor was widening;
– many issues of social security, education, health care and social order remained in urgent need of attention;
– there were serious problems with market management, and a “system of social trust” had not been established (there had been a number of serious incidents affecting food and production safety).
Major tasks for 2009
Wen pointed out that 2009 would be the most difficult year for the economy this century, but claimed that the long-term fundamentals underlying China's development had not changed and that China remained in a strong position to deal with the challenges it faced. China needed to “hold high the great banner of socialism with Chinese characteristics, take Deng Xiaoping Theory and the important thinking of the Three Represents as the guide.” The priorities were to maintain steady and relatively rapid economic growth, improve macro-controls, make every effort to expand domestic demand, accelerate strategic economic restructuring.
He announced the main macroeconomic targets as: GDP growth of “around eight per cent,” CPI increase to be held around four per cent, unemployment to be held below 4.6 per cent, urban employment to increase by nine million, the balance of payments to “continue to improve.” He then listed four main principles which should be followed in the course of the year:
– boost domestic demand and sustain economic growth;
– “make adjustments and improve levels”: continue with economic restructuring, shut down backward facilities;
– press ahead with reform and invigorate the economy;
– emphasize the people's livelihood and promote harmony.
Wen said that the main task for the year was coping with the global financial crisis and promoting steady and relatively rapid economic growth. To this end, the government would implement a four trillion yuan investment plan over two years of which 1.18 trillion would come from the central government in order to implement structural tax reduction and stimulate domestic demand. He then outlined seven areas of work on which special emphasis needed to be paid.
(i) Improving macroeconomic controls, and maintaining steady and relatively rapid economic development: Wen said that China needed a “flexible and prudent” macroeconomic control policy. China would follow a “proactive” fiscal policy. Government expenditure would be significantly increased as this was the most direct and effective way of raising demand. There would inevitably be a large increase in the government deficit because of falling tax revenues and increases in expenditure. The central fiscal deficit would be set at 750 billion yuan (an increase of 570 billion yuan from the previous year). The government would also allow local government to issue 200 billion yuan worth of bonds so that the overall deficit would be 950 billion yuan, which was “within three per cent of GDP.”
On tax reduction and reform, he said that the tax burden on enterprises and residents would be reduced.
On fiscal discipline, he added that a “relatively loose” monetary policy would be followed to support economic growth. Currency supply would increase by 17 per cent and new loans would total over 5 trillion yuan. Financial supervision would be strengthened. Cross border capital flows would be more closely monitored to “uphold financial stability and security.”
(ii) Vigorous measures needed to be taken to expand domestic demand, especially domestic consumption: measures would be taken to increase household spending, including further adjustments in income distribution, increased government spending on stimulating consumption and increased subsidies for peasants and low income urban residents. There would be new policies to promote car sales and develop markets for rental, leased and used cars. Measures would be taken to stimulate retailers, including the spread of franchise businesses into rural communities. The 40 billion yuan fund for subsidizing rural consumer expenditure (on home appliances, agricultural machinery, cars and motorcycles) would be well spent.
Investment would continue to grow at a fast pace. The central government would spend 908 billion yuan on investment in 2009. He insisted that this must go mainly on those areas that were crucial for tackling the current crises and on the weakest areas of economic and social development, and absolutely not on general processing industries.
The real estate market would be developed. There would be a series of measures designed to resolve within three years the housing problems of 7.5 million urban low-income families and 2.4 million households in forestry, reclaimed land and coal mine shanty towns. Forty-three billion yuan would be allocated to subsidize building low-rent housing for families on subsistence allowances and in difficulties. Buyers of second homes for personal use could apply for the same preferential loans as first-time buyers. The business tax on property transfers would be reduced according to the age of the property. The development of the market for second-hand homes and rental housing would be accelerated. Help would be given to urban migrant workers in housing difficulties and the pilot project on restoring dilapidated rural housing would be expanded.
There would be even more effort put into post-earthquake reconstruction: speeding up efforts on housing so that all victims were re-housed by the end of the year and 95 per cent of school students studying in permanent buildings in the same period. Overall it was intended to complete within two years the tasks that had originally been envisaged to take three years.
(iii) Agriculture: domestic grain production would be stabilized and an additional capacity of 50 million tons would be added. Agricultural structure would be readjusted in accordance with market demands. There would be considerable investment in infrastructure concentrating on water conservancy and irrigation, completing the task of building paved roads to all villages and townships by the end of 2010, and providing proper access to drinking water for 60 million people. Farmers' incomes would be raised. Renewed efforts would be made on poverty alleviation, with the implementation of new poverty alleviation standards raised to 1,196 yuan per person, covering 40.07 million people.
Investment in agriculture and the rural areas would be substantially increased. Central investment on the three rural issues would increase by 120.6 billion to 716.1 billion yuan. The lowest buying prices for grain would be raised by a large margin (with wheat and rice being raised by roughly 0.17 and 0.20 yuan per kg). Agricultural subsidies would be increased to 123 billion yuan, up by 20 billion yuan, including direct subsidies for grain and for many other agricultural products. New agricultural service systems would be introduced. Basic land contract relations would remain stable and without change for a long time. Any transfer of land rights must be lawful, voluntary and compensated. Farmland would remain protected and the government would not allow the total area to fall below its red line of 120 million hectares.
(iv) Further structural reform: key industries such as automobile, steel, shipbuilding, petrochemical, light industry, textile, non-ferrous metals, equipment manufacturing, electronic information and logistics would be further revitalized. It was necessary to concentrate on mergers and reorganization so that more successful enterprises would take over weaker ones, and increase the concentration and efficiency of resource allocation. More support would be given to small- and medium-sized enterprises. Encouragement would be given to technological innovation through setting up a 20 billion yuan special fund for technological renovation. A boost would be given to modern service industries.
The central government would increase its investment in science and technology by 25.6 per cent up to 146.1 billion yuan, which should be closely linked to stimulating domestic demand and promoting structural change. Full rein should be given to enterprises in driving technological innovation. The equipment manufacturing industry needed to be strengthened so that China could produce key equipment and components domestically. More research was needed in areas such as new energy, biology, medicine, 3G mobile communications, energy conservation and environmental protection.
Wen stressed the need to make “tireless efforts” in energy conservation, emission reduction and environmental protection. Energy-saving measures would concentrate on industry, architecture and transport. There would be efforts made to develop renewable and clean energy, with concentration on wind power, solar and nuclear energy. The use of clean coal technology would be promoted. There would be a nationwide drive on energy conservation and emission reduction. Wen pledged that efforts to prevent pollution in the major river basins would continue and new efforts would be made to counter desertification. State plans to deal with climate change and to raise China's capacity to do so would be implemented.
There would be a comprehensive drive to improve safety in production through a “quality and safety year.” This would concentrate in particular on the perfection and enforcement of safety standards in food production.
The development of the Western regions and revitalization of the old industrial bases in the northeast would continue, making the Eastern region take the lead in development and promoting co-ordinated development across the regions. The Eastern region needed to expand its international markets and accelerate the process of industrial transformation moving further up the supply chain.
(v) Deepening reform and opening up: Wen said that it was necessary to push ahead with price reform for resources, especially the prices for electric power. Water pricing reform would take place and the price of water for non-farming projects would gradually be raised.
Taxes would be reformed: the implementation of VAT reform would be pushed through, and taxes such as the urban construction tax and educational surcharges would be unified. Taxes on resources needed to be reformed, and the reform of real-estate taxes needed to be studied. Government administrative fees needed to be better organized and standardized. Budgetary organization would be improved, and the transfer system of central funds to the regions would be improved. County-level public finances would come directly under the control of provincial governments.
The financial system would be reformed, including the reform of state owned financial institutions. Small and medium sized institutions with diverse ownership and new rural financial institutions would be developed. The “healthy development of private financing” would be actively guided. There would be reforms of the capital market, bond markets would be regulated and a futures market developed. There would be market-based reform of interest rates, and the yuan exchange rate regime would be kept basically stable at a rational and balanced level.
Reforms in state-owned enterprises would be pushed forward with new structures and shareholding systems to “build sound modern enterprise systems.” Reform in the railways, electricity and salt production industries would be speeded up. The management of civil aviation and telecommunications systems would be improved. Wen said that they would encourage support and guide the development of the non-public economy.
The government would work to maintain stable growth in external trade. Although it was necessary to expand domestic demand, “we must never be lax with exports.” China would fully utilize “financial and tax policies commonly used internationally” to support exports; financial services for imports and exports would be improved with greater export credit and loans; the processing trade would be upgraded and transformed; there would be new policies to encourage trade in services and especially to encourage the outsourcing of international services to China. China would strive to increase its imports focusing on advanced technologies, energy resources and raw materials. Internationally, China would actively support the Doha Round, promote free trade areas, and properly handle trade friction. It would continue to implement its own “go global” strategy, and support outward investment and transnational mergers and acquisitions by various enterprises.
(vi) Developing social welfare programmes: the first priority was to stimulate employment. The Government would allocate 42 billion yuan for a proactive employment policy. High priority would be given to the employment of university graduates, and incentives would be given to those who chose to work in the rural areas or enlist in the army. Institutions of higher learning would be encouraged to employ qualified graduates on their research projects and would be given government benefits for so doing. Employment opportunities for migrant workers would be expanded, and employers would be encouraged to seek alternatives to layoffs through renegotiating contracts, adopting flexible working hours and so on. More public service jobs would be created to help urban residents and workers in disaster-stricken areas. A series of preferential policies would be established to encourage new businesses, and support would be given to people, including migrant workers, who had returned to their villages to start their own businesses. Public support for job seekers, through the provision, of information, guidance and vocational training, would be increased.
More improvements would be made to the social security system. The old-age insurance system would be improved, with further work on the pilot project. The general social security coverage would be extended with a focus on employees in the non-public sector, migrant workers, farmers whose land has been expropriated, people with flexible employment and freelancers. Social security benefits would be raised: the basic old-age pension for corporate pensioners would be increase by about ten per cent; there would be increases in unemployment insurance and work related injury insurance. Central government would increase its spending on social security by 17.6 per cent to 293 billion yuan. Local government would also be expected to increase their spending.
Education would remain a priority, and plans would be drawn up for educational reform up to 2020. Over the next five years the government would focus on five areas. Firstly, education equality: there would be free compulsory education in both rural and urban areas, and public expenditure per pupil in the rural areas would go up to 300 yuan and to 500 yuan for those in primary and secondary education; there would be various measures to provide financial support for the disadvantaged and a pledge to “fundamentally resolve the debt issue in nine-year compulsory education in rural areas.” Second, improvements would be made in vocational education in the rural areas with the aim of gradually making secondary vocational education free. Third, teachers' wages would be increased and a performance-based system would be introduced for all primary and secondary teachers (the central government would allocate 12 billion yuan for this, in addition to local government funding). Fourth, the quality of education would be improved, with reforms to the curriculum, teaching materials, and test and assessment systems. Students needed to be liberated “from the burden of excessive school work.” Lastly, a programme of upgrading safety conditions in schools would be implemented.
Wen announced another five missions for improving the health service. A basic health security system needed to be established, and within three years 90 per cent of the population would be covered by one form or other of health insurance system. A national drugs system would be established and a unified catalogue of basic drugs published. A network of grassroots clinics would be established. This year 29,000 township-level clinics would be built, and within three years the central government would build 5,000 rural clinics, 2,000 county-level hospitals and 2,400 district medical centres in urban areas. The management and operation of hospitals needed to be reformed, separating management from business, administration from operation and so on. In the next three years, the government would allocate a total of 850 billion yuan to support health care reform.
Family-planning work would continue to be properly handled to maintain a low birth rate. In rural areas a policy of subsidized hospitalized childbirth would be implemented, including medical checks before and after birth. The rewards for rural households for following the family planning policies would be increased to 720 yuan from 600 yuan per person.
Wen also announced the intention to vigorously develop culture and sports; to strengthen the building and administration of “internet culture” and to protect the nation's cultural heritage.
Wen said the government would strengthen the building of democracy and the legal system, and push forward reform of the political system and the development of socialist democracy. This would include implementing democratic elections, decision making, administration and supervision according to the law. Self-governance at grassroots levels needed improving to ensure that the masses “directly exercise their democratic rights.” Transparency and participation in legislative work would be increased and the government would aim to achieve “standardized, fair and civilized law enforcement.”
It was essential to maintain harmony and stability in society. Special attention should be paid to handling people's complaints and protecting their legitimate rights and interests. The mechanisms for handling and resolving social tensions and disputes needed improving. Senior officials should deal with people's letters and visits properly. There needed to be an early warning system to help prevent and handle properly all types of “mass incidents.” There would be a series of intensive campaigns to ensure peace and security and maintain law and order.
(vii) Further reform government and improve its capacity to manage socio-economic development: much had been achieved in this area, but problems of formalism and bureaucracy were still pronounced. Government affairs would be run in accordance with the law to ensure that they were executed through proper procedures and were highly efficient and convenient for the public. Government affairs would be made more open and transparent: “we will let the masses know what the government is thinking and doing so that we can win their full understanding, wide support, and active participation.”
Government at all levels should accept the democratic supervision of the People's Congresses. Work style should be improved. Leading officials should keep close contact with the people and be concerned for their sufferings. Officials at all levels should be high spirited and enthusiastic. It was necessary to intensify the work on building honest government and fighting corruption. Corruption cases needed to be dealt with promptly and corrupt elements punished according to the law.
(viii) National Defence: the section on defence was brief. The armed forces had made major progress over the past year. In the coming year efforts would be focussed on making them more revolutionary, modernized and standardized, in order to fulfill the army's historical mission in the new century and the new stage. The armed forces would move from training under mechanized conditions to training under informatized conditions. Weapons, equipment and logistics support would be modernized. Emphasis on scientific research and the development of new weapons and equipment would continue. It was necessary to promote military reform and enhance army building.
(ix) Hong Kong, Macau and Taiwan: Wen said the government would give its full support to the administrations of Hong Kong and Macau in dealing with the international financial crisis. Co-operation between the mainland and the two Special Administrative Regions would be enhanced to reinforce Hong Kong's position as a centre of international finance and promote the development of Macau's economy. The pilot programme of settling trade in yuan would be pushed forward. Infrastructure projects such as the Hong Kong–Shenzhen–Zhuhai Bridge, the rail connection between Hong Kong and Shenzhen airports, and the Guangzhou–Shenzhen–Hong Kong express rail link would be pushed forward. He said that the motherland would always offer a powerful backing to Hong Kong and Macau and that he was convinced that they would be able to overcome their current difficulties and look forward to a more beautiful future.
Wen noted the positive changes in cross-Strait relations over the past year, which had achieved a major breakthrough. Consultations had been restored on the basis of the “1992 consensus,” and the “three links” had been realized. Exchanges of all types were more frequent. In the coming year, China would adhere to the principle of developing cross-Strait relations and promoting peaceful reunification. China would continue close economic co-operation in response to the global financial crisis. Co-operation would be increased in financial matters, investment and industry and agriculture. China would speed up the “normalization” of relations and facilitate the signature of a comprehensive agreement on economic co-operation.
Politically, China was ready to make fair and reasonable arrangements through co-operation on the issue of Taiwan's participation in the activities of international organizations, to hold talks on cross-Strait political and military issues and create conditions for ending the state of hostility and concluding a peace agreement between the two sides.
(x) International Diplomacy: Wen highlighted the co-operation with the international community in tackling the global financial crisis. China had enhanced the mutual trust and pragmatic co-operation between Asian and European countries. It had actively conducted bilateral and multilateral diplomacy and played a constructive role in global and regional hotspot issues. China's international standing and influence had risen to new heights. In the coming year, China would adhere to its independent foreign policy and firmly pursue an open strategy of mutual benefit. It would deepen its international co-operation across the board, and work to curb the spread of the global financial crisis. China would promote reform of the international financial system, and oppose trade and investment protectionism.
The Session closed on 13 March. It was again chaired by Wu Bangguo and attended by top leaders. The Session approved the “Report on the Work of the Government,” by 2,824 votes out of 2,898 deputies present. The Session also adopted resolutions approving the national development plan, the budget, and the work reports of the NPC Standing Committee, the Supreme People's Court and the Supreme People's Procuratorate.
Wang Shengjun, President of the Supreme People's Court, presented the annual report on the work of the courts to the National People's Congress on 10 March (text in XHNA, 17 Mar.). He said that in the past year the Supreme Court had handled 10,533 cases and concluded trials in 7,725 cases (increases of 29 and 24 per cent respectively). Courts across the country had handled 10,711,275 cases and concluded trials and enforcement actions in 9,839,358 cases (increases of 11 per cent). There were significant increases in the numbers of cases handled relating to business disputes (financial disputes, real estate cases, enterprise restructuring cases, cases involving stock ownership transfers, foreign related cases and maritime and maritime trade cases) which went up by about 15 percent. Agricultural related cases, included cases involving the rights of migrant workers who had returned to their home towns, went up by about 35 per cent. IPR related cases went up by about 33 per cent (to a total of 27,876 cases nationwide). There were 768,130 criminal cases involving the sentencing of 1,007,304 criminals of whom 159,020 received severe sentences from five years to capital punishment. Special attention was noted for the punishment given to crimes that endangered national security, violent crimes that seriously endangered social order, crimes involving gangland forces and narcotics related crimes. There was a 94 per cent increase in the number of cases involving labour disputes which went up to 286,221 nationwide.
Wang admitted that there were still problems that needed to be handled. There were still serious shortcomings in the judiciary where judges either did not properly understand the concept of “practising the socialist rule of law” or lacked the capabilities to deal with the new challenges, leading to proper procedures not being followed and laws not being applied accurately. Some judges were not properly aware of the “need to administer justice for the people” and were over-bureaucratic in their attitudes, and there were still “a handful” who were corrupt.
c Party and Political Affairs
Central Discipline Inspection Commission
The Central Discipline Inspection Commission held a plenary session on 13 January, attended by President Hu Jintao and the senior Party leadership. He Guoqiang, Secretary of the Commission, delivered a speech calling for improvement in the systems for preventing and punishing corruption. It was revealed that the 4,960 officials above the county-head level had been punished over the last year to November (XHNA, 14 Jan.). Hu Jintao gave an important speech to the meeting on anti-corruption work. He noted the successes that had been achieved in strengthening Party discipline and preventing corruption in recent years. He said that China had made good progress in developing a cadre of honest and upright officials, but that it was necessary to make even further efforts in order to win the people's trust and provide a strong guarantee for stable development and reform. Hu identified four principal tasks for future work in this respect:
– to carry out supervision and inspection properly and diligently and ensure that the Party's polices and plans for promoting economic growth are properly carried out;
– to ensure that leading officials were more honest and self aware and able properly to implement the rules for official discipline and supervision;
– to make even greater efforts to investigate actual cases and to solve problems of corruption in key areas such as abuse of power, bribery, moral degeneration and dereliction of duty by senior officials;
– to deal seriously with complaints from the people and make sure that people's interests were properly protected (XHNA, 17 Jan.).
Following the meeting, the Commission issued a circular on 15 January urging discipline inspection and supervision organs at various levels “to seriously study and implement Hu Jintao's important speech delivered at the Third Plenum of the 17th Central Discipline Inspection Commission on 13 January, promote the building of the party's work style and a clean and honest government and the anticorruption struggle at a deeper level, earnestly strengthen the party character cultivation and the establishment and development of a fine work style of leading cadres, and ensure the implementation of the scientific development concept with a strong party character and an excellent work style” (XHNA, 16 Jan.).
Politburo Meetings
The Politburo held a meeting on 23 January, chaired by General Secretary Hu Jintao, to study the scientific outlook on development. In a statement issued after the meeting it urged Party members to do the same in order to promote economic growth, social stability and the governance capacity of the Party. It noted that the top priority was to maintain fast and steady economic growth, to adjust the country's industrial structure and improve the people's livelihood. It noted problems over unemployment, environmental impact, and the lack of innovative capacity in industry, as well as difficulties in maintaining the development of rural living standards (XHNA, 23 Jan.).
The same day the Politburo held its 11th Study Session on the question of agricultural modernization. They were addressed by Professor He Xiurong of the China University of Agriculture and Han Jun from the State Council Development Research Centre. Hu Jintao made a speech outlining his views on the current priorities for agricultural development. (XHNA, 24 Jan.).
On 23 February the Politburo held a meeting, chaired by General Secretary Hu Jintao, to discuss the draft Report on the Work of the Government. (XHNA 23 Feb.). The Politburo held a panel study session on 24 February which was addressed by two academics, Zhao Jinping of the State Council Development Research Centre, and Bi Jiyao of the Macro-economic Research Institute, on the subject of the world economic situation and ways to boost economic growth. General Secretary Hu Jintao gave a speech in which he said that China needed to be prepared for complicated and difficult situations in the world economy, and the government should maintain its policy of giving priority to economic growth and increasing domestic demand (XHNA, 24 Feb.).
Senior Appointments
Hu Chunhua was formally elected Governor of Hebei province at the Second Session of the 11th People's Congress on 12 January. Hu had been acting Governor since 2008. Aged 46, he had previously been First Secretary of the Communist Youth League and before that a Deputy Secretary of Tibet Regional Party Committee (XHNA, 12 Jan.).
Bagatur was elected Chairman of Inner Mongolia Regional People's Government at the Second Session of the 11th Regional People's Congress on 12 January. Aged 54, he had been acting Chairman since April 2008. Before that he had been Secretary of the Inner Mongolia Communist Youth League (XHNA, 12 Jan.).
Wang Jun was formally elected Governor of Shanxi province at the Second Session of the 11th Provincial People's Congress on 15 January. He had been appointed acting governor of the provinces in September 2008 when he took over from the previous governor who had resigned following a disastrous mud slide in which 277 people died. Wang had previously worked as Head of the State Administration of Work Safety and before that he had been deputy head of China's coal industry authority and a deputy governor of Jiangxi province. He is 56 (XHNA, 15 Jan.).
Guo Gengmao was formally appointed Governor of Henan province at the Second meeting of the 11th Provincial People's Congress on 17 January. He had been appointed Acting governor in March and concurrently Deputy Secretary of the Henan Provincial Party Committee. Aged 58, he had spent all his previous career in the administration of the neighbouring province of Hebei (XHNA, 17 Jan.).
d Defence
China's defence White Paper was released on 20 January (“China's National Defence in 2008,” full text in XHNA 21 Jan.). The document consisted of 14 Sections: The security situation; National defence policy; Reform and development of the PLA; The army; The navy; The air force; The second artillery force; The People's Armed Police; National defence reserve build-up; The armed forces and the people; Science, technology and industry for national defence; Defence expenditure; International security co-operation; Arms control and disarmament; and six appendices.
China's defence posture was stated to be purely defensive, placing the protection of national sovereignty, security, territorial integrity, safeguarding of the interests of national development, and the interests of the Chinese people above all else. China's basic policies were explained as upholding national security and unity and ensuring the interests of national development; achieving an all-round and sustainable modernization of China's armed forces; improving the armed forces' performance with informatization as the major yardstick; pursuing active defence and a self defensive nuclear strategy; building a security environment to support China's peaceful development. The strategic framework for China's armed forces' development was to actively push forward the “RMA with Chinese characteristics” focussing on informatization. On this basis it planned to lay a solid foundation by 2010, basically achieve mechanization and make major progress in informatization by 2020, and by and large achieve full modernization of the armed force by the mid-21st century.
On 6 January a flotilla of Chinese naval vessels (consisting of two destroyers and one support vessel) was deployed on anti-piracy duties to the Gulf of Aden, the first such overseas deployment by the Chinese. China promised that if vessels from Hong Kong, Macau, or Taiwan needed the naval vessels' escort services, they could propose this to mainland China through relevant channels (XHNA, 13 Jan.). According to Xinhua, in 2008 1,265 Chinese merchant vessels had passed through the Gulf of Aden and seven had been attacked by pirates (XHNA, 31 Jan.).
e Statistical Communiqué on National Economic and Social Development during 2008
[Note: The figures showing percentage changes in production over 2007 are taken verbatim from the National Bureau of Statistics [NBS] communiqué. They do not always coincide with the estimates that would be obtained from a comparison of the 2008 estimates with those for 2007 given in “Quarterly Chronicle” in CQ, No, 194, pp. 487–96.
Data in square brackets show data/annual percentage increases in 2008 over 2007, and are included for comparative purposes.]
The latest statistical communiqué was issued by National Bureau of Statistics (NBS) on 26 February (www.stats.gov.cn/enGliSH/newsandcomingevents/t20090226_402540784.htm). As in the previous two years, the brief introductory remarks highlighted the role of the “scientific approach” in guiding China's development under the guidance of “Deng Xiaoping Theory and the important thought of ‘Three Represents’.” Passing reference was also made to the challenges of combating natural and man-made disasters (the latter in the form of the global financial crisis).
The main features of China's economic performance in 2008 are summarized below.
Overview
Preliminary estimates indicated that in 2008, GDP rose by 9 [11.4] per cent in terms of comparable prices to reach 30,067 billion yuan. All three major sectors shared in this performance. In contrast to secondary and tertiary sectors, agricultural growth accelerated quite sharply in 2008, rising from 3.7 to 5.5 per cent. Nevertheless, primary sector growth was still significantly lower than that of both industry (9.3 [13.4] per cent) and services (9.5 [11.4] per cent). Sectoral shares of GDP were 11.3 [11.1] per cent (primary), 48.6 [48.5] per cent (secondary) and 40.1 [40.4] per cent (tertiary).
Agriculture
2007 saw a further expansion of the grain sown area by 1.06 million hectares (ha) to 106.7 million ha; the sown areas of sugar and oil-bearing crops both increased (by 0.13 and 1.39 million ha, respectively), the area under cotton once more declined (by 0.17 [0.07] million ha).
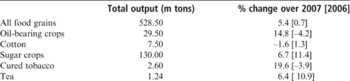
The output of major farm crops is shown in Table 1.
Output of Major Farm Products

Total meat output rose by 5.9 [3.5] per cent to 72.69 m tons. The previous year's decline (by 9.2 per cent) in pork output was reversed, with total production increasing by 7.6 per cent to 46.15 m tons. However, output of beef and mutton both declined, by 0.5 [+6.1] and 1.8 [+5.8] per cent, respectively. Total output of aquatic products was 48.95 m tons, or 3.1 per cent more than in 2007. Timber production increased by 13.8 [5.5] per cent to 78.94 million cubic metres.
Effective irrigation was extended to an additional 1.179 [1.07] million ha of arable land, in addition to which an extra 1.39 [1.36] million ha were brought under guaranteed water-saving irrigation facilities.
Industry
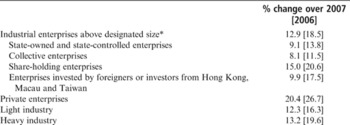
Industrial value-added grew by 9.5 [13.5] per cent in 2008. Further details are given in Table 2.
Rate of Growth of Industrial Value-added, 2008

Note: * i.e. all state-owned enterprises and those non-state-owned enterprises with an annual sales income over 5 million yuan.
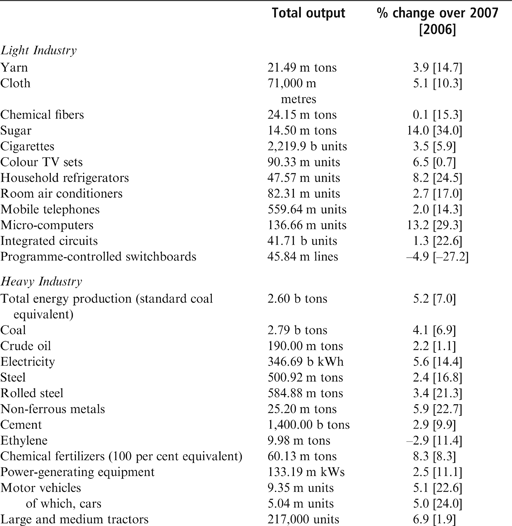
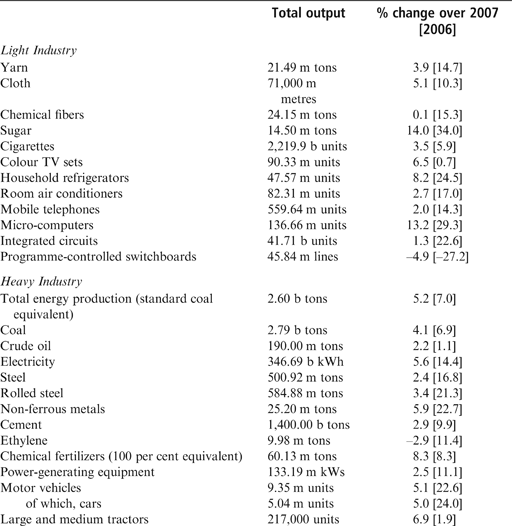
The outputs of important industrial products are shown in Table 3.
Output of Major Industrial Products, 2008
As the following figures show, industrial profitability continued to improve in 2008, albeit at a much slower rate than in 2007. The overall rate of increase in profits in enterprises of above-designated size was 4.9 [36.7] per cent (January–November only). Concealed in this figure were the following changes in profitability by different enterprise ownership category during the same period:

The construction industry growth slowed from 12.6 to 7.1 per cent, and construction enterprises generated profits of 175.6 billion yuan (12.6 [23.2] per cent above the 2007 level).
Fixed investment
In 2008 the rate of expansion of fixed asset investment increased marginally (from 24.8 to 25.5 per cent). Relevant disaggregated data are shown in Table 4.
Fixed Investment Growth by Sector and Region

Urban investment in the primary sector rose by a remarkable 54.5 [31.1] per cent in 2008; the corresponding figures for urban secondary and tertiary fixed investment were 28.0 [29.0] per cent, and 24.1 [23.2] per cent. Regional levels and rates of fixed investment in 2007 were as follows:

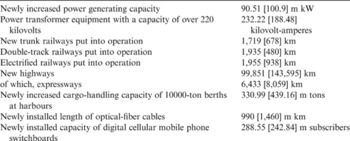
Table 5 summarizes the net impact of capital construction investment on production capacity in 2008.
New Increases in the Production Capacity of Selected Industries, 2008

Transport and telecommunications
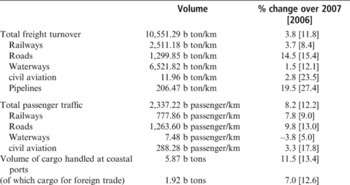
There was continued growth in both passenger and freight transport in 2008, as shown in Table 6.
Passenger and Freight Traffic in 2008

The turnover of post and telecommunication services increased by 20.7 [26.4] per cent. The total number of fixed-line subscribers fell to 340.81 million [365.45] – 232.0 [248.59] million in cities, and 108.81 [116.86] million in rural areas. There were 93.9 [86.23] million new mobile phone subscribers, taking the total number of users to 641.23 [547.29] million at the end of 2008. Thus, the total number of telephone users reached 982.04 [912.73] million; on average, telephone coverage reached 74.3 [69] for every 100 members of the Chinese population. The number of Internet users rose from 210 to 300 million and broad-band users reached 270 [163] million.
China received 130.03 million international visitors in 2008 – 1.4 per cent fewer [+5.5] than in 2007. Of these, 24.33 [26.11] million were “foreigners” (a fall of 6.8 per cent [+17.6]); and 105.70 [105.76] million were “Chinese compatriots” from Hong Kong, Macau and Taiwan (down by a mere 0.1 [+2.9] per cent). Foreign exchange earnings from international tourism totalled US$40.8 billion, or 2.6 per cent less than in 2007. Some 45.84 [40.95] million Chinese made overseas visits, of whom 40.13 [34.92] million undertook private visits (up 14.9 [21.3] per cent). Revenue from domestic tourism was 874.9 billion yuan (a rise of 12.6 [24.7] per cent).
Domestic trade
In 2008, real growth in the value of retail sales of consumer goods was 21.6 [16.8] per cent to reach 10,848.8 billion yuan (up by 22.1 [17.2] per cent in cities, and 20.7 [15.8] per cent in rural areas). More disaggregated estimates of sales growth are shown below (all figures in percentages):

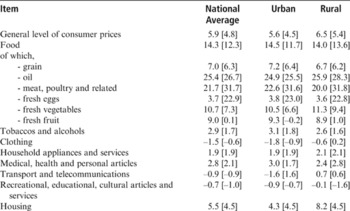
The rate of price inflation quickened slightly in 2008. The general consumer price index rose by 5.9 [4.8] per cent. Manufactured goods producer prices increased by 6.9 [3.1] per cent; and purchase prices for raw materials, fuels and power by 10.5 [4.4] per cent. As in the previous year, the sharpest increase was that of agricultural producer prices, which rose by 20.3 per cent. The rise in sales prices for housing in 70 large and medium cities also fell from 7.6 per cent (2007) to 7.1 per cent.
Consumer price changes for specific goods, or categories of goods, are shown in Table 7.
Change in the Consumer Prices of Selected Goods, 2008 [2007] (%)

Foreign trade and external relations
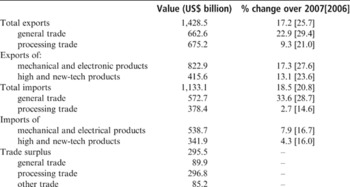
Under the impact of the global economic downturn, the recent remarkable momentum of foreign trade growth slowed during 2008 (see Table 8). The combined value of exports and imports rose by 17.8 [23.5] per cent to reach US$2,561.6 billion. The value of China's exports was US$1,428.5 billion (up by 17.2 [25.7] per cent), while imports increased by 18.5 [20.8] per cent to US$1,133.1 billion. Foreign-funded enterprises generated exports worth US$790.6 billion (up by 13.6 [26.9] per cent); the value of their imports rose by 10.8 [18.4] per cent to US$620 billion. The corresponding figures for state-owned enterprises were US$257.2 and US$353.8 billion (recording rises of 14.4 and 31.1 per cent, respectively). Overall, China enjoyed a merchandise trade surplus of US$295.5 billion, or US$32.8 [$84.7] billion more than in the previous year.
Levels of and Changes in Imports and Exports, 2008

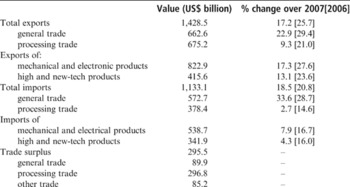
A geographical breakdown of China's exports is shown in Table 9.
The Direction of China's Foreign Trade, 2008

Inflows of utilized foreign direct investment (FDI) increased by 23.6 [13.6] per cent to reach US$92.4 billion. Manufacturing absorbed $49.9 billion – 22.1 per cent more than in 2007, and a further $18.6 billion were allocated to real estate (up by 122.5 per cent).
At the end of 2008, China's foreign exchange reserves totalled US$1,946 billion – US$417.8 billion more than a year earlier. During the same period, the exchange rate showed a 6.9 per cent appreciation – the same as in 2007 – to RMB6.8346 to US$1.
Banking and insurance
The NBS Communiqué noted that at the end of 2008, savings deposits lodged in all kinds of financial institutions totalled 47,844.4 [40,105.1] billion yuan, 19.3 [16.0] per cent higher than at the end of 2007. Savings by enterprises reached 16,438.6 billion yuan – a rise of 13.5 [21.8] per cent. Savings by urban and rural residents totalled 22,150.3 billion yuan (up 25.7 [5.8] per cent).
The volume of cash in circulation (M0) rose by 12.7 [12.2] per cent to 47.5 trillion yuan; the corresponding rates of increase for narrow (M1) and broad (M2) money were 9.1 [21.1] per cent, and 12.7 [16.7] per cent.
Welfare, living standards and employment
Per capita cash disposable income of urban residents reached 15,781 [13,786] yuan in 2008 [2007] (a real rise of 8.4 [12.2] per cent over that of the previous year). Rural residents' average per capita net income was 4,761 [4,140] yuan: this represented a real increase of 8.0 [9.5] per cent. The urban and rural Engel coefficients were 37.9 [36.3] and 43.7 [43.1] per cent, respectively. The number of rural residents living in poverty (i.e. with an annual net per capita income of less than 1,196 yuan) was estimated to be 40.07 million.
There were also improvements in both urban and rural social security provision. By the end of 2008, 218.9 [201.07] million people (165.97 [151.56] million employees and 52.93 [49.51] million retirees) were enrolled in basic pension programmes. Some 124 [116.45] million urban residents had joined unemployment insurance schemes, while 316.98 [220.51] million were covered by basic health insurance (including 42.49 [31.31] million migrant workers). Work accident insurance was provided for 138.1 [121.55] million people, including 49.76 [39.66] million migrant workers. Some 91.81 [77.55] million were enrolled in maternity insurance programmes. For the second year running, the number of people who received unemployment insurance payments fell – from 2.86 to 2.61 million. Finally, 23.34 [22.71] million urban residents were in receipt of minimum income relief from the government, while the corresponding figure for rural residents was 42.91 million, or 7.25 million more than in 2007.
Total employment in 2008 was 774.8 million (4.9 million more than in 2007). The net increase in urban employment was 8.6 [10.4] million, and total urban employment was 302.1 [293.50] million. The official rate of registered urban unemployment was 4.2 per cent –0.2 per cent above that of 2007.
Population
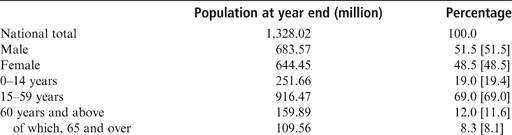
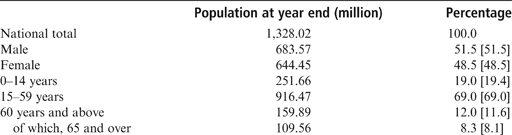
China's total population at the end of 2008 was 1,328.02 [1,321.29] million. Of this total, urban residents numbered 606.67 [593.79] million (45.7 [44.9] per cent of the total); rural residents totalled 721.35 [727.5] million, or 54.3 [55.1] per cent of the total.
Vital rates for 2008 are shown in Table 10; the sex ratio and age structure of China's population are shown in Table 11.
Vital Population Rates, 2008 [2007]

Sex Ratio and Age Structure of China's Population, 2008 [2007]
Resources and environment
There was a net reduction of 19,300 [40,700] ha of arable land in 2008. Concealed in this figure was the use of 191,600 [188,300] ha of farm land for construction, the destruction of 24,800 [17,900] ha as a result of “disasters,” the conversion of 7,600 [25,400] ha to land for “ecological preservation” and the loss of 24,900 [4,900] ha as a result of structural adjustments within agriculture. To offset such losses, land reclamation and re-development programmes added 229,600 [195,800] ha of arable land.
After two years of decline, in 2008 the average per capita availability of water increased to 2,048 [1,876] cubic metres. At the end of the year, water storage in China's large reservoirs was 196.2 [186.9] billion cubic metres. Total water consumption increased by 0.4 [–0.6] per cent to 584 billion cubic metres. Of this, consumption for living purposes increased by 0.6 [1.6] per cent, and for industrial use by 1.8 [2.7] per cent; but for the second year running, water consumption for farm use fell by 0.2 [–2.2] per cent. Per capita water consumption averaged 440.9 [437] cubic metres. Water consumption per 10,000 yuan of GDP and per 10,000 yuan of industrial value-added declined by 7.9 [–10.8] and 7.0 [–9.5] per cent, respectively.
Based on monitoring of 409 sections of China's seven major water systems, 55 [50] per cent satisfied the national quality standard of Grades I–III for surface water, while 20.8 [23.5] per cent fell below Grade V level. There was also an improvement in the quality of oceanic water, although 137,000 [145,000] square kilometres of seawater failed to meet the quality standard of “clean” seawater. Of this, 25,000 [29,000] square kilometres were described as being seriously polluted.
Natural disasters posed an even more serious economic threat in 2008 than in 2007. Direct economic losses occasioned by disasters totalled 1,175.2 billion yuan – a four-fold increase, compared with the previous year [236.3 billion yuan]. The Wenchuan earthquake in Sichuan alone caused economic losses of 845.1 billion yuan. However, the area of crop land affected by natural disasters fell from 48.99 to 39.99 million ha. Meanwhile, man-made disasters continued to exact a heavy toll, although in 2008 the number of traffic accidents – 265,000 [327,000] – for the fourth year running showed a significant decline. Some 73,000 [82,000] people were killed and 305,000 [380,000] were injured in such accidents. Traffic accidents caused direct property losses estimated at 1.01 [1.2] billion yuan. The death toll as a result of work accidents in mining, industrial and commercial enterprises fell by 10.2 per cent to 91,172. In particular, the death toll associated with the production of each million tons of coal declined by 20.4 per cent.
Newly discovered mineral resources included 1,340 [1,210] million tons of crude oil, 647.2 [697.4] billion cubic metres of natural gas, and 23,110 [40,620] million tons of coal.
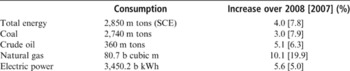
The preliminary 2008 estimates of energy consumption provided by the NBS communiqué are shown in Table 12.
Consumption of Energy, 2008

f Tibet
The year 2009 marks a series of sensitive political anniversaries in Tibet. It is 50 years since the Tibetan uprising and flight of the Dalai Lama in March 1959, 20 years since the imposition of martial law in 1989, and one year since the disturbances in Lhasa and elsewhere. China has also highlighted the emancipation of the serfs in 1959, following the imposition of full Chinese rule, comparing its historical significance to the US emancipation of the slaves in the Civil War. As a result, there was a great deal of Chinese media and other attention on Tibet in the first quarter, with China forcefully arguing its case for the benefits it has brought to Tibet in the 50 years since 1959, and rebutting and excoriating the position of the Dalai Lama and the Tibetan Government-in-exile.
The Information Office of the State Council published a White Paper on “50 Years of Democratic Reform in Tibet” on 2 March. The paper was divided into three main sections: Old Tibet – A Society of Feudal Serfdom under Theocracy; Momentous Democratic Reform in Tibet; and Tremendous Historic changes over the Past Half Century. The publication was timed to coincide with the 50th anniversary of the Tibetan uprising and the flight of the Dalai Lama in 1959, and to put the Chinese case in full detail. The White Paper reiterated that Tibet had been an inseparable part of China since ancient times. It argued that prior to 1959 Tibet had been a society of feudal serfdom under theocratic rule which had been considerably more oppressive than medieval Europe. It put China's argument in considerable detail, using occasional quotations from Western visitors to Tibet and some modern historians of Tibet to back up certain points. The first section outlined China's interpretation of the social and political structure in Tibet before 1949. The second outlined the gradual changes introduced following the 17 Point Agreement on the Peaceful Liberation of Tibet in 1951, against a background of continued resistance and foot dragging by the old regime personified by the Dalai Lama. This culminated in what was described as the armed rebellion of 1959, which had been “supported from the very beginning by foreign anti-China forces.” The third section described the changes that had taken place in Tibet since 1959 and the great strides that had been taken in its social, economic and political development during that time.
The White Paper stated that tremendous changes had taken place in Tibet over the past 50 years moving it from a state of abject poverty and oppression to the “best period of historical development with rapid economic and social progress, cultural prosperity, improved living conditions, national unity, good government and harmonious people.” It argued that the abolition of serfdom in 1959 had been an event of world significance and a major step forward for human rights in China, which it compared with the abolition of slavery in the United States. The Dalai Lama “and his political clique” were described as the chief representatives of the old system who had fundamental conflicts of interest with the Tibetan working people. It claimed that the “Dalai clique” was destined to remain opposed to democracy and unwilling to concede defeat. Since his flight in 1959, he and his supporters had never stopped trying to restore the old system, and to mislead the international community by pretending to speak on behalf of the Tibetan people. It stated that the essential differences China had with the Dalai Lama were not merely over questions of autonomy, but were a “struggle between progress and retrogression, and between unity and separation.” The White Paper complained that “anti-China forces in the West” ignored historical facts and fundamentally misassessed the situation when they described the Dalai Lama as a “guardian of human rights” or a “spiritual leader” or accused China of “trespassing on human rights” in Tibet. It claimed that the “Tibet Issue” resulted in fact from attempts by the imperialist powers to turn China into a colony or semi-colony. It claimed that uprising in 1959 had been instigated and supported by imperialist forces, and ever since then Western forces had continued to train and support the “Dalai Lama clique” in their activities to split and sabotage China. The White Paper argued that history was on the side of China and showed that the old order could never be restored. The will of the people of all ethnic groups in China was for a Tibet that would never be shaken from “national unity and sovereignty.” Tibetan independence could never succeed, nor would the Dalai Lama get any further with the attempts to seek “semi-independence or covert independence under the banner of a high degree of autonomy.” The only way forward for him was to give up independence and concede that Tibet is an inalienable part of Chinese territory, to disband the government-in-exile, and stop “all activities aimed at splitting the country.” It concluded that “the 14th Dalai Lama must thoroughly reflect upon and correct his political positing and behaviour. The Central Government has opened and will always keep its door open for the 14th Dalai Lama to return to a patriotic stand” (Text in XHNA, 2 March).
In a similar vein, a further report on the developments in Tibet over the past 50 years was published on 30 March (Full text in XHNA 30 March). It was produced by the China Tibetology/Research Centre and was entitled “Report on the Social and Economic Development of Tibet.” This was a comprehensive view of economic and social development in Tibet since 1959.
China showed itself pushing hard on the Tibet issue in its international relations, and there was a considerable amount of reporting on Chinese activity in this regard. Meeting a delegation from the Chinese Communist Party, the Cypriot President told them that some Western powers had advocated the independence of Tibet but that for his part he reaffirmed Cyprus' commitment to its one-China policy (XHNA, 20 February). On 7 March, Foreign Minister Yang Jiechi said at a press conference that other countries should not allow the Dalai Lama to visit or engage in any form of “separatist” activity in their territory. He said that the Dalai Lama was a political not a religious figure and claimed that his aim was to establish a “Greater Tibet” in one quarter of Chinese territory, remove Chinese armed forces from Tibet, and drive out all non-ethnic Tibetans from Tibet (XHNA, 7 March). The Chinese reacted strongly to the European Parliament passing a resolution on Tibet on 12 March, expressing their strong indignation at and opposition to “an act that intervenes in China's internal affairs, damages China–Europe relations and hurts the Chinese people's feelings” (XHNA, 13 March). A US House of Representatives Resolution on Tibet passed on 11 March was condemned in similar terms. The Foreign Ministry spokesman said: “the resolution disregards the real situation in Tibet and makes groundless accusations against China's religious policies. It glorifies the Dalai Lama's secessionist activities over the years and runs counter to the norms of international relations.” He added that “the resolution rudely intervenes in China's internal affairs. The Chinese government and people are strongly dissatisfied and firmly opposed to it”(XHNA, 12 March). It was reported on 23 March that South Africa had refused a visa to the Dalai Lama. The spokesman for South Africa's Presidential Office explained that the decision had been made in order to prevent attention being diverted away from the World Cup preparations. He said that the decision had been South Africa's, not China's, and the issue was simply that the visit would not be in the best interests of South Africa at the current time (SAPA News Agency, Johannesburg, 23 March). The Moroccan Foreign Minister was quoted by the Chinese press as saying that Morocco firmly supported the Chinese government on issues relating to Tibet. He was said to have accused Western countries of exaggerating and distorting reports about Tibet and demonizing the Chinese government (XHNA, 19 March).
g Economic Affairs
Employment: data from the Ministry of Human Resources and Social Security showed that there were real problems in finding jobs for 6.1 million college graduates in 2008, compounded by the continued unemployment of 1.5 million graduates from the previous year (XHNA 11 January).
A circular was issued by the General office of the State Council on 19 January on ways of encouraging employment for graduates. It described the situation as extremely grim and said that college students faced much greater pressure than before in finding jobs. It ordered all areas to regard finding employment for college graduates as the top priority of the current employment work and to “take realistic and effective measures; increase employment channels; encourage college graduates to find jobs at the urban and rural grass roots, in the central and western regions, and at small- and medium-sized enterprises; encourage college graduates to start undertakings independently; and encourage key enterprises and scientific research projects and units to employ college graduates and to stabilize the employment of college graduates.”
Measures included various subsidy and allowance schemes to encourage graduates to work in “social management and public service posts” in the rural areas, and incentives for those who had done when applying for postgraduate study. Incentives were announced for graduates to start their own business, with exemptions from certain administrative charges, and the ability to apply for loans of up to 50,000 yuan for running small business. Vocational training would be organized for one million graduates between 2009 and 2011. Special assistance would be given to graduates from poor families and under certain circumstances universities should give them employment subsidies. They would also be exempt from paying application and other fees for jobs employing public servants (text in XHNA, 15 Feb.).
Vice Premier Zhang Dejiang said on 20 February that China was facing a daunting task to secure jobs for its workforce after more than 20 million migrant workers lost their jobs in the global financial crisis. To compound the problem, more than seven million college graduates will be looking for jobs this year. He called on the Ministry of Human Resources and Social Security to ensure a stable employment situation in 2009, as “employment is related to people's livelihood and the harmony and stability of the society.”
According to Xinhua News Agency, urban unemployment (not including migrant workers) rose to 4.2 per cent at the end of 2008. Zhang said more proactive policies were needed to combat unemployment: tax burdens of firms could be reduced, and preferential policies for social security coverage could be employed to help firms survive the crisis and keep jobs. More subsidies should be offered for vocational training in order to get people reemployed, and training should be made more relevant to different jobs (XHNA 19 Feb.).
Agriculture: the Central Document No. 1, issued on 1 February, dealt as is customary with agricultural issues (“Several Opinions of the CCP Central Committee and the State Council on Promoting Stable Development in Agriculture and a Sustained Increase in Peasants' Income in 2009”). It warned that 2009 could be the toughest year China faced since the turn of the century in terms of economic development and securing “sound development momentum” in the rural areas. It noted that the biggest potential for increasing domestic demand lay in the rural areas.
It urged authorities at all levels to take resolute measures to avoid declining grain production and the stagnation of rural incomes. As part of the effort to boost domestic demand it announced a 13 per cent subsidy to all rural buyers of home electrical appliances. The document announced that there would be more investment in agriculture in the forthcoming budget, and production subsidies would be extended to cover all growers of rice, wheat, corn and cotton, as well as to some growers of rape and soybeans. Measures would be taken to improve the rural social security network and efforts would be made to increase rural employment. Improvements would be made in ensuring the correct balance between farm produce supply and demand to protect farmers from the effects of low prices (XHNA, 1 Feb). According to Chen Xiwen, Director of the Office of the Central Leading Group for Rural Affairs, about 20 million migrant workers had recently returned to the countryside, greatly exacerbating rural problems (XHNA, 2 Feb.).
h Health
On 21 January, the State Council adopted a new national health care plan designed to provide universal primary health care across the country by 2011. This would include a 90 per cent coverage of health insurance and a system whereby “basic medicines” were covered by the insurance. The cost of the new system was projected to be 850 billion yuan (XHNA 22 Jan.). The Ministry of Health issued a report on 16 February stating that the rural co-operative medical insurance system, launched in 2003, now covered 814 million people or 91.4 per cent of its target, and that the government had doubled funding for the pool in 2008. The basic health insurance announced in January would provide an annual subsidy of 120 yuan to each person covered by the scheme (XHNA, 17 Feb.).
i Social Affairs
The authorities braced themselves for a further increase in demonstrations and disturbances in 2009. Chen Jiping, Director of the Office for Comprehensive Management of Social Security under the CCP Central Committee, was reported to have said that
[t]he year 2009 will be a year when China will encounter the greatest difficulty and the most severe challenge in developing its economy since the beginning of the new century. It will also be a year of increased factors of social risks, added contradictions, grim and complicated security problems, and the most complicated and arduous task of comprehensive management of public security.
In addition to the existing problems he suggested that 2009 could face an increase in disputes from economic causes, more trouble from the floating population of migrants, and more urban public security problems flowing over into rural areas and “more extremist acts by individuals” (ZTS, 12 Jan.).
On 2 February, Chen Xiwen, Director of the Office of the Central Leading Group on Rural Work, told a press conference in Beijing that the government would not use police forces to deal with social unrest in rural areas “unless there are extreme cases of violence, such as beating, looting and arson,” the official Xinhua news agency reported. According to Chen, while land requisition, environmental pollution, relocation of farmers and the handling of collectively owned assets have been four major causes of rural unrest, the return of a large number of jobless migrant workers to their rural homes is a new factor impacting social stability in 2009 (XHNA, 2 Feb.).
The South China Morning Post reported on 13 January that the People's Armed Police Units in Xinjiang had been upgraded to army level, increasing the resources available to them. A meeting of police chiefs to announce this was addressed by Wang Lequan, Party Secretary of Xinjiang, who said that the coming year was going to be a sensitive one with a number of major anniversaries and that the three forces of terrorism, separatism and extremism were preparing for another round of attacks. Earlier, Rozi Ismail, president of the Higher People's Court of Xinjiang, said the regional court had processed 268 cases in relation to the violent events of last year (SCMP website, 13 Jan.).
j Macau Special Administrative Region
Vice-president Xi Jinping made a two-day inspection of Macau on 9–10 January, in order to inspire local people to cope with the global financial crisis. It was his first visit to the region and he met the Chief Executive and other senior figures. He said that the purpose of his visit was to meet local residents, inspire them to tide over the global financial crisis and congratulate Macau on the 10th anniversary of its return to the motherland. He said that the central government paid great attention to the impact of the global financial crisis on the Special Administrative Region and would render full support to the people of Macau. He said that Macau had properly handled the question of constitutional development and taken effective measures to deal with the global crisis (XHNA, 10 Jan.).
On 25 February, the Macau Special Administrative Region Legislative Assembly passed the National Security Bill proposed by the government of Macau, as required by Article 23 of the Basic Law. There were 28 out of 29 legislators in attendance at the session. Article 23 requires Macau to “enact laws on its own” to prohibit any act of treason, secession, sedition, subversion against the Central People's Government, or theft of state secrets, to prohibit foreign political organizations or bodies from conducting activities that endanger national security in the region, and to prohibit political organizations or bodies of the SAR from establishing ties with those foreign political organizations or bodies. The Xinhua report noted that the draft bill had been widely circulated in Macau and had won widespread popular support (XHNA, 25 Feb.). Similar legislation had proved very controversial in Hong Kong and had been withdrawn.
2. Foreign Relations
a Diplomatic tours
President Hu Jintao's tour of Africa
From 10 to 17 February, President Hu Jintao paid state visits to Saudi Arabia, Mali, Senegal, Tanzania and Mauritius aimed at further consolidating China's friendship and co-operation with these countries (XHNA, 3 Feb.). Against the background of the international financial and economic crisis which was increasingly impacting on developing countries, Assistant Foreign Minister Zhai Jun said on 6 February that the intention of the visit was “to consolidate the strategic friendship between China and Saudi Arabia, promote the collective co-operation between China and the Gulf Co-operation Council, promote the implementation of the results of the Beijing Summit of the Forum on China–Africa Co-operation at the last stage, further deepen the new-type strategic partnership between China and Africa, enhance friendly co-operation with the four African countries, and promote common development.” Zhai added that, with the exception of Saudi Arabia, the countries Hu had chosen to visit were not resource-producing countries. This showed that China's relations with Africa were not simply about resources and energy. These were an element, but only one part, of the co-operation between China and Africa which was about a profound traditional friendship and mutually beneficial co-operation in many aspects (XHNA,6 Feb.).
President Hu arrived in Saudi Arabia on 10 February and had talks with King Abdullah. Both sides expressed their desire to boost their bilateral relationship, work together to tackle the global financial crisis and strengthen their co-ordination in international and regional affairs, and on reforms of the world financial system. King Abdullah said that China was Saudi Arabia's most sincere friend and President Hu said that China valued the important role Saudi Arabia played in safeguarding regional peace and security and ensuring international energy security. The two leaders then witnessed the signature of five agreements on energy, health, quarantine, transportation and culture (XHNA, 11 Feb.). Hu also met Abdul Rahman Al-Attiya, Secretary General of the Gulf Co-operation Council, to discuss mutual co-operation. Hu said that China was seeking to sign a free-trade agreement with the Gulf Co-operation Council as soon as possible, and he commended the work of the Council in safeguarding regional security and ensuring stability on international energy markets. Trade between China and the Gulf Co-operation Council reached US$80 billion in 2008 (XHNA, 11 Feb.). Sino-Saudi bilateral trade reached US$41.8 billion in 2008 (XHNA, 12 Feb.).
In Mali on 12 February, President Hu Jintao had talks with the Malian President, Amadou Toumani Touré, and said that China would increase its aid to Africa, cancel part of the debts, and expand trade and investment. He said that China was paying much attention to the difficulties in which African countries found themselves as the global financial crisis had begun to have an effect on them. He said he wanted to increase exchanges and co-operation with Mali and other countries so that “together we will tide over the crisis” (XHNA, 13 Feb.). Bilateral trade with Mali reached US$200 million in the first ten months of 2008 – an increase of 58 per cent (XHNA, 12 Feb.).
In Senegal on 13 February, President Hu held talks with President Wade and they congratulated each other on the healthy development of relations since 2005. Hu said China cherished its friendly and co-operative relations with Senegal which it regarded as an important co-operation partner. Hu put forward a four-point proposal for deepening relations, including: maintaining high-level contacts and exchanges to increase mutual political trust; deepening economic and trade co-operation through the establishment of a joint committee on economics and trade; to develop cultural exchanges; and finally to increase multilateral co-operation and safeguard common interests. Hu also stressed that China was very willing to stand by Senegal in the current financial and economic crisis “and join forces with them in tiding over the hard times.” A number of bilateral co-operation documents were signed (XHNA, 13 Feb.).
In Tanzania on 15 February, President Hu met President Kikwete. Hu described China's relations with Tanzania as an exemplary relationship of sincerity, solidarity and co-operation between China and an African country. A number of co-operation deals were signed during the visit (XHNA, 16 Feb.).
Hu arrived in Mauritius on 16 February and had talks with the Prime Minister Navichandra Ramgoolam. Hu said that relations with Mauritius had been developing in a friendly and steady manner on a solid foundation. He presented a five-point proposal for developing relations further covering: a) the maintenance of high-level exchanges; b) closer economic and trade co-operation, including establishing an economic and trade co-operation zone; c) reinforcing co-operation to deal with the international financial crisis; d) increasing cultural exchange; and e) enhanced co-operation in international and regional affairs. The leaders then witnessed the signing of a number of co-operation agreements (XHNA, 18 Feb.)
Summing up the tour's achievement, Foreign Minister Yang Jiechi said on 18 February that it had been a very successful “journey of friendship and co-operation.” He said it had been a significant move in boosting China's ties with developing nations at a time when the international situation was in a state of profound change, and the international financial crisis was continuing to spread. China had reached a new consensus with its partners on dealing jointly with the challenges of the international financial crisis; China's relations with Africa had been pushed to a new stage; much had been achieved in a win-win way with over 20 co-operation documents of various types signed during the trip; and China had been able to reach out in a fresh way to ordinary people (XHNA, 18 Feb.).
Premier Wen Jiabao's trip to Europe
Premier Wen Jiabao paid a week-long “visit of confidence” to Western Europe, visiting Switzerland, Germany, Brussels, Spain and Britain. According to Xinhua News Agency commentary, the visit was intended to highlight China's own ability to deliver relatively stable and fast economic growth and its willingness to work with the international community to overcome the global financial crisis (XHNA, 27 Jan.). Wu Hongbo, Assistant Minister of Foreign Affairs, said that visit had three main objectives: to prompt the international community to have more confidence and jointly cope with the financial crisis, to expand the strategic consensus and deepen mutual co-operation with European countries and to push forward the development of Sino-EU relations (XHNA, 22 Jan.). Press commentary from Hong Kong argued that China should not be looked to as a “saviour” to pump in vast amounts of money into the international system. China's contribution to maintaining global financial stability and world economic development would be made mainly through ensuring its own smooth economic development. Neither should China be blamed for the crisis, the root cause of which lay in the United States (Hong Kong Wen Wei Po in Chinese, 29 Jan.). Premier Wen was quoted as saying that China had every confidence in itself because its basically stable and healthy financial situation has reduced the impact of the current financial crisis on China, because China's domestic demand is large and because China had adopted a correct policy to expand domestic demand.
On 27 January Premier Wen met the President of the Swiss Confederation, Hans Rudolf Merz, and they agreed to work more closely together in the financial crisis, to look into a bilateral free trade zone, and a package of measures including deepening financial co-operation, expanding trade and investment, opposing trade protectionism, and promoting reform of the international financial system. He later attended the World Economic Forum in Davos, to which he gave a major address outlining China's approach to the world economic and financial crisis (text in XHNA, 29 Jan), including a financial stimulus package of four trillion yuan over a two-year period. At a meeting in Switzerland with Pascal Lamy, Director General of the World Trade Organization (WTO), Wen said that it was important to oppose and curb trade protectionism. He also promised that China would support moves to bring the Doha round of trade negotiations to a successful conclusion.
In Germany on 29 January, Wen met the President and the Foreign Minister and had talks with Chancellor Merkel concentrating on the world economic situation and bilateral relations. The two sides agreed a “Joint Statement of China and Germany on Making Joint Efforts To Stabilize the World Economic Situation” (text in XHNA, 29 Jan.), and witnessed the signing of a number of bilateral co-operation documents in the fields of electric power, automobile, machine building, railway transportation (the Maglev project), ecological environmental protection, and culture.
On 30 January Wen travelled to Brussels for a visit to the European Union Headquarters. He had talks with the Commission President Baroso, and they agreed that the China–EU Summit, which had been postponed by the Chinese in 2008 because of President Sarkozy's meeting with the Dalai Lama, would be held “at an early date.” The two sides also agreed to hold the 2nd Sino-EU high-level trade and economic dialogue in April. A Joint Declaration issued after the visit noted that the China–EU relationship had gone beyond the bilateral domain and was increasingly of strategic significance. They stated that they would take positive measures to enhance co-ordination on macro-economic policies in order to overcome the financial crisis and to promote facilitation and liberalization of trade and investment. Both sides emphasized that an open, free and fair trade and investment environment and the creation of business opportunities are important means to tackle the global financial problems. They also pledged to push for positive results at the climate change conference in Copenhagen and to help implement the UN's Millennium Development Goals (text in XHNA, 30 Jan.). They also signed a number of agreements on aviation, work safety, clean energy and intellectual property rights protection (XHNA, 31 Jan.). Wen also met the Czech Prime Minister, as President of the European Union. In a press conference after the meeting Prime Minister Topolanek said that the postponed Summit would be held in Prague in May. The global economic downturn would be a major subject and he also said that he had discussed human rights with Premier Wen, warning him that the summit might be affected by the coincidence with the anniversaries of Tiananmen in 1989 and the Tibetan uprising in 1959 (CTK News Agency Prague, 30 Jan.). China's account of the meeting highlighted the need for China and the EU to deepen their co-operation in the light of the “complicated international political context and lingering economic uncertainties” and to work together for a “shared response to grave challenges such as the raging global economic slump, thus making greater contribution to the world peace and development” (XHNA, 31 Jan.).
Wen then travelled to Spain where he met King Juan Carlos and had talks with the Prime Minister, José Luis Rodriguez Zapatero. In his meeting with the Prime Minister they agreed to increase bilateral trade volume to US$40 billion by 2011, and that China would send a special purchasing mission to Spain. They agreed to expand two-way investment, particularly in the areas of telecommunication, infrastructure construction, auto industry and logistics. After the meeting they witnessed agreements on co-operation in finance, aviation, energy and telecommunication, and issued a joint statement on further strengthening their comprehensive strategic partnership. One of the agreements was to set up a joint venture plant in Harbin to produce parts and components for the A-350 (XHNA, 31 Jan.). For a full text of the Joint Communiqué, see XHNA of 31 Jan.
In Britain, Premier Wen had meetings with the Prime Minister Gordon Brown and a number of British political figures, and delivered a public speech at Cambridge University. In a Joint Statement issued after the visit (XHNA, 2 Feb.) the two sides reaffirmed their determination to develop their “comprehensive strategic partnership” still further in order to foster a global recovery from the economic crisis and pursue sustainable growth. They discussed in particular how to ensure that that forthcoming G20 London Summit could deliver the outcomes necessary to stabilize the situation. They agreed to continue working together to improve the “regulation, transparency and integrity” of financial markets, and reaffirmed their commitment to open markets and free trade. During the speech in Cambridge, a shoe was thrown at Premier Wen by one of those attending. China expressed strong dissatisfaction at this but noted that the British Government had apologized for the incident and would be “handling it according to the law” (XHNA, 3 Feb.). China later reported that the Prime Minister had written to Premier Wen describing the incident as a “matter of regret” (XHNA, 5 Feb.).
b Countries, territories and regions
Africa (Uganda, Rwanda, Malawi, South Africa)
Foreign Minister Yang Jiechi undertook a tour of four African countries from 13–17 January. He then visited Brazil and Portugal. A Xinhua commentary described the visits as further enhancing China's traditional friendship with Africa, and contained an interview with Yang. Yang said that the world had experienced a new stage of economic turmoil in the past year, and Africa had experienced new and complicated changes. He felt that it was rising to the challenge, and had maintained a peaceful and steady situation. He said that he had been much impressed by the confidence and courage shown by African countries. He said that China would continue to provide aid to Africa in line with its own ability, and had made it clear that it would be reducing aid because of the financial crisis, and he had signed a number of economic co-operation agreements with Rwanda, Uganda and Malawi during his visit. Secondly, China would continue to expand trade and investment with Africa, and he noted that the target of a trade volume of US$100 billion had been exceeded two years ahead of schedule. Thirdly, it would urge the international community to honour its commitments to Africa and help create the right external conditions for Africa to recover from its difficulties. Lastly, China would press for reform of the international financial system and press for greater representation and rights to speak for African countries (XHNA 17 January).
Yang met the President and Foreign Minister of Rwanda in Kigali on 14 January (XHNA, 14 Jan.). Yang met the Malawi President and Foreign Minister in Lilongwe on 15 January. The two sides congratulated each other on the strength of the relationship and agreed to make joint efforts to develop it further by: a) increasing high-level political contacts; b) promoting economic and other practical co-operation; c) increasing people to people and cultural exchanges; d) strengthening their co-ordination and co-operation in internal and regional issues; and e) improving the co-operation between the two countries' foreign ministries. A number of co-operation documents were signed (XHNA, 15 Jan.). In South Africa he met President Motlanthe and the Foreign Minister Zuma. Yang said that China and South Africa had seen a rapid development in their strategic partnership and made new progress in their friendly co-operation. He said that China was willing to step up its co-operation with South Africa, and that the two countries should work jointly to deal with the international financial crisis, and contribute to global stability and development (XHNA 16 Jan.).
Middle East (Oman)
Foreign Minister Yang Jiechi stopped over in Oman on 12 January and told the Omani Foreign Minister that China was ready to increase co-operation with Arab countries and work with them in solving the ongoing Israel–Palestine conflict (XHNA 12 Jan).
Asia (Burma, Vietnam)
Chen Bingde, Chief of the PLA General Staff Department, visited Burma and met Than Shwe on 18 March. Chen said that China and Myanmar were friendly nations linked by mountains and rivers and that their friendship was genuine and time-tested. He said that China hoped to further strengthen the friendly and co-operative ties between the two countries and their armed forces, and hoped that Myanmar would make new achievements in striving for stability and development. Chen also had talks with his Burmese counterpart during which they were reported to have exchanged views on international and regional peace, relations between the two armed forces and matters of common concern (XHNA, 18 March).
Li Changchun, a member of the Politburo Standing Committee, visited Burma in late March. He met Tan Shwe on 26 March. Li spoke highly of the traditional friendship between China and Burma. He said that the relationship now had a new and important opportunity. China would, in the spirit of “working for the good of our neighbours and treating them as partners” actively promote pragmatic co-operation in various areas, and encourage Chinese enterprises to co-operate with the Burmese in the development of energy and resources, the construction of infrastructure, agriculture, industry, mining, telecommunications and other important areas. Li Changchun also spoke positively of the progress made by Burma in political construction, ethnic reconciliation, economic development and improvement in the people's livelihood (XHNA, 26 Mar.).
On 23 February China and Vietnam held a ceremony to commemorate the completion of the demarcation of their joint land border. Chinese State Councillor Dai Bingguo attended the ceremony at the Friendship Pass border gate between China and Vietnam (XHNA, 23 Feb.).
South-Pacific (Fiji)
Vice President Xi Zhongxun made a stopover in Fiji on 9 February on his way to Latin America. He had talks with the President Iloilo Prime Minister Baininamara for friendly talks (XHNA, 9 Feb.).
Latin America (Mexico, Jamaica, Colombia, Venezuela, Brazil, Uruguay)
Vice President Xi Zhongxun visited Mexico from 9–11 February and put forward a five-point proposal for improving and developing closer co-operation between the two countries. He noted that the two countries were in a crucial stage of economic development and complemented each other, which enabled them to reach a mutually beneficial relationship (XHNA, 11 Feb.). During his talks with the Mexican President he pointed out three areas where their work should be concentrated: first, to make use of the permanent committees the two sides had established to push forward the implementation of their joint action plan; second, to strengthen their political and cultural dialogue and cultural and human exchanges; and third, to deepen their practical co-operation and seek a proper solution to questions in their trade and economic relations. He said that China always viewed its relationship with Mexico from a strategic height and regarded Mexico as a good friend and partner (XHNA, 12 Feb.). Xi's visit to Mexico caught the attention of the international press when he was reported to have attacked critics of China in very forthright terms. In a talk to the local Chamber of Commerce he said that “there are a few foreigners, with full bellies, who have nothing better to do than try to point fingers at our country,” and added “China does not export revolution, hunger, poverty, nor does China cause you any headaches. Just what else do you want?” (UK Daily Telegraph website, 16 Feb.).
Xi Zhongxun visited Jamaica from 12–14 February and had talks with Prime Minister and the Governor General. On arrival, he said that his visit was aimed at strengthening friendship, expanding consensus and deepening co-operation and promoting common development (XHNA, 12 Feb.).
In Colombia he had talks with President Alvaro Aribe on 15 February. They agreed to strengthen bilateral co-operation, increase civil exchanges, and boost their multilateral co-operation and co-ordination. Xi suggested that they should enhance mutual trust; expand bilateral trade and seek trade balance; broaden their co-operation to new fields; and encourage investment and co-operation (XHNA, 16 Feb.). China and Colombia signed seven co-operation agreements on economic and technical co-operation, assistance with disasters, health and the promotion of trade and investment. They included a Chinese donation of US$5.8 million for economic and technical assistance (Website of the Office of the President of Colombia, 16 Feb.).
In Venezuela, Xi had talks with Vice president Ramon Carrizeles. Xi said that the establishment of strategic partnership for common development in 2001 had allowed bilateral ties to enter a new stage. Trade and economic exchanges were developing rapidly and the two sides should become long-term stable co-operative partners in energy co-operation (XHNA, 18 Feb.).
Xi visited Brazil from 18–20 February and met the Brazilian President Luiz Inácio Lula da Silva. He said that the relationship between the two countries, both important emerging economies, would go beyond the boundaries of bilateral ties and would be increasingly of global and strategic significance. China wanted to strengthen communication and co-ordination with Brazil in the face of the global financial crisis, to co-operate in dealing with the situation and in propelling reforms to the international financial system. China also wanted to work with Brazil in protecting the interests of developing countries (XHNA, 21 Feb.). During the visit an agreement was signed whereby Petrobras would supply China with up to 100,000 barrels of oil a day, and a further one instituting a US$10 billion loan from the China Development Bank to Petrobras (XHNA, 20 Feb.).
Foreign Minister Yang Jiechi visited Brazil from 18–20 January. He had talks with the President and Foreign Minister. The two sides agreed that maintaining close high-level contacts and exchanges of visits is of great significance for the promotion of bilateral strategic partnership. They announced that they would hold the second session of the Sino-Brazilian Co-ordination and Co-operation Commission in Brasilia at an appropriate time this year (XHNA, 20 Jan.).
The President of Uruguay visited China for a state visit from 21–26 March and had talks with President Hu Jintao on 23 March. Uruguay announced that it recognized the full market status of the Chinese economy, and the president was reported to have expressed his full support for a one-China policy and on issues concerning Taiwan and Tibet. The two presidents discussed the financial crisis and agreed to take bilateral relations to a higher level. After the talks they witnessed the signing of a number of bilateral documents (XHNA, 23 Mar.).
North Asia (Democratic People's Republic of Korea [DPRK], Japan)
Wang Jiarui, Director of the International Liaison Department of the Chinese Communist Party, visited North Korea from 21–25 January. He met Premier Kim Yong-Il and the Secretary of the Korean Workers' Party Central Committee, Choe Thae Bok, on 22 January (KCNA in English Pyongyang, 23 Jan.). He met Kim Jong-Il, Secretary of the Korean Workers' Party and Chairman of the National Defence Council on 23 January (XHNA, 23 Jan.). According to KCNA, Wang brought personal congratulations and message from President Hu Jintao, along with various gifts. Kim expressed thanks and asked Wang to convey his congratulations for New Year to senior Chinese leaders, including Hu Jintao. He welcomed the delegation in this significant “year of DPRK–China friendship,” the 60th anniversary of diplomatic relations (KCNA in English, 23 Jan.). This was Kim's first meeting with a foreign dignitary since reports of his serious ill health last year. According to Chinese sources, Kim told his visitors that he was working to denuclearize the Korean peninsula and wanted to strengthen co-ordination and co-operation with China and that he was ready to work with China to push forward the six-party talks process. An invitation was extended to Kim Jong-Il to visit China, which he accepted (XHNA, 23 Jan.).
The Chinese Foreign Ministry spokesman said on 24 February that China had noted reports that North Korea was planning an imminent test firing of a long-range rocket, but gave no further details. He said that China hoped all parties could make more efforts to promote peace and stability on the Korean Peninsula and in the region. He added that China hoped that the parties could continue to make concerted efforts to push forward the process of the six-party talks (XHNA, 24 Feb.) Later, as the likelihood increased of a test firing increased, the Chinese Foreign Ministry spokesman said on 26 March said that China's stand on the nuclear issue on the Korean Peninsula is consistent and clear-cut, and China is ready to play a constructive role in maintaining peace and stability on the Korean Peninsula. He added: “in the current stage, we hope that all parties concerned will remain calm and restrained and do more things conducive to upholding and promoting the progress in the six-party talks and conducive to maintaining and realizing peace and stability on the Korean Peninsula and Northeast Asia, and that China is also ready to maintain communications on this with relevant parties” (XHNA, 26 Mar.).
Kim Yong-Il, the North-Korean Premier, visited China for five days from 17–21 March. In an interview with Xinhua before the visit (XHNA, 16 Mar.) Kim said that North Korea was satisfied with the vigorous development of friendly relations with China under the current complicated international situation. He added that “the DPRK firmly believes that with the historic ‘Year of DPRK–China Friendship’ serving as an opportunity, the two countries' traditional friendly co-operative relations will further develop in the political, economic and cultural fields, and thus strongly promote the two countries' socialist construction and make substantial contributions to ensuring peace and stability on the Korean Peninsula, in the Northeast Asian region, and even around the world.” Meanwhile the Chinese Foreign Ministry spokesman said on 17 March that China had declared it was concerned about the situation on the Korean Peninsula, “with uncertain factors on the rise” and urged all parties involved in the area to seek dialogue. He urged all the parties to seek dialogue, show restraint and be cool-headed to ensure the peace and stability on the Korean Peninsula and northeast Asia. He said China had noted the DPRK's announcement that it would launch a communications satellite and the response of the international community (XHNA, 17 Mar.) Kim called on President Hu on 19 March. Hu said that “the friendship, which has kept developing, has become the common treasure of both countries.” On the nuclear issue, Hu said that the question facing all parties concerned was how to overcome the “current difficulties” and resume the six-party talks at an early date (XHNA, 19 Mar.).
Japanese Foreign Minister Hirofuki Nakasone visited China from 28 February to 1 March and had talks with Foreign Minister Yang Jiechi. According to Japanese press reports, they agreed to continue monitoring North Korea and its declared plans to launch a satellite from the viewpoint that “North Korea should not carry out any acts that heighten tension and threaten the peace and stability of the region.” A Japanese official was also quoted as saying that had discussed the dispute over the Senkaku (Diaoyu) Islands and repeated their respective stands on the issue. Nakasone was said to have raised concerns about China's military build up. They also discussed reactions to the global economic crisis and the need to combat protectionism. They agreed to start negotiations on agreements on co-operation in the criminal and judicial fields (Kyodo News Service in English 28 Feb.). According to Xinhua, Yang warned Nakasone to act with discretion over the islands dispute, and the Chinese Foreign Ministry spokesman later said publicly that “any words or deeds that bring the Diaoyu Islands into the scope of the Japan–US Mutual Co-operation and Security Treaty are absolutely unacceptable for the Chinese people” (XHNA, 28 Feb.). Nakasone also met with State Councillor Dai Bingguo and Premier Wen Jiabao.
Japan's Defence Minister Tasukazu Hamada visited China on 20 and 21 March for talks with his Chinese counterpart Liang Guanglie, the first visit at this level since 2003. According to the Chinese press accounts of the visit they agreed to enhance their defence co-operation. One practical result of this was the decision that was announced for Chinese naval ships to visit Japan. They agreed that Liang would pay a return visit to Japan in the course of the year. They also agreed to exchange views on international peacekeeping operations, coping with natural disasters and cracking down on pirates, especially with regard to exchanging information on operation in the Gulf of Aden (XHNA, 20 Mar.) The Japanese press reported that they had discussed the North Korean planned rocket launch. Hamada had asked the Chinese to urge restraint on Pyongyang, and Liang had in turn asked Japan to handle the question “in a calm manner.” Liang had apparently acknowledged that it would be best if North Korea did not fire the rocket but wanted Japan to take a cool-headed attitude towards it. Liang had also spoken about China's plans to build an aircraft carrier, telling Hamada that China was the only major nation not to have one and that China had a vast sea area and needed to develop its capabilities (Kyodo News Service, 20 Mar.).
Russia
China and Russia signed a package of seven further energy related agreements during the visit of the Russian Deputy Prime Minister Igor Sechin. These included a pipeline construction project, a long-term crude oil trade deal and a finance scheme between the China Development Bank and the Russian Oil Pipeline Transport Company. Chinese Premier Wen Jiabao said that energy co-operation between the two countries was now long term, comprehensive and sustainable. He hoped that the agreements would be promptly implemented. Trade between Russia and China was US$56.8 billion in 2008, an increase of 18 per cent over the previous year (XHNA, 17 Feb.).
Chinese Premier Wen Jiabao met with visiting Russian Deputy Prime Minister Alexander Zhukov on 27 March to mark the “Year of Russian Language” in China, which would involve over 260 different cultural events in various parts of China. Wen also praised the success of the fifth China–Russia trade promotion conference held the same day. Wen praised the strategic and co-operative partnership between the two sides which had laid a good foundation for co-operation in dealing with the financial crisis. Wen urged the two sides to implement co-operative projects involving energy, finance and infrastructure and maintain growth momentum in trade so as to create conditions for the long-term economic development of the two countries. He also called for more co-ordination in international affairs (XHNA, 27 Mar.).
South Asia (Pakistan)
President Zardari of Pakistan visited China on 20 February. He first visited the province of Hubei, focussing on co-operation in water conservancy and agriculture. Zardari attended a co-operation forum on agriculture and water resources, saying that the co-operation in these two fields, as basics of life, was important for the Pakistan–China relationship. President Zardari witnessed the signing of a new co-operation document of hybrid seed between a Hubei company and Pakistan's Sindh Province, together with other three co-operation memorandums on hybrid rapeseed, port engineering and friendly exchanges between Hubei and Sindh Province (XHNA 21 Feb.). President Zardari met State Councillor Dai Bingguo in Wuhan. Dai said that the promotion of friendship with Pakistan was China's unswerving policy and that it always viewed the relationship “from a strategic height and a long-term perspective.” The two leaders then attended the signing ceremony for a bilateral trade agreement (XHNA, 21 Feb.). After visiting the Three Gorges Project, President Zardari went on to visit Shanghai. While he was in Shanghai, he received a telephone call from President Hu Jintao. President Hu said that there was an excellent development momentum in Sino-Pakistani relations. China and Pakistan were good neighbours, good friends, good partners and good brothers. President Zardari thanked President Hu for the warm hospitality and said that Pakistan stood ready maintain high-level exchanges, push forward bilateral relations and promote peace and stability in the region (XHNA, 24 Feb.). While in Shanghai he also witnessed the signing of a Memorandum of Understanding on agricultural technology co-operation under which China would provide Pakistan with technology and advice on water-efficient irrigation (XHNA, 23 Feb.).
United States
China made it clear that it was ready to deal positively with the new US administration. Chinese Foreign Minister, Yang Jiechi, travelling in Portugal, said that China was ready to work with the United States to handle relations from a strategic and long-term perspective. He noted the congratulations that President Hu had sent on President Obama's election and that they had already had a conversation on 8 November in which the agreed to strengthen co-operation and further develop mutual relations (XHNA, 21 Jan.). The Chinese Ambassador to Washington said on 22 January that the relationship was now at a new historic starting point, and that China was ready to work with the new administration to promote the long term, healthy, stable and in-depth development of ties.
Xinhua News Agency reported on 23 January that the US Treasury Secretary designate, Timothy Geithner, had undertaken to deepen the economic relationship with China, and that the Obama administration looked forward to a productive economic dialogue on a number of short and long term economic issues. It also noted his remarks that President Obama believed that China is manipulating its currency, and that the new administration would “use aggressively all the diplomatic avenues open to him to seek change in China's currency practices” (XHNA, 23 Jan.). A Xinhua commentary of 25 January described such comments as unfair and stated that “these statements are not only at variance with facts, but are also a misleading analysis of the cause of the financial crisis, and will assist the resurgence of the forces of trade protectionism in some Western countries” (XHNA, 25 Jan.).
President Hu and President Obama spoke over the telephone on 30 January, at which time Hu congratulated Obama on his inauguration and stressed that China was willing to work with the US to strengthen dialogue and mutual trust, respect and take account of each other's core interests and jointly deal with all kinds of global challenges. Hu said that China appreciated US efforts to stabilize the financial markets and stimulate economy, and stated that China was willing to work with the US to strengthen communication and co-ordination on macroeconomic policy and to work jointly for positive achievements at the G20 financial summit in London (XHNA, 31 Jan.).
The US Secretary of State, Hillary Clinton, visited China as part of her Asian tour from 20 February. She had meetings with the Chinese Foreign Minister Yang Jiechi, State Councillor Dai Bingguo, Premier Wen Jiabao and President Hu Jintao. After their meeting on 21 February, Foreign Minister Yang said that China attached great importance to relations with the United States and that the two sides can and should establish long-term, stable, healthy and ever-developing bilateral relations. He said that the current situation required both sides to strengthen dialogue and exchanges, increase mutual trust and co-operation and enhance the relationship to a new level. He added that he was looking forward to establishing a good working relationship with Secretary of State Clinton to jointly promote exchange and co-operation between the two countries. Secretary Clinton said that the new US administration hoped to strengthen relations with China. They already had a solid foundation but there was much to do, and China and the US would be able to conduct a wide range of co-operation on a series of issues such as the economy and global climate change. They stressed the significance of the proposed meeting between President Hu and President Obama at the forthcoming G20 London summit in April. They agreed to further enhance communication and co-ordination in dealing with the international financial crisis, push for positive results from the London Summit, strengthen co-operation over a wide range of bilateral issues, and in energy, climate change and environmental issues. They agreed in principle to start a strategic and economic dialogue. Secretary of State Clinton invited Yang to visit the US in March and he accepted. In the press conference after the meeting Foreign Minister Yang said that the Chinese side thinks highly of the efforts made by the US government to stimulate the US economy and to overcome the financial crisis, and believes that joint co-operation by the two sides will overcome the financial crisis. He said that China had met the challenges of the financial crisis. It had already announced the US$4 trillion investment plan, and was confident that would be able to maintain a growth rate of eight per cent in 2009 which “itself is the greatest contribution made by China to the international community in coping with the global financial crisis.” On US bonds he said that China's principles for using its foreign exchange are security and maintaining liquidity. China would decide the formal method of using its foreign exchange assets in accordance with these principles (XHNA, 21 Feb.). Yang also acknowledged that that China and the United States hold some differences on the human rights issue because the two countries have different histories, social systems and cultural backgrounds. He said that China was willing to conduct active dialogue with the US on human rights on the basis of mutual respect and non-interference in each other's internal affairs. Secretary Clinton made it clear that “our pressing on human rights issues can't interfere” with dialogue on other crucial topics. On the Taiwan issue, Yang said that China appreciates the United States' reiteration of its adherence to the one-China policy, observance of the three China–US joint communiqués, opposition to “Taiwan independence,” and opposition to Taiwan's attempt to join international organizations for only sovereign nations. He added that China would cautiously and appropriately handle the Taiwan issue and support the peaceful development of cross-Strait relations.
In the meeting with State Councillor Dai Bingguo, Clinton spoke highly of the rapid development of relations over the last 30 years and urged the two sides to co-operate to achieve win-win results and in particular to work together to deal with the international financial crisis and help the world economy recover swiftly from recession. Dai also spoke highly of the relationship and called on them to enhance co-operation and deal with various challenges together. They also exchanged views on North Korea and the nuclear issue (XHNA, 21 Feb.). At a meeting with Hillary Clinton, President Hu Jintao told her that he appreciated that her inaugural visit had been to China and other parts of Asia as it reflected the importance the new US administration placed on developing relations with China and other Asian countries. China and the US shared extensive common interests on major issues involving peace and development in the world shouldered major responsibilities. China viewed its relations with the US from a strategic and long-term perspective and was ready to work together with the US, seize the challenges and push forward the development of relations. He invited President Obama to visit at an early date, and said he was looking forward to meeting him in April in London. Secretary of State Clinton said she had good meetings with Chinese leaders during her visit and that it was opening a new era in relations between China and the US of positive co-operation. The two sides shared common interests in many areas and on many global issues (XHNA, 21 Feb.).
Secretary Clinton also met Premier Wen Jiabao for discussions on bilateral relations and international issues. Wen called for the two sides to proceed from the strategic high ground and long-term perspective to take care of each other's core interests and to continually enrich the content of their constructive and co-operative relations. He said that the global financial crisis provided an opportunity for the two sides to strengthen their mutual trust and co-operation. They should firmly oppose trade and investment protectionism, and adopt positive measures to overcome current economic difficulties. He invited both sides to work together on issues such as climate change, energy security, environmental protection and achieving the millennium development goals. Secretary Clinton said that the Obama administration was ready to tackle the financial crisis and oppose trade protectionism. She said that “all countries should cross the river peacefully as they are in the same boat” (XHNA, 21 Feb.).
It was announced on 21 February that China and the US would resume high-level military contacts. The US Deputy Assistant Secretary of Defence, David Sedney, would visit China from 27–28 February for a meeting with the Foreign Affairs Office of the Ministry of Defence. The Chinese press announcement stated that China always attaches great importance to military ties with the United States and is willing to make concerted efforts with the US to enhance communications between the two militaries. It added that China hopes that the US would give faithful respect to China's core interests and major security concerns in order to create favourable conditions for the improvement and development of bilateral military ties (XHNA, 21 Feb.). David Sedney visited Beijing to chair with the director of the Foreign Affairs Office at China's Ministry of National Defence, Qian Lihua, a China–US Defence Ministry Working conference on 27 February, an exchange which had been frozen since October 2008. According to Xinhua News Agency, Qian said there had been definite achievements in relations between the two armed forces in the past 30 years, but many obstacles remained and the US side should work hard to remove them. In particular, he said that relations were still in a difficult period and that it was up to the US to take earnest measures to create the conditions for the restoration and development of relations. Qian went on to say that he hoped to work hard with the US to promote relations and proposed that the fundamental principle for this should be “respect, mutual trust, equal treatment and mutual benefit.” On Taiwan, Qian repeated that it involved China's sovereignty and territorial integrity, affecting the feelings of the 1.3 billion Chinese people. It was a core interest and concern for China. US arms sales to Taiwan not only harmed China's core interests, but also affected the peace and stability of the Taiwan Straits. The US should handle the issue with prudence, stop upgrading the substantive military relationship with Taiwan, and stop selling weapons to Taiwan. The two sides also discussed maritime security, international and regional security, and the protection of shipping in the Gulf of Aden (XHNA, 27 Feb.). At a press conference on 28 February, David Sedney said the talks had been frank and open. They had discussed areas to improve co-operative capacity and foster institutional understanding, but there were still indications from both sides that the thaw had not completely taken place. When asked about setting dates for further consultations, Sedney said it was too early in the administration to be setting a lot of dates (XHNA, 28 Feb.).
On a visit to Hong Kong on 18 February, Admiral Keating, Commander of the United States Pacific Command (PACOM), was asked why there was no agreement between China and the US on handling naval incidents. He was reported to have replied that there were “nascent initiatives” under way to address that issue. He said that it was important for China to understand that there were “rules of the road,” both literal and figurative, which it was in China's interest to observe. He stressed the importance of dialogue and co-operation with the Chinese military: “The more dialogue we have, the more inter operating we do with them, the less chance for confusion, for conflict.” He called for greater transparency from China, listing specifically its submarine capabilities, cyber warfare and space programmes, and its development of area denial weapons (SCMP website, 20 Feb.).
On 9 March the Pentagon reported that Chinese vessels had harassed the USNS surveillance ship “Impeccable” in an area of the South China Sea some 120 kilometres south of Hainan Island. The United States protested the harassment by China of the routine operation in the international waters, saying it was very dangerous. On 10 March, China responded that a US naval vessel had carried out illegal surveying activities in China's exclusive economic zone. Chinese press reports claimed that it was an open secret that “Impeccable” was a spy ship of the United States and was attempting to monitor the new model of nuclear submarines of the People's Liberation Army [PLA] in Hainan Island (ZTS, 11 Mar.).
Foreign Minister Yang Jiechi visited Washington for a five-day working visit from 9–11 March. He had talks with Secretary of State Hillary Clinton on 11 March. According to the Chinese press reports they exchanged views on bilateral relations and other matters of mutual concern including the nuclear issue in North Korea and the upcoming G20 Summit. They also discussed Afghanistan, stability in South Asia, the nuclear issue of Iran, the Middle East peace process and the Darfur issue in Sudan. Yang said that the two countries were at a new starting point and shared extensive interests and shouldered important responsibilities for world peace and development. He called for further development of their bilateral relationship in a sound and stable manner. Secretary of State Clinton agreed that they would work together to deepen and expand co-operation. The two sides undertook to make joint efforts to ensure a positive outcome for the G20 Summit, and that dealing with the financial crisis would be a major area of co-operation in the future. Both sides agreed to oppose protectionism and to “play their due roles” in stabilizing the international financial situation and promoting reform of the international financial system. Foreign Minister Yang was reported to have taken a strong position over Tibet advising the US to “respect China's position and concerns on the issue and take effective steps to clear up and negative ramifications of the wrong deeds and actions by the US side.” He reiterated China's position on Taiwan. In response, Secretary Clinton was reported to have said that the US firmly supported the one-China policy, and welcomed and supported peaceful development of cross-Strait relations (XHNA, 12 Mar.). Yang met the Secretary of the Treasury, Timothy Geithner, on 11 March for talks on bilateral economic and trade relations and on the global financial and economic crisis.
In a speech at the Centre for Strategic and International Studies on 12 March Yang laid out what he called a set of guidelines for relations between China and the United States in the new era: firstly, the two sides should take a strategic and long-term perspective on the relationship and keep relations on the right track. They now had more common interests and a broader foundation for co-operation, and the strategic significance and global influence of the relationship had considerably increased. Second, they should maintain close dialogue and exchanges at both senior and other levels to further cement the political foundations of the relationship. Third, they should expand their mutual co-operation. The current priority was finding the means to deal with the global economic crisis, but Yang also listed other areas of mutual interest such as counter-terrorism, non-proliferation, military relations, science and technology and culture and health. Fourth, they should respect and accommodate each other's core interests to minimize potential disruption (in this he singled out Taiwan and Tibet). Fifth, they should promote dialogue and exchanges between the peoples of the two countries and public support for the relationship (XHNA, 13 Mar.).
On 24 March, the Chinese protested strongly against the resolution celebrating the 30th Anniversary of the Taiwan Relations Act which was adopted by the US House of Representatives that day. Quoting the Chinese foreign ministry spokesman, the Chinese press said that the Chinese people and government had strongly opposed the Act from the day it was worked out (XHNA 24 Mar).
China described the publication of the US Defence Department's report on China's military strength as a severe distortion of the facts and an interference in China's internal affairs, and said that a solemn representation had been made on the matter to the US. The Chinese Foreign Ministry spokesman said that China stuck to a peaceful path and pursued a defence policy which was purely defensive in nature, which the US had misrepresented as the “China threat theory.” He said the United States should abandon the Cold War mentality and prejudice, stop issuing such reports on China's military, and stop its groundless censure against China, in an effort to avoid further damage to relations between the two countries and the two militaries (XHNA, 26 Mar.).
Western Europe (Portugal, Great Britain, France)
On his visit to Portugal, Foreign Minister Yang Jiechi met the Portuguese President Anibal Cavaco Silva on 21 January. President Silva said that the bilateral relationship had entered a new stage since the established of an all round strategic partnership in 2005, and that Portugal was ready to work with China to further improve the relationship. For his part, Yang said that China and Portugal had managed to solve outstanding historical issues properly and had shown understanding for each other's position on issues of great concern. Yang also met the Portuguese Prime Minister and had talks with the Foreign Minister (XHNA, 22 Jan.).
China welcomed the publication of Britain's document of its strategy and policy towards China “Britain–China Co-operation Framework,” noting that this showed the importance Britain attached to the relationship on the eve of the visit by Premier Wen Jiabao. China announced that China and Britain are highly influential countries and that further developing relations of friendly co-operation in various fields between them not only conforms with the fundamental interests of the people of the two countries, but also is conducive to promoting world peace and development. China has attached importance to its relations with Britain and is ready to strengthen communications and exchanges with Britain to further push forward the development of China–Britain comprehensive strategic partnership on the basis of mutual respect, equality and mutual benefit. In the current situation, China and Britain should work together hand in hand to deepen co-operation, overcome current difficulties and make contribution to promoting the recovery of the world economy at an early date (XHNA, 18 Jan.).
There were strong protests in China against the sale by Christie's in Paris of items originally looted from the Summer Palace in 1860. A Chinese official was quoted as saying “It is not acceptable that a foreign company would put the looted relics for auction, and we will not try to buy them back.” The report noted that Chinese netizens were furious about the auction, and that some Chinese lawyers were contemplating legal action to prevent the sale (XHNA, 23 Jan.). In the event, the court action failed and the sale went ahead, although the successful bid was made a by a Chinese man who said that he was simply making a protest and had no intention of paying (XHNA, 2 Mar.). The Chinese State Administration for Cultural Heritage condemned the sale as damaging Chinese citizens' cultural rights and feelings and stated that it would have serious effects on Christie's development in China (XHNA, 24 Feb.). Speaking at a news conference on 7 March, the Chinese Foreign Minister said that he was confident of the long-term future of relations with France although he expected France to make “positive signs” on issues of major concern to China (XHNA, 7 Mar.). “The sculptures are cultural relics looted from China and China has the right to recover them,” Yang said.
Former French Prime Minister Jean-Pierre Raffarin visited China, on parliamentary business, from 10 February. Chinese agencies speculated that he might be intended as a special envoy sent to try to patch relations up with China following the freeze resulting from President Sarkozy's meeting with the Dalai Lama (ZTS, 9 Feb.).
On 13 March the French Foreign Ministry spokesman repeated that France does not support Tibetan Independence. “We have absolutely not changed our position. That is, we support the territorial integrity of China and refuse to accept Tibetan separatism or independence.” The Xinhua News Agency commented that these remarks were made after Premier Wen Jiabao had urged France to clarify its position on Tibet related issues (XHNA, 14 Mar.).
International organizations: (Inter-American Development Bank [IDB]; United Nations [UN])
China joined the Inter-American Development Bank as its 48th member on 6 January. Following a meeting with the President of the Bank, Vice-premier Wang Qishan said China entering the IDB was not only an outcome of the development of the China–Latin American relationship in past years, but also a new beginning for future co-operation. He suggested that they “fully take this key platform to explore trade, investment, infrastructure and personnel training,” and try to achieve “concrete results” (XHNA, 4 Feb.).
The UN Human Rights Council completed its first review of China's human rights record on 11 February. The Chinese official foreign ministry spokeswoman, Jiang Yu, said that the review went generally well in an atmosphere of dialogue and co-operation. A majority of countries, she said, had spoken highly of China's achievements, and its open and frank attitude was approved by many countries. “Although a few countries attempted to politicize the review and made some groundless accusations, they were rebuked by most countries” (XHNA, 12 Feb.). Chinese media commentary noted that those in West who had wanted to use the occasion to put pressure on China were displeased. Chinese experts were quoted as saying that Western countries wanted to apply their standards to developing countries and that this was unacceptable. China would continue to prioritize the order in which it resolved human rights issues. As a developing country, it acknowledged that there were still problems, and it was willing to accept reasonable criticism (ZTS, 15 Feb.). The Chinese Ministry of Foreign Affairs spokesman denounced the US annual publication of country human rights reports saying the US should not set itself up as a “human rights guardian” and should stop interfering in other countries' affairs. He said it was clear for all to see the progress that China had made in the last 30 years through reform and opening, and that people of all ethnic groups enjoyed extensive freedoms and rights. China remained willing to conduct dialogues and exchanges on human rights to increase understanding and reduce differences, but it remained adamantly opposed to any form of interference. The China section of the US report had distorted facts and made irresponsible remarks about China's ethnic, religious and judicial systems (XHNA, 26 Feb.). As is customary China published its own report on US human rights performance shortly afterwards, claiming that the US turned a blind eye to its own failings. These were reviewed under six headings: life and personal security; civil and political rights; economic, social and cultural rights; racial discrimination; rights of women and children; and the United States' violation of human rights in other countries (full text in XHNA, 26 Feb.).