While courses in political science research methods are increasing in number,Footnote 1 students' enthusiasm and preparation for such courses has decreased (Brandon et al. Reference Brandon, Brown, Lawrence and Van Heerde2006). This suggests political science professors teaching methods should consider new styles of teaching in order to make methods courses valuable learning experiences for students. We begin our study on effective teaching with an observation: students experience anxiety in learning the steps of the research process. This observation is corroborated by research noting high levels of math anxiety (Maier and Curtin Reference Maier and Curtin2005) and library anxiety (Highby Reference Highby2006) among undergraduates. Therefore, we first explore the barriers that students identify as problems in learning quantitative methods. We then compare the barriers students identify to professors' perceptions of student barriers in order to understand how we can design our teaching to provide solutions for our students. Finally, we offer an exploratory assessment technique to evaluate our success as methods professors in improving students' confidence in their ability to perform the components of the research process. We conclude with suggestions for improvement in the design and implementation of undergraduate methods courses to best meet student needs.
BACKGROUND
Courses in political science methods could include a variety of methodologies; we limit our discussion to quantitative methods courses or those that follow a general positivist model. Often, such quantitative research methods courses require a research project, or they precede a senior thesis, capstone, or honors project. Attendees at the methods track of previous American Political Science Association's Teaching and Learning Conferences came to a consensus on standard components of such methods courses, including: “An understanding of key political science indicators; where to find literature and supporting data; how to assess literature and the supporting data's academic quality; reliability and validity; the use of appropriate statistical measures; data presentation skills” (Brandon et al. Reference Brandon, Brown, Lawrence and Van Heerde2006, 535).
Little scholarly work in our field addresses teaching research methods at the undergraduate level (Thies and Hogan Reference Thies and Hogan2005). What scholarship exists focuses on the components of methods courses, describes general approaches and specific assignments to achieve student learning (e.g., Cole Reference Cole2003; Corrigan, Dorey, and Swanhart Reference Corrigan, Dorey and Swanhart2006), or analyzes the benefits of methods courses for students (e.g., Andersen and Harsell Reference Andersen and Harsell2005).
Our own observations suggest that students fear some components of a methods course and that these fears prevent them from optimal learning. In this paper, we aim to address gaps in the existing body of work by identifying the major obstacles students face throughout the research process. We will discuss solutions, such as course projects, assignments, and in-class exercises, which may minimize these barriers.
Scholars of teaching note that when we develop innovations to solve student obstacles, it is critical to assess student outcomes, that is, we need empirical demonstrations of whether our innovations succeed or fail (Brown, Blankenship, and Kramer Reference Brown, Blankenship and Kramer2007). We can use several different tools to determine if and what students learn in our course, including: conventional tests, graphic representation of concepts, journals, research papers, portfolios, and peer assessment (McKeachie Reference McKeachie2005). Other forms of assessment include detecting changes in self-efficacy (Maier and Curtin Reference Maier and Curtin2005; Brown, Blankenship, and Kramer Reference Brown, Blankenship and Kramer2007), student knowledge, and teaching evaluations (Brown, Blankenship, and Kramer Reference Brown, Blankenship and Kramer2007).
Since our focus in this paper is on student fears, anxieties, and barriers related to conducting research, we assess whether our teaching has inspired confidence in our students to carry out the steps of a research program on their own. Increasingly, schools are adopting a capstone model and the goal of instructors in this type of teaching environment is for students to be confident and competent to carry out self-directed projects without significant faculty input. Thus, to measure student outcomes for this particular goal, our assessment technique gauges if students' confidence in their research methods abilities increases.Footnote 2
In this paper, we look at three separate studies we conducted. First, we review our survey of students in methods courses to identify barriers to student confidence in various stages of the research methods course. Next, using a survey of professors who teach research methods, we compare student problems with professor perceptions of student problems. We identify ways in which professors can—and do—attempt to address these student barriers when they design their courses, projects, assignments, and in-class activities. Finally, we provide one assessment technique from our own course as an example for evaluating the success of attempts at overcoming student barriers. Our concluding discussion addresses best practices in teaching research methods.
METHODS
Student Barriers
To understand what barriers students perceive to their success in the research process, we surveyed students enrolled in three quantitative methods courses, one honors course, and two regular courses, at a large midwestern university. This particular methods course is not required for political science majors at this university,Footnote 3 yet it does fulfill a liberal arts mathematical thinking requirement. As a result, approximately 50% of the students are political science majors. Although this sample differs from the norm of a required course with only political science majors, the differences between our sample and a sample of political science majors in a required course are likely to be minimal.Footnote 4
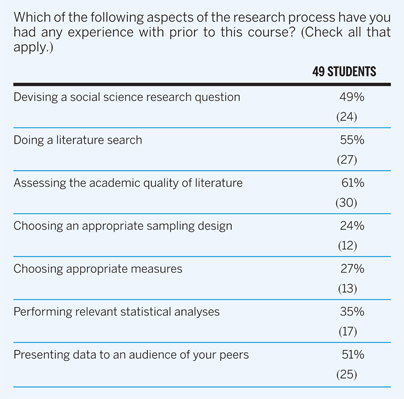
Forty-nine students completed short questionnaires near the beginning of the term. Given a list of steps in the research process,Footnote 5 students designated which research skills they had experience with prior to their enrollment in the course (see Table 1). Next, students documented their concerns about completing each step in the research process. To quantify the comments, we developed a list of broader categories and classified the comments accordingly (see Tables 2 through 8). This survey, along with all of the other survey instruments and supplementary results, are available on our Web site.Footnote 6
Student Experience with the Research Process

Professor Perceptions of Barriers and Their Solutions
In a second survey, we examined what teachers of research methods courses consider the barriers for students and how they design their courses to overcome these obstacles. To explore these questions, we surveyed teachers of methods courses and asked them to consider what barriers students face, to share instructional solutions to address potential student obstacles, and to submit their course syllabi.Footnote 7
To sample professors, we obtained a list of four-year institutions from the Carnegie Foundation (Carnegie Foundation for the Advancement of Teaching 2006). The data set, updated by the Carnegie Commission on Higher Education since 1970, features multiple measures for each college and universitie in the U.S. for things such as: its areas of instruction, a profile of its student body, and its geographic setting. From the Carnegie list of 1,711 colleges and universities, we randomly sampled 100 four-year colleges and universities, eliminating schools that did not have a four-year political science degree.Footnote 8 Our sample of 100 institutions is approximately 5.8% of four-year institutions in Carnegie's database.Footnote 9 We do not suggest that our sample definitively represents four-year Carnegie institutions, but are nonetheless confident that our sample reasonably represents the diversity of practices of methods professors in our field.
We then searched the Web sites of the sampled schools to identify either a professor of methods or a department chair who could refer us to an appropriate instructor.Footnote 10 We sent an e-mail invitation for the study to each identified instructor. After the introductory letter, if we received no response, we sent up to two reminder e-mails.Footnote 11 The data were collected on surveymonkey.com, an online data collection bank. Our response rate was 50%, with 50 of 100 methods professors responding.Footnote 12
On average, our respondents have been teaching methods in political science for 5.33 years. Over 70% of respondents indicated a methods course is a formal requirement in their department's curriculum.Footnote 13 Of the types of methods courses, 25% indicated they teach a “scope and methods” course, 26% teach research design, 31% teach quantitative analysis, and 14% teach a senior capstone. In Tables 2 through 8, we summarize the most popular responses to the questions of specific concerns of students, compared to the obstacles professors think students face (described in the Results section).
Student Assessment
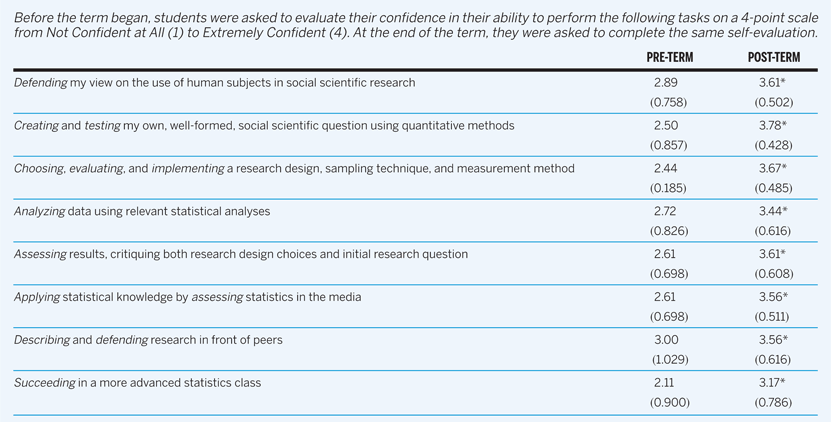
Our third study assesses whether or not instructors succeed in reducing anxiety and increasing students' confidence in their research abilities. By conducting a test of each student's confidence before and after a methods course, we can assess changes in student confidence. As stated earlier, promoting student confidence is one method to judge the success of a methods course. Students in a quantitative methods course at the same large midwestern university described aboveFootnote 14 were given a survey at the beginning and end of the semester, with each of the goals for the class, including: defending their view on the use of human subjects; creating and testing a research question; choosing, evaluating, and implementing a research design; sampling technique and research method; analyzing data; assessing results; giving a presentation; and, finally, their ability to succeed in a more advanced statistics course. For each course objective, the students indicated how confident they felt in their ability to perform such a task on a 4-point scale, from 1 (“Not at All Confident”) to 4 (“Extremely Confident”).
RESULTS
Our first finding, consistent with other research (e.g., Brown, Blankenship, and Kramer Reference Brown, Blankenship and Kramer2007), was that students were very unfamiliar with the steps of the research process. As shown in Table 1, almost half of the students had some experience with social science research questions, literature searches, assessing the quality of academic literature, and giving a presentation. Far fewer than half of the students had any experience with sampling, measurement, and statistical analyses, crucial components for completing a research project.Footnote 15
Generating a Social Science Research Question
Nearly all professors (94%) believe it is important to teach how to develop a social science research question. While many students say that they have had experience in this area, most faculty estimated that 20% or fewer students come to their courses with some prior instruction in this area.
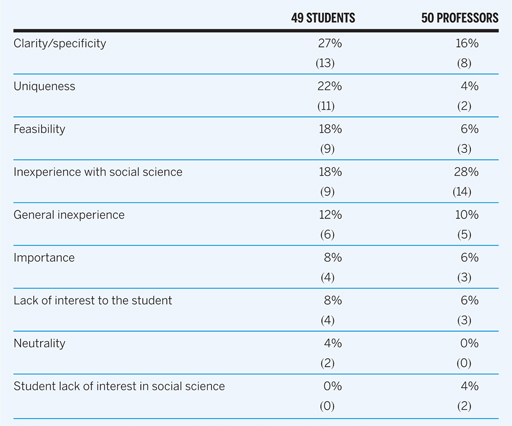
When faced with the task of devising a research question, the two most common barriers reported by students were developing a question that is clear and/or specific and generating a unique question (see Table 2). Students want a question that “hasn't already been asked” and is “original.” Other less frequently reported barriers were lack of experience with asking social science research questions, interest in the topic, importance, feasibility, and finally, that the topic is “neutral” or “unbiased.”
Barriers in the Research Process: Social Science Research Question*

* Note that percentages can add to more than 100 because of multiple mentions.
While the faculty sample did not differ vastly from the students in their perceptions of student barriers overall, there are some noteworthy disparities. First, students mentioned the uniqueness of their project more often as an obstacle than professors did. Faculty underestimated student concern that a project needs to be completely new and different in order for it to be valuable. Second, students were more concerned with the feasibility of the project (e.g., what types of resources do I need and where can I find those resources?). Professors may not recognize this student fear because, as experts, we likely have a better automatic understanding of the feasibility of student projects and the scope of our expectations. To calm student fears regarding developing a research question, professors employ examples, such as breaking down good (or bad) research questions for the class to contemplate, and give assignments that require students to read an article to identify the author's causal question.
Literature Review
Students have more experience with the literature review aspect of the research process than almost any other area: 55% of students claimed prior familiarity with this topic and professors' estimates agree with this claim.
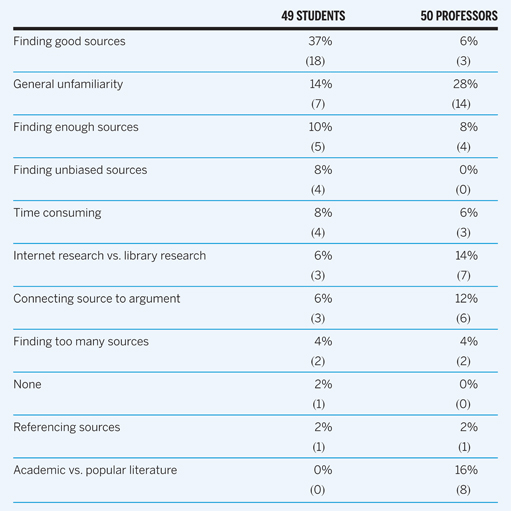
Having prior experience with the topic, however, did not alleviate all student concerns. Students' primary concerns with the literature review process reflect the difficulty of sorting through the many available sources: finding good sources (37%), enough sources (10%), and deciding how to navigate through too many sources (4%) (see Table 3). Another concern of students was to find unbiased sources (10%), an unusual statement that may reflect students' difficulty assessing the academic quality of literature (discussed fully in the next section).
Barriers in the Research Process: Doing a Literature Search*

* Note that percentages can add to more than 100 because of multiple mentions.
Professors are more concerned with the students' inability to connect the literature to the research question (12%) and the students' general unfamiliarity with literature searches (28%). Significantly, professors indicated that students do not seem to know what constitutes an appropriate source and struggle to differentiate between academic and popular literature. Professors reported the following solutions to the fears associated with literature reviews: in-class instruction, visits to the library, presentations by librarians, demonstrations of JSTOR and other search engines, and requiring student to create an annotated bibliography.
Finding and Assessing Literature
In order to write a literature review, students should be able to assess scholarly literature.
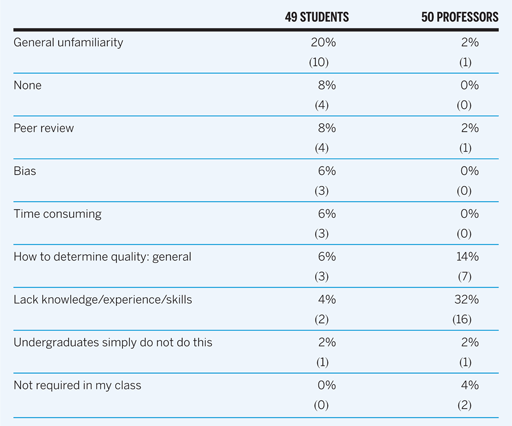
Students reported experience in this area (61%), but the majority of the faculty disagreed, estimating that 20% or fewer of their students had experience in this area (see Table 4). Students may be so unfamiliar with assessing literature that they are not even sure what it means. The most commonly reported student barrier was a general unfamiliarity with this step (20%), followed by having no concerns (8%), concerns about peer review (8%), and concerns about bias (6%). The concern with bias is peculiar—students were concerned that the research that they find might have a particular “agenda” instead of being truly scientific. Faculty perceive students as lacking the knowledge, experience, and skills to navigate through academic literature. To solve this problem, they again turn to instruction from librarians and general rules of thumb, such as identifying top journals for the students, and introducing them to the concept of peer review.
Barriers in the Research Process: Assessing Academic Quality of Literature*

* Note that percentages can add to more than 100 because of multiple mentions.
Choosing Appropriate Sampling
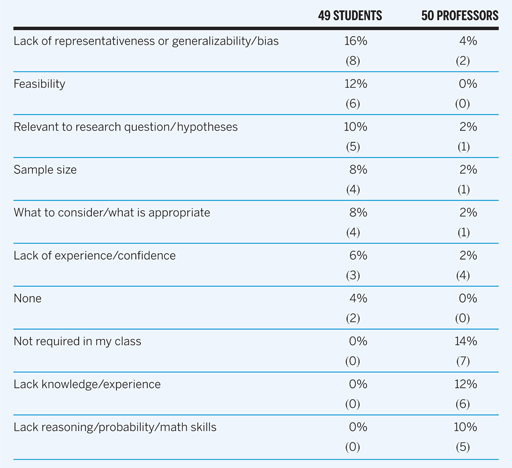
Sampling design is often taught so students understand methods of random sampling and how deviation from those methods affects results. Of faculty surveyed, 69% stated that teaching sampling concepts was “very” or “extremely” important in methods courses. Faculty members estimated 20% of students have experience with this topic, which matches student reports (24%) (see Table 5).
Barriers in the Research Process: Sampling*

* Note that percentages can add to more than 100 because of multiple mentions.
Faculty members cited that students lack quantitative skills and knowledge related to probability. A surprising number of professors mentioned they want to eliminate this topic, in part because sampling is “beyond most students.” Both students and faculty are concerned that students lack experience with and confidence in their skills to choose a sampling design. However, students did not identify the mathematics involved with sampling as a problem as often as faculty do. Students reported obstacles related to more global concerns such as choosing an appropriate design that is feasible, relevant, and representative.
Faculty respondents offered several useful approaches to teach concepts relating to probability, different types of sampling techniques, target population, representativeness, and bias, including discussing examples in small groups, posing scenarios in class, or assigning homework where students apply and create different sampling designs.
Choosing Appropriate Measurement
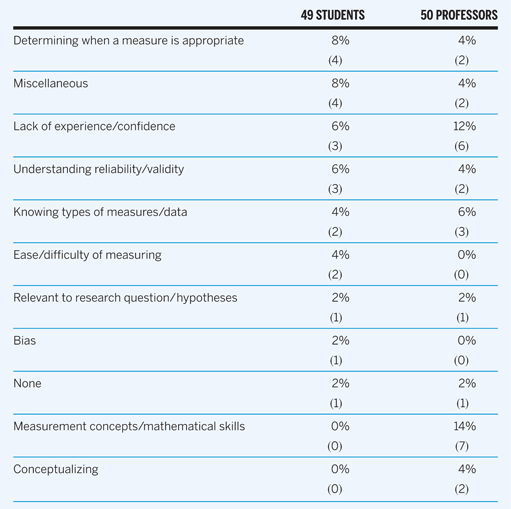
Nearly all teachers of methods in our sample (90%) agreed that it is “very” or “extremely” important to teach concept measurement, reliability, and validity. Faculty perceptions of student experience with measurement match student perceptions from our sample: 78% of faculty estimated 20% or fewer of the students in their courses come into the course with any familiarity with measurement, which roughly matches the 27% of students reporting prior exposure.
Faculty and students largely perceive the same student barriers with regard to measurement (see Table 6), including: knowing what types of measures exist, understanding reliability and validity, and identifying which measure is appropriate in a given research situation. Students commented that “because there are so many methods you can use to measure, it's difficult to decide which are most effective” and that “making sure I'm measuring what I actually intended to measure” is a concern.
Barriers in the Research Process: Measurement*

* Note that percentages can add to more than 100 because of multiple mentions.
As with sampling, the professors cited their perception that students lack requisite mathematical skills and knowledge of measurement concepts. For example, faculty commented that “numbers scare [the students]” and that students “often have difficulty understanding how something can be measured, and what the limits of various measures are.” No students, however, mentioned such concerns.
Common themes in instructional topics related to measurement included discussing reliability and validity, measurement, and operational definitions. One faculty member asks students to operationalize variables in real life before asking them to think about applying measurement concepts to politics. Faculty stressed using a variety of measurement examples in class, including having students examine measures used in articles. In addition, faculty assign homework where students choose and assess the quality of measures for various concepts.
Performing Relevant Statistical Analyses
There is a divide among faculty with regard to whether our methods courses should teach students to perform statistical analyses. Of the respondents, 67% of faculty find it “very” to “extremely” important to teach this in their courses. Others cited time constraints, such as covering different types of methods, that prevent meaningful instruction in statistics.
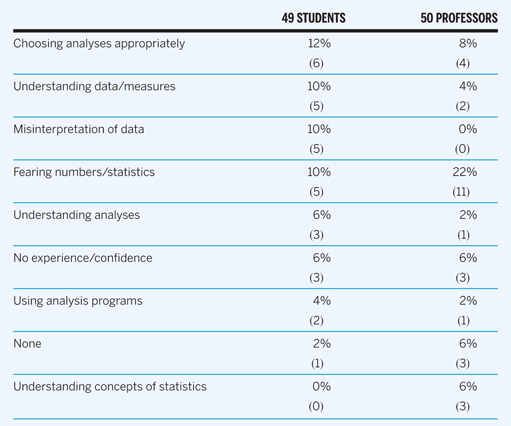
The main concern students held with regard to performing analyses of data was that they might misinterpret their findings. For example, one student reported concerns about “misinterpreting data, making sure that the data is causal and not confounded by another variable.” Both faculty and students perceive math or statistics phobias and questions surrounding how to determine what analysis is appropriate (see Table 7). Common themes in the comments included: “terror of math,” “hard to not get lost in the numbers,” and “how do I know which analysis to use?”Footnote 16 Faculty incorporate the following ideas: having students do analyses by hand, creating detailed handouts regarding types of analyses and types of data situations, assigning application assignments, and requiring weekly labs to demonstrate and practice specific techniques.
Barriers in the Research Process: Statistics*

* Note that percentages can add to more than 100 because of multiple mentions.
Presenting Data
Many teachers of methods agree that a goal of a methods course should allow for students to practice presenting data (Brandon et al. Reference Brandon, Brown, Lawrence and Van Heerde2006). Approximately 70% of faculty respondents in our survey indicated they find it “very” or “extremely” important to include presentations in their courses. Having students present in class, particularly data they have analyzed, allows students to demonstrate a deepened understanding of what their data mean.
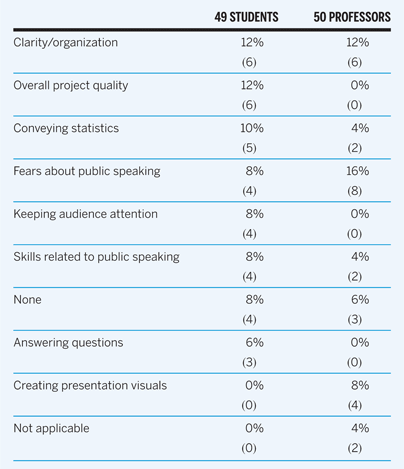
When asked what barriers they perceive with regard to presenting data, student respondents replied that they were concerned about (1) whether their conclusions were correct, (2) whether they would be asked difficult questions, and (3) whether their presentation would be interesting and clear. A few representative comments include, “making sure my data isn't flawed and fear of criticism of my data” and “knowing how to present information with clarity so people are not bored or confused.” Faculty mentioned that students lack the skills to effectively use visual aids, and to “keep their overheads or PowerPoints focused.”
Faculty perceptions of student concerns were, for the most part, correct (Table 8). One faculty member offered the following suggestion as to how to instruct students to give effective presentations: “I provide students with an example of how I present my own research at a conference, so they can see what it should look like.”
Barriers in the Research Process: Presentation*

* Note that percentages can add to more than 100 because of multiple mentions.
Student Assessment
To assess our success in overcoming student barriers, we analyze students' pre- and post-course confidence ratings (see Table 9) with regard to performing various aspects of the research process. Prior to the course, students on average rated their ability to perform each research task between 2 and 3 on a 4-point scale, ranging from 1 (“Not at All Confident”) to 4 (“Extremely Confident”). These numbers reflect the fact that, despite having familiarity with some aspects of the research project, students were not at the top of the scale in terms of their confidence. For example, 49% of students initially claimed experience with developing a research question but, on average, students rated their abilities in this area around 2.5 and still identified fears about completing this task.
Assessment of Confidence

Note: Entries are means with standard deviations in parentheses.
* Mean difference is significant at a p < 0.05 level.
As we hoped, after taking the course students were significantly more confident in their ability to create and test social scientific hypotheses, to choose an effective research design, to analyze data using relevant statistical analyses, to assess results, and to describe and defend their research in front of their peers.Footnote 17 This assessment suggests that we are addressing student fears.
DISCUSSION AND CONCLUSIONS
Our results suggest several concrete ways in which methods professors might improve their courses to better address student barriers. Given the disparity between faculty perceptions and student fears, our first suggestion is that professors would do well to conduct their own research on student fears at their particular institution. In addition to using a formal assessment tool, we recommend pairing students on the first day of class to share their concerns about the course. In our course, this exercise revealed numerous fears students were hesitant to share with the larger group. It is possible that simply having a professor acknowledge their fears might be helpful for students. Moreover, having an understanding of institution-specific student barriers may spark useful solutions. For example, if we know that students in the class are worried about navigating through a tremendous number of sources, perhaps a specific course session on this topic would be useful.
We divide the remainder of our suggestions into six major areas: examples, problems and activities, focus on conceptual issues, rules of thumb, assessment, and opportunities. One theme among faculty suggestions for alleviating student concerns is to give and use many examples. We concur: examples of a variety of research questions—both in and outside of the discipline of political science—can help students form their own ideas and understand concepts. For example, questions such as “how do voters decide?” or “why do some people have certain opinions while others do not?” can help students begin to think more theoretically and in causal terms. To help encourage polished presentations, we can give presentations of our own research or to invite our colleagues to present their research. Finally, professors might assign portions of political science articles for easy examples of concepts to refer to within class sessions.
Our second recommendation is to incorporate smaller problems and activities. For example, students can gain valuable practice with causality by breaking into groups to identify the independent and dependent variables or hypotheses in an article. Creating assignments that have natural steps to achieving a larger methods goal can be very helpful. For example, writing a literature review can be broken down into smaller parts, including an annotated bibliography followed by a review of a small number of sources on an assigned research question. Students may then feel less overwhelmed by the number of academic sources available.
Small group activities work especially well to teach many methods concepts. Given a research question, groups of students can make recommendations for a sampling design and can generate ideas regarding how to measure a concept. We have found that having students operationalize the concept of racism works well to spark discussion, particularly when followed by a critique of the reliability and validity of existing measurements. Once again, we would stress the importance of incorporating both political science and non-political science examples to pique student interest and to help students apply the concepts beyond our discipline. One of us has created a library “geocache” exerciseFootnote 18 (similar to a scavenger hunt) where student teams navigate the library system. Finally, we can alleviate students' presentation fears by having them exchange presentations ahead of time to generate questions for one another.
Third, we want to emphasize the importance of tying specific details to the larger, more global point, particularly in instruction on sampling. In identifying student fears on sampling, faculty overestimate student fears regarding math and did not identify the more global, pragmatic, and conceptual concerns of students, such as knowing what measures already exist and how to choose the appropriate ones. We suggest a constant return to the bigger picture, especially when delving into probabilistic or statistical details.
A fourth solution for alleviating student fears is to give students rules of thumb. For example, when we professors look at a list of sources, we often use shortcuts—names of journals, book publishers, authors, article titles, or an examination of independent and dependent variables—to determine the relevance of a source. When looking at a regression table, we use similar rules of thumb—looking at the R-squared, and the direction and significance of our independent variables. Teaching students our shortcuts can help to alleviate their fears and to increase competence.
Fifth, assessment of student learning through a variety of techniques is a good way to evaluate our success. In addition to assessing student learning through exams and projects, we can also measure how confident students feel in their abilities, in order to make sure that their fears are alleviated. When students feel confident in their abilities, they may be more able to competently conduct research. In this paper, we present one way to assess student improvement but others are possible.
Finally, we must give students the necessary opportunities to learn all of the different components to the research process put forth by the APSA Teaching and Learning Track (Brandon et al. Reference Brandon, Brown, Lawrence and Van Heerde2006). Since methods courses are often too crowded with topics, we advocate attempts to incorporate methods topics into substantive courses to reinforce the work done in methods courses (e.g., Brown, Blankenship, and Kramer Reference Brown, Blankenship and Kramer2007) and particularly for schools where methods courses are not required. To that end, we are currently developing short modules that would take up minor amounts of time in substantive courses, but would significantly help reinforce methodological concepts for students.
In conclusion, to help professors teaching methods courses, our research suggests three steps. First, we need to understand what challenges and obstacles students perceive when they walk into our classroom that might prevent them from being able to carry out a research project. This may be as simple as asking students specific questions about their previous experiences and what barriers they perceive. Second, when designing our course activities and assignments, we ought to consider what types of activities could help students overcome these specific obstacles. And, finally, we should assess our course assignments and activities to make sure that our efforts were successful. Our conscious reflection regarding our students' lack of confidence or skills can allow us to approach teaching methods in a more effective way. By considering and assessing the ways in which our pedagogies may be at odds with student barriers, we can more effectively engage students in our methods courses.