
1. Introduction
The flow past bluff bodies with sharp corners is of fundamental importance and occurs in several applications. In civil engineering, for example, structural elements such as pylons, high-rise buildings and decks often feature sharp corners (Tamura, Miyagi & Kitagishi Reference Tamura, Miyagi and Kitagishi1998). In addition to the classic von Kármán-like vortex street typical of bluff bodies, the flow past bodies with sharp corners presents a separation at the leading edge (LE) corner: the shear layer detaches, becomes unstable, and possibly reattaches if the body is sufficiently long.
The cylinder with rectangular cross-section is the prototype of such bodies. The flow past rectangular cylinders depends on the aspect ratio  ${{A{\kern-4pt}R} } \equiv L/D$ (where
 $L$ and
 $D$ are the streamwise and cross-stream sizes of the cylinder). For small aspect ratios, i.e.
 ${A{\kern-4pt}R} < 2$, the flow cannot reattach, whereas for intermediate
 ${A{\kern-4pt}R}$, i.e.
 $2 \le {A{\kern-4pt}R} \le 3$, the reattachment is intermittent. For larger
 ${A{\kern-4pt}R}$, the flow reattaches permanently, generating a large recirculating region over the cylinder side, and separates again at the trailing edge (TE). In this case, vortex shedding occurs from both LE and TE (Okajima Reference Okajima1982; Hourigan, Thompson & Tan Reference Hourigan, Thompson and Tan2001; Chiarini, Quadrio & Auteri Reference Chiarini, Quadrio and Auteri2022). The value
 ${A{\kern-4pt}R} =5$ defines the Benchmark for the Aerodynamics of the 5 : 1 Rectangular Cylinder (BARC), the geometry considered in the present work. The BARC (see https://www.aniv-iawe.org/barc-home/), launched at the VIth International Colloquium on Bluff Body Aerodynamics and Applications, is meant to characterise the main features of the turbulent flow and to set the standards for simulations and experiments. Recently, several studies have considered this benchmark, with results that can differ already for the mean flow field, showing how challenging is the correct description of the fundamental features of the BARC flow (Bruno, Salvetti & Ricciardelli Reference Bruno, Salvetti and Ricciardelli2014).
The recirculating region over the longitudinal cylinder side is important in the dynamics of the flow, and has been the subject of several studies. Along the sides of a blunt flat plate with sharp corners, Cherry, Hillier & Latour (Reference Cherry, Hillier and Latour1984) identified experimentally a low-frequency motion throughout the recirculating region, accompanied by a weak flapping of the shear layer, consisting in a shedding of pseudo-periodic train of vortical structures followed by a quiescent phase. In their experiments, Kiya & Sasaki (Reference Kiya and Sasaki1983) found that the large-scale unsteadiness is accompanied by an enlargement and shrinkage of the recirculating region, and by a flapping motion of the shear layer near the separating line. Later, Kiya & Sasaki (Reference Kiya and Sasaki1985) observed that the shrinkage rate is larger than the enlargement rate, and that the strength of the shedding of large-scale vortices depends on the phase of the low-frequency unsteadiness. They also proposed a mathematical model for the unsteady flow in the reattachment zone. The picture was later confirmed numerically by Tafti & Vanka (Reference Tafti and Vanka1991). The recirculating region also defines the three-dimensional pattern of the flow, described by Sasaki & Kiya (Reference Sasaki and Kiya1991) for a wide range of Reynolds numbers. They observed that the separated shear layer rolls up to form hairpin-like structures whose arrangement depends on the Reynolds number. A similar scenario is described by Chaurasia & Thompson (Reference Chaurasia and Thompson2011) and Huang et al. (Reference Huang, Zhou, Tang and Zhang2017), who studied the three-dimensional instability of the flow over a long, sharp rectangular plate. They found that vortices shed from the LE are elliptically unstable to three-dimensional perturbations, and originate hairpin-like structures.
Cimarelli, Leonforte & Angeli (Reference Cimarelli, Leonforte and Angeli2018) were first to perform a direct numerical simulation (DNS) of the BARC, at a value of the Reynolds number such that the flow is turbulent. They found that the recirculating region over the cylinder side is populated by small-scale motions, namely quasi-streamwise vortices and streamwise velocity streaks induced by hairpin-like structures, and observed spanwise vortices in the reverse flow region. Moreover, a self-sustaining cycle was identified that involves both the small- and large-scale motions, and links the velocity fluctuations generated over the cylinder side with those in the wake. Later, Chiarini & Quadrio (Reference Chiarini and Quadrio2021) studied via DNS the single-point budget of the Reynolds stresses of the same flow at the same  $Re$, and located where production, redistribution and dissipation of each component of the Reynolds stress tensor are most relevant. Energy is drained from the mean flow to feed the streamwise fluctuations mainly along the LE shear layer and in the core of the recirculating region. For the vertical component, energy moves from the mean field to the fluctuating field within the recirculating region and along the centreline of the wake, but the opposite occurs over the shear layer, where production is negative. Pressure–strain was found to reorient partially the streamwise fluctuations towards the cross-stream ones almost everywhere, except close to the cylinder side and along the centreline of the wake.
The two studies mentioned above observed certain turbulent structures in different regions of the flow, but how these structures contribute to flow statistics was not described; thus a complete scale-space characterisation of the flow is still lacking. Moreover, the evolution of the flow from a non-equilibrium boundary layer over the horizontal wall of the cylinder towards a free shear flow in the wake warrants a detailed description, which should disentangle the highly multiscale nature of the flow. In this work, these points are accomplished by leveraging the anisotropic generalised Kolmogorov equations (AGKE) (Hill Reference Hill2001), used by Gatti et al. (Reference Gatti, Chiarini, Cimarelli and Quadrio2020) to extend the analysis of turbulence made possible by the generalised Kolmogorov equation (GKE). The GKE (Danaila et al. Reference Danaila, Anselmet, Zhou and Antonia2001; Marati, Casciola & Piva Reference Marati, Casciola and Piva2004) is an exact budget equation for the second-order structure function, whereas the AGKE are a set of exact budget equations for each component of the second-order structure function tensor. As such, the AGKE address separately each component of the Reynolds stresses in the compound space of scales and positions. Unlike the GKE, the AGKE feature a pressure–strain term that describes redistribution in scale and physical spaces, and that is important in the BARC flow.
Hence, in this work we employ the AGKE to study the structure of turbulence in the BARC flow, starting from the DNS database produced by Chiarini & Quadrio (Reference Chiarini and Quadrio2021). The specific goals are: (i) to provide an exhaustive scale-space characterisation of the flow, by identifying the statistically significant structures in the various regions; (ii) to describe the role and the dynamical significance of these structures in terms of production and redistribution of Reynolds stresses and energy transfers; (iii) to characterise the near-wake region, where structures generated over the cylinder side interact with the large-scale motions associated with the von Kármán-like vortex street. In the preliminary § 2, the DNS database is described briefly, and the main features of the BARC flow are recalled. This section also summarises the AGKE tailored to the present flow. The AGKE are then used to describe the flow over the cylinder side in § 3, and in the near wake in § 4. Finally, a concluding discussion is presented in § 5.
2. Prerequisites
2.1. The DNS database
The BARC considers the flow over a spanwise-indefinite rectangular cylinder with length  $L$ and thickness
 $D$, and a 5 : 1 length-to-thickness ratio. The present work is based upon a DNS dataset produced by Chiarini & Quadrio (Reference Chiarini and Quadrio2021); its main characteristics are recalled briefly below.
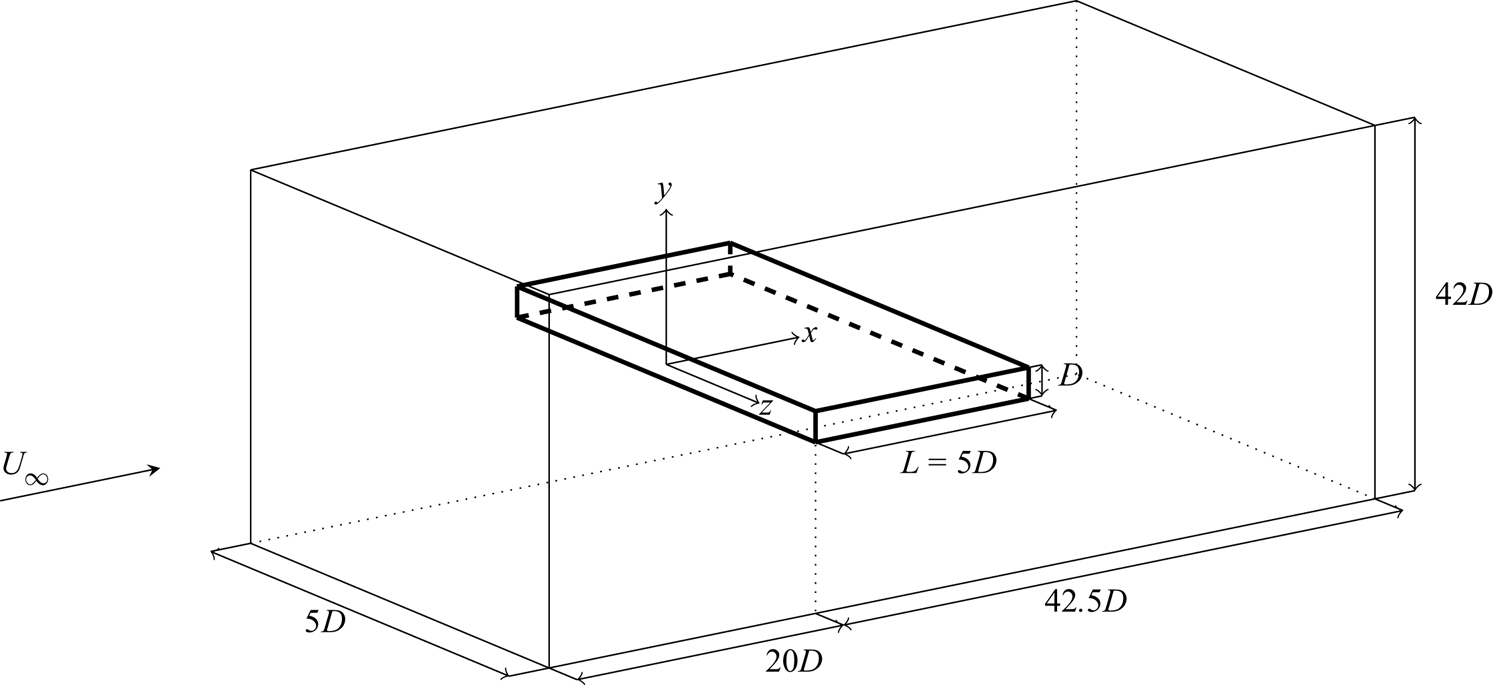
Figure 1 describes the geometry and the reference system. A Cartesian coordinate system is placed at the leading edge of the cylinder, with the  $x$-,
 $y$- and
 $z$-axes denoting the streamwise, vertical and spanwise directions (the alternative notation
 $x_1, x_2, x_3$ is also used). The body extends for
 $0 \le x \le 5D$, and
 $y=0$ corresponds to its symmetry plane. The computational domain extends for
 $-20 D \le x \le 42.5D$ in the streamwise direction, for
 $-21D \le y \le 21D$ in the vertical direction, and
 $-2.5D \le z \le 2.5D$ in the spanwise direction. The incoming velocity is uniform and aligned with the
 $x$-axis, i.e.
 $(U_\infty,0,0)$. The flow is governed by the incompressible Navier–Stokes equations for velocity
 $\boldsymbol {u}=(u,v,w)$ and pressure
 $p$. Unperturbed flow is enforced at the inlet and at the far field at
 $y=\pm 21D$, periodic conditions are set at the spanwise boundaries to account for spanwise homogeneity, and a convective condition
 $\partial \boldsymbol {u} / \partial t = U_\infty \,\partial \boldsymbol {u}/\partial x$ is used at the outlet. No-slip and no-penetration conditions are applied at the cylinder surface. The Reynolds number, based on the unperturbed velocity, cylinder thickness and kinematic viscosity
 $\nu$, is
 $Re=U_\infty D / \nu = 3000$. Unless otherwise noted, all quantities are made dimensionless with
 $D$ and
 $U_\infty$; hereinafter, capital letters indicate mean fields, and small letters denote fluctuations around them.
Sketch of the geometry, computational domain and reference system. The reference length is the body height  $D$.

The Navier–Stokes equations are solved using a DNS code introduced by Luchini (Reference Luchini2016), which employs second-order finite differences on a staggered grid in the three directions. The cylinder is described via an implicit second-order-accurate immersed-boundary method (Luchini Reference Luchini2013, Reference Luchini2016). The computational domain is discretised with  $N_x=1776$,
 $N_y=942$ and
 $N_z=150$ points in the three directions. In the spanwise direction, their distribution is uniform, whereas in the streamwise and vertical directions, the resolution becomes finer near the body and is maximum close to the LE and TE corners, where grid spacing is
 ${\rm \Delta} x = {\rm \Delta} y \approx 0.0015$.
The momentum equation is advanced in time using a third-order Runge–Kutta scheme; the Poisson equation for pressure is solved by an iterative successive over-relaxation algorithm. The time step  ${\rm \Delta} t$ varies so as to fulfil the condition of the unitary Courant–Friedrichs–Lewy number; its average value is
 ${\rm \Delta} t \approx 0.0013$. Overall, the total averaging time is
 $1819 D/U_\infty$, and the database consists in
 $1819$ snapshots of the entire flow field saved every time unit.
2.2. The BARC flow
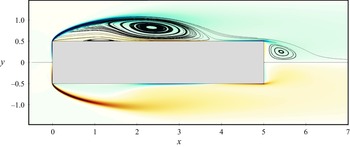
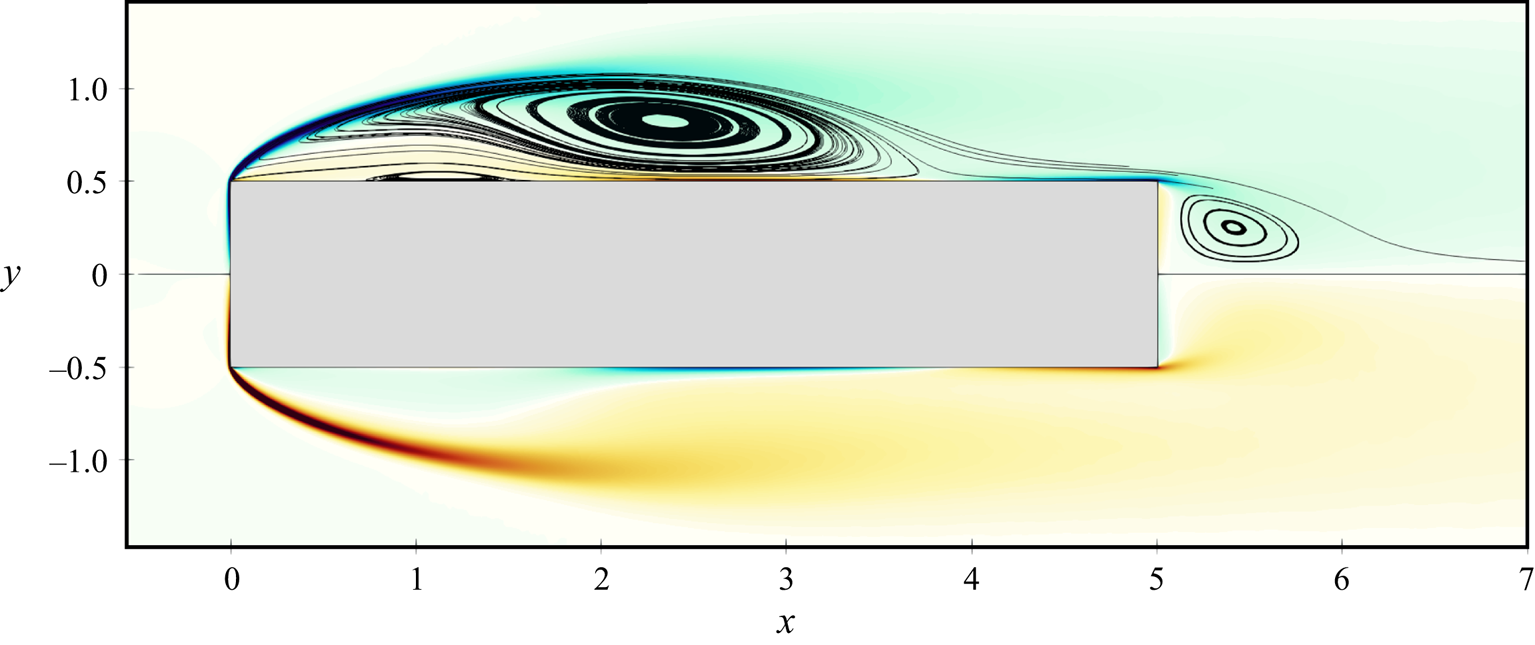
To provide a qualitative illustration of the flow, figure 2 plots the mean streamlines overlaid to a colour map of the mean spanwise vorticity  $\varOmega _z$. The flow separates at the LE corner and reattaches over the cylinder longitudinal side, before eventually separating again at the TE. Three recirculating regions exist. A large recirculating region is identified by the shear layer separating from the LE corner and reattaching at
 $x \approx 3.95$, and is hereafter referred to as the primary vortex. A further, thin recirculating region is located below the primary vortex: the reverse boundary layer induced by the primary vortex separates due to the adverse pressure gradient (Simpson Reference Simpson1989), and originates a smaller counter-rotating recirculating region, referred to as the secondary vortex. The third recirculating region is delimited by the shear layer separating from the TE corner, and is referred to as the wake vortex. The symmetry of the plot in figure 2 with respect to
 $y=0$ demonstrates the adequacy of the statistical sample: in fact, using one-half of the sample yields perfectly overlapping results.
Mean streamlines (top half only) plotted over a colour contour of the mean spanwise vorticity  $\varOmega _z$ (blue/red indicates negative/positive values in the range
 $-20 \le \varOmega _z \le 20$).
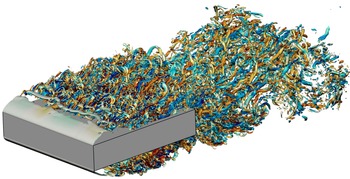
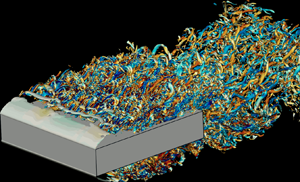
The BARC flow contains a wide range of structures, visualised in figure 3 via the  $\lambda _2$ criterion (Jeong & Hussain Reference Jeong and Hussain1995). Immediately after the LE, the shear layer remains two-dimensional and laminar, but already at
 $x \approx 0.5$, a Kelvin–Helmholtz instability generates large spanwise tubes (Sasaki & Kiya Reference Sasaki and Kiya1991; Tenaud et al. Reference Tenaud, Podvin, Fraigneau and Daru2016; Cimarelli et al. Reference Cimarelli, Leonforte and Angeli2018; Moore, Letchford & Amitay Reference Moore, Letchford and Amitay2019). Further downstream, the spanwise tubes, stretched by the mean gradients, develop a modulation in the spanwise direction, and then roll up into hairpin-like vortices. At
 $x \ge 2.5$, the stretched hairpin vortices break down to small-scale elongated streamwise vortices (Tenaud et al. Reference Tenaud, Podvin, Fraigneau and Daru2016; Cimarelli et al. Reference Cimarelli, Leonforte and Angeli2018). At this stage, the flow is fully turbulent, and small- and large-scale structures coexist. At the TE, the flow separates again, and structures typical of wall turbulence originating from the longitudinal cylinder side coexist with the large structures created by the instability of the separating shear layers. Eventually, moving downstream, the flow recovers the features of a classic turbulent wake after a bluff body.
Instantaneous snapshot of the BARC flow: perspective view of the isosurfaces at  $\lambda _2 = -5$. Colour depicts streamwise vorticity
 $\omega _x$, with the blue-to-red colour map ranging in
 $-10 \le \omega _x \le 10$.

2.3. The anisotropic generalised Kolmogorov equations
In the present work, turbulent production, redistribution and transfers throughout scales and physical positions are studied via the anisotropic generalised Kolmogorov equations (AGKE) (Hill Reference Hill2002; Gatti et al. Reference Gatti, Chiarini, Cimarelli and Quadrio2020). They are the exact budget equations for the components of the second-order structure function tensor  $\langle {\delta u_i\,\delta u_j} \rangle$. The operator
 $\langle \,\cdot \,\rangle$ denotes ensemble averaging, as well as averaging in homogeneous directions (if present) and in time (if the flow is statistically steady). In the definition of
 $\langle {\delta u_i\,\delta u_j} \rangle$,
 $\delta u_i$ is the
 $i$th component of the fluctuating velocity increment between two points
 $\boldsymbol {x}_1$ and
 $\boldsymbol {x}_2$, identified by their midpoint
 $\boldsymbol {X} = ( \boldsymbol {x}_1 + \boldsymbol {x}_2 ) / 2$ and by their separation vector
 $\boldsymbol {r}= \boldsymbol {x}_1 - \boldsymbol {x}_2$, i.e.
 $\delta u_i = u_i ( \boldsymbol {x}_1,t ) - u_i ( \boldsymbol {x}_2,t )$. In the most general case,
 $\langle {\delta u_i\,\delta u_j} \rangle$ depends upon the six coordinates of the vectors
 $\boldsymbol {X}$ and
 $\boldsymbol {r}$, and upon the time
 $t$. This tensor is linked (Davidson, Nickels & Krogstad Reference Davidson, Nickels and Krogstad2006; Agostini & Leschziner Reference Agostini and Leschziner2017) to the single-point Reynolds stresses and to the spatial cross-correlation tensor as
 \begin{equation} \langle {\delta u_i\,\delta u_j} \rangle ( \boldsymbol{X}, \boldsymbol{r}, t ) = V_{ij} ( \boldsymbol{X},\boldsymbol{r}, t ) - R_{ij} ( \boldsymbol{X}, \boldsymbol{r},t ) - R_{ji} ( \boldsymbol{X},\boldsymbol{r}, t ), \end{equation}
where
 \begin{equation} V_{ij} ( \boldsymbol{X}, \boldsymbol{r}, t ) = \langle {u_iu_j} \rangle \left( \boldsymbol{X} + \frac{\boldsymbol{r}}{2}, t \right) + \langle {u_i u_j} \rangle \left( \boldsymbol{X} - \frac{\boldsymbol{r}}{2}, t \right), \end{equation}
is the sum of the single-point Reynolds stresses at the  $\boldsymbol {X} \pm \boldsymbol {r}/2$ points, and
 \begin{equation} R_{ij} ( \boldsymbol{X}, \boldsymbol{r}, t ) = \left\langle { u_i \left( \boldsymbol{X} + \frac{\boldsymbol{r}}{2}, t \right) u_j \left( \boldsymbol{X} - \frac{\boldsymbol{r}}{2}, t \right) } \right\rangle , \end{equation}
is the two-points spatial cross-correlation tensor. For large enough  $| \boldsymbol {r} |$, the correlation function vanishes, and
 $\langle {\delta u_i\,\delta u_j} \rangle = V_{ij}$.
The relationship (2.1) between  $\langle {\delta u_i\,\delta u_j} \rangle$ and
 $R_{ij}$ is worth a brief discussion, as it will be used implicitly often throughout the manuscript, whenever correlation or anticorrelation of velocity fluctuations components at two points
 $\boldsymbol {X} \pm \boldsymbol {r}/2$ is inferred directly from
 $\langle {\delta u_i\,\delta u_j} \rangle$. When
 $\boldsymbol {r}$ involves only homogeneous directions,
 $V_{ij}$ depends only on
 $\boldsymbol {X}$ and
 $t$, as
 $\boldsymbol {r}$ drops from the list of its independent variables. In this case, (2.1) reduces to
 $V_{ij}(\boldsymbol {X},t)=2 \langle {u_i u_j} \rangle (\boldsymbol {X},t)$, and the scale dependence of
 $\langle {\delta u_i\, \delta u_j} \rangle$ is determined entirely by the correlation functions
 $R_{ij}(\boldsymbol {X},\boldsymbol {r},t)=R_{ji}(\boldsymbol {X},\boldsymbol {r},t)$. Therefore, at a given
 $\boldsymbol {X}$ and time
 $t$, a local maximum/minimum of
 $\langle {\delta u_i\,\delta u_j} \rangle$ at a certain
 $\boldsymbol {r}$ is always associated with a negative/positive peak of
 $R_{ij}$. In contrast, when dealing with separations in inhomogeneous directions,
 $V_{ij}$ depends on both
 $\boldsymbol {X}$ and
 $\boldsymbol {r}$, and therefore the scale behaviour of
 $\langle {\delta u_i\,\delta u_j} \rangle$ is determined not only by the correlation tensor
 $R_{ij}$ but also by
 $V_{ij}$ itself. To simplify the interpretation of the results, whenever non-zero separations in non-homogeneous directions are involved, we always verify whether local peaks of the structure functions are actually due to local maxima/minima of the correlation functions.
The BARC flow is statistically steady, and statistically homogeneous along the  $z$-direction. The independent variables reduce to five, i.e.
 $(r_x,r_y,r_z,X,Y)$, and the AGKE written for the BARC flow become
 \begin{align} &\underbrace{- \langle { u_k^*\,\delta u_j} \rangle \,\delta \left( \frac{\partial U_i}{\partial x_k} \right) - \langle {u_k^*\,\delta u_i} \rangle \, \delta \left( \frac{ \partial U_j }{ \partial x_k } \right) - \langle {\delta u_k\,\delta u_j } \rangle \left(\frac{\partial U_i}{ \partial x_k} \right)^* - \langle { \delta u_k\,\delta u_i } \rangle \left( \frac{\partial U_j}{\partial x_k} \right) ^*}_{\text{production } (P_{ij})} \nonumber\\ &\quad +\underbrace{\frac{1}{\rho} \left\langle {\delta{p}\,\frac{\partial \delta u_i}{\partial X_j}} \right\rangle + \frac{1}{\rho} \left\langle {\delta p\,\frac{\partial \delta u_j}{\partial X_i}} \right\rangle }_{\text{pressure--strain } (\varPi_{ij})} - \underbrace{4 \epsilon_{ij}^* }_{\text{pseudo-dissipation } (D_{ij})} = \underbrace{\frac{\partial \phi_{k,ij}}{\partial r_k} + \frac{\partial \psi_{\ell,ij}}{\partial X_\ell}}_{\text{divergence of fluxes}}, \end{align}
where  $k=1,2,3$,
 $\ell =1,2$, and the asterisk indicates the average of a quantity over the two points
 $\boldsymbol {X} \pm \boldsymbol {r}/2$. The left-hand side is interpreted as a source term and describes the net production of
 $\langle {\delta u_i\,\delta u_j} \rangle$ in the space of scales (
 $\boldsymbol {r}$) and in the physical space (
 $\boldsymbol {X}$). It features the production tensor
 $P_{ij}$, which describes the energy exchange between the mean and fluctuating field, the pseudo-dissipation tensor
 $D_{ij}$, and the pressure–strain tensor
 $\varPi _{ij}$, which accounts for redistribution. When considering a separation vector with null components in the non-homogeneous directions,
 $D_{ij}(\boldsymbol {X},\boldsymbol {r})$ does not have scale dependence, and besides a multiplicative factor, it corresponds to the pseudo-dissipation tensor
 $\epsilon _{ij}$ for the single-point Reynolds stresses. Overall, the source term equals the divergence of the five-dimensional flux vector
 $\boldsymbol {\varPhi }_{ij}=(\boldsymbol {\phi }_{ij},\boldsymbol {\psi }_{ij})$ at the right-hand side, where
 $\boldsymbol {\phi }_{ij}$ and
 $\boldsymbol {\psi }_{ij}$ are the scale and space components of the flux vector that describe the scale-space interactions and are defined as
 \begin{equation} \phi_{k, ij} = \underbrace{ \langle \delta U_k\,\delta u_i\,\delta u_j \rangle}_{\phi_{k,ij}^{mean}} + \underbrace{ \langle \delta u_k\,\delta u_i\,\delta u_j \rangle}_{\phi_{k,ij}^{turb}} \underbrace{{}- 2 \nu\,\frac{\partial}{\partial r_k} \langle \delta u_i\,\delta u_j \rangle}_{\phi_{k,ij}^{visc}}, \quad k=1,2,3,\end{equation}
and
 \begin{align}
\psi_{\ell, ij} &= \underbrace{ \langle { U_k^*\,\delta
u_i\,\delta u_j } \rangle
}_{\psi_{\ell,ij}^{mean}} +
\underbrace{ \langle { u_k^*\,\delta u_i\,\delta u_j }
\rangle
}_{\psi_{\ell,ij}^{turb}}\nonumber\\
&\quad +\underbrace{ \frac{1}{\rho}\, \langle { \delta p\,\delta
u_i } \rangle \,\delta_{kj} +\frac{1}{\rho}\, \langle {
\delta p\,\delta u_j } \rangle \,
\delta_{ki}}_{\psi_{\ell,ij}^{press}}
\underbrace{{}- \frac{\nu}{2}\,\frac{\partial}{\partial
X_k} \langle { \delta u_i\,\delta u_j } \rangle
}_{\psi_{\ell,ij}^{visc}},
\quad \ell=1,2.
\end{align}
The space flux  $\boldsymbol {\psi }_{ij}$ features the mean, turbulent and pressure transport and the viscous diffusion, like in the budget equations for the Reynolds stresses (Pope Reference Pope2000), while the scale flux
 $\boldsymbol {\phi }_{ij}$ features all these contributions apart from the pressure transport. The sum of the three diagonal components of
 $\langle {\delta u_i\,\delta u_j} \rangle$ yields the generalised Kolmogorov equation (GKE) for the turbulent kinetic energy (Danaila et al. Reference Danaila, Anselmet, Zhou and Antonia2001; Hill Reference Hill2001; Marati et al. Reference Marati, Casciola and Piva2004).
The AGKE terms for the BARC flow have been computed by post-processing the DNS database described above. The code used for the analysis extends a high-performance software tool written for the GKE and developed by Gatti et al. (Reference Gatti, Remigi, Chiarini, Cimarelli and Quadrio2019), available freely at https://github.com/davecats/gke. Given the size of the problem, the AGKE terms have been computed in two sub-boxes within the computational domain, both encompassing the full body width. One is defined by  $0 \le x \le 5$,
 $0.5 \le y \le 1.5$, and is used for the analysis of the region over the cylinder side described in § 3; the other is defined by
 $5 \le x < 10$,
 $-1 \le y \le 1$, and is used for the near-wake analysis described in § 4.
3. Flow over the cylinder wall
3.1. Large- and small-scale structures
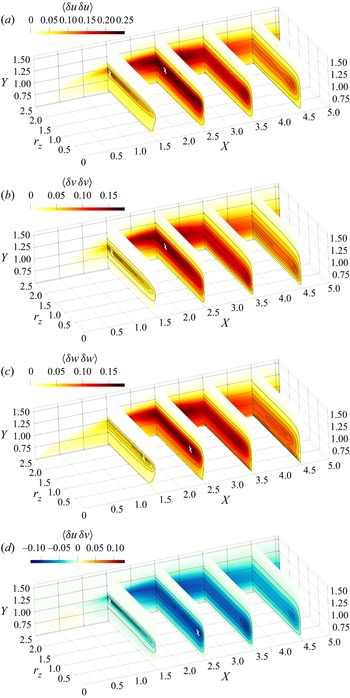
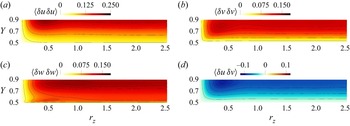
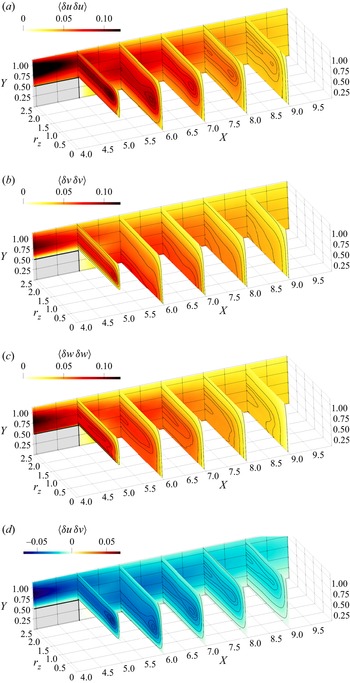
The flow structures occurring over the cylinder side, already visualised in the snapshot of figure 3, are described statistically through the diagonal components of the structure function tensor and  $\langle {\delta u\,\delta v} \rangle$, in the
 $r_x=r_y=0$ space shown in figure 4.
Components of the structure function tensor plotted in the space  $(X,Y,r_z)$ over the cylinder side. Contours in the planes
 $X=1.5,2.5,3.5,4.5$ are for
 $99\,\%, 95\,\%, 90\,\%, 75\,\%, 50\,\%$ and
 $20\,\%$ of the in-plane maximum. White crosses are used to identify local maxima when not easily visible.

Close to the LE, two-dimensional structures with spanwise-oriented vorticity are generated through a Kelvin–Helmholtz (KH) instability of the separating shear layer. They are invariant under spanwise translations, hence their contribution to  $\langle {\delta u_i\,\delta u_j} \rangle$ is largest at the maximum separation
 $r_z=L_z/2=2.5$, where
 $\langle {\delta u_i\,\delta u_j} \rangle \approx V_{ij}$. Indeed, the associated correlation function
 $R_{ij}$ decreases monotonically with
 $r_z$, being
 $R_{ij} = \langle {u_i u_j} \rangle$ at
 $r_z=0$, and
 $R_{ij} \approx 0$ at
 $r_z \approx 2.5$. The statistical footprint of these KH rolls does not appear in the map of
 $\langle {\delta w\,\delta w} \rangle$, since they do not induce
 $w$ fluctuations. The characteristic scales of the rolls are identified by inspecting the
 $r_x \neq 0$ and
 $r_y \neq 0$ spaces.
Further downstream, at about  $X \approx 1.3$, under the action of the mean shear, the KH rolls become unstable and develop a spanwise modulation with characteristic length scale
 $r_z \approx 2.4$. The tilted rolls can now induce
 $w$-fluctuations too, and a local maximum in
 $\langle {\delta w\, \delta w} \rangle$ appears at
 $r_z \approx 0.5$, indicative of the streamwise scale of the (unmodulated) rolls. Part of the
 $u$- and
 $v$-fluctuations is reoriented into
 $w$-fluctuations by the pressure–strain (see § 3.3) for kinematic reasons. As a result, here the
 $r_x$ and
 $r_y$ scale information of the unmodulated KH rolls (see later figure 6) is transferred partially to
 $R_{ww}(r_z)$, and therefore it can be appreciated by this local maximum of
 $\langle {\delta w\,\delta w} \rangle$ at
 $r_z \approx 0.5$. Later on, the spanwise-modulated tubes are further stretched into hairpin-like vortices, with a slightly shrunk spanwise scale
 $r_z \approx 1.8$, indicated by the local peaks of
 $\langle {\delta u\,\delta u} \rangle$,
 $\langle {\delta v\,\delta v} \rangle$ and
 $\langle {\delta u\,\delta v} \rangle$. Such hairpin-like structures are visible in the instantaneous picture of figure 3, and have been described by Cimarelli et al. (Reference Cimarelli, Leonforte and Angeli2018) via spatial correlation functions. These hairpin structures remain visible after
 $X = 2.5$, but they become progressively weaker and are hardly detectable for
 $X>3$.
Transition to turbulence occurs at  $X \approx 2$, after which small-scale turbulent structures coexist with the large ones created by the instability of the LE shear layer. Figure 3 confirms the observation, put forward by Cimarelli et al. (Reference Cimarelli, Leonforte and Angeli2018) and Chiarini & Quadrio (Reference Chiarini and Quadrio2021), that the dominant structures here are streamwise-aligned vortical structures. Their spanwise length scale is
 $r_z \approx 0.5$, as deduced from the maxima of the structure functions
 $\langle {\delta u\,\delta u} \rangle$,
 $\langle {\delta v\,\delta v} \rangle$ and
 $\langle {\delta u\,\delta v} \rangle$ at
 $Y \approx 0.9$ in figure 4. The local peak of
 $\langle {\delta u\,\delta u} \rangle$ derives from the interaction of the vertical motions induced by these vortices with the local positive
 $\partial U/\partial y>0$, that produce regions of positive and negative
 $u$-fluctuations at the lateral sides of the structures, yielding
 $R_{uu}<0$. As expected for streamwise-aligned structures,
 $\langle {\delta w\,\delta w} \rangle$ does not show a localised peak at this scale (Gatti et al. Reference Gatti, Chiarini, Cimarelli and Quadrio2020). The magnitudes of
 $\langle {\delta u\,\delta u} \rangle$ and
 $\langle {\delta v\,\delta v} \rangle$ show that these vortices are organised mainly in streamwise fluctuations. In terms of streamwise evolution, the intensity of the streamwise vortices is maximum at
 $X \approx 2.5$ and then decreases after the reattachment point, where viscous dissipation becomes stronger (see figure 15 in Chiarini & Quadrio Reference Chiarini and Quadrio2021).
In other regions of the flow, i.e. in the reverse boundary layer close to the wall and downstream of the reattachment, the small-scale fluctuations are organised preferentially in small-scale  $w$-structures. Indeed,
 $\langle {\delta w\,\delta w} \rangle$ is the largest diagonal component for
 $Y \rightarrow 0.5$ and
 $2 < X < 5$. The characteristic scale of these
 $w$-structures is
 $r_z \approx 0.5$, as seen by the local maximum at
 $Y \approx 0.55$ in figure 5 with a zoom of the streamwise location
 $X=3.5$. This peculiar small-scale organisation of near-wall turbulence will be described further in § 3.3, where it will be linked to flow splatting.
Two-dimensional view of the structure functions terms, in the plane  $X=3.5$. Panels as in figure 4.

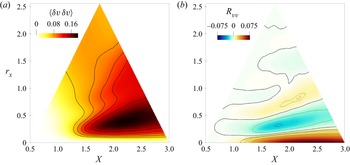
Figures 6 and 7 consider non-zero separations in the inhomogeneous directions, and identify the characteristic streamwise and vertical scales of the KH rolls close to the LE. Figure 6 deals with  $r_x$ and plots
 $\langle {\delta v\,\delta v} \rangle$ and
 $R_{vv}$ in the
 $(X,r_x)$ space with
 $r_y=r_z=0$,
 $Y=0.99$ and
 $0.5 \le X \le 3$. The characteristic streamwise scale of these rolls is identified by the peak of
 $\langle {\delta v\, \delta v} \rangle$: for
 $X>1.3$, it occurs at
 $r_x \approx 0.3\unicode{x2013}0.5$, and increases mildly with
 $X$. The
 $v$-fluctuations induced by the KH rolls are also observed via the large
 $R_{vv}<0$ for the same range of
 $r_x$. For
 $r_x>0.5$, the correlation function
 $R_{vv}$ presents alternating positive/negative regions. Similarly to what was observed by Thiesset, Danaila & Antonia (Reference Thiesset, Danaila and Antonia2014) and Alves Portela, Papadakis & Vassilicos (Reference Alves Portela, Papadakis and Vassilicos2017) for the von Kármán vortices in the circular and square cylinder wakes, this is the statistical trace of the quasi-periodic generation of the KH rolls. The streamwise separation for these peaks is linked to the KH frequency (
 $\approx 1.2\unicode{x2013}1.4$; see Chiarini & Quadrio Reference Chiarini and Quadrio2021) by the mean convection velocity
 $U_c$ of the rolls. Since the first positive peak of
 $R_{vv}$ has
 $r_x \approx 0.5\unicode{x2013}0.7$, it follows that
 $U_c \approx 0.7\unicode{x2013}0.8$.
Plots of (a)  $\langle {\delta v\,\delta v} \rangle$ and (b)
 $R_{vv}$ in the
 $(X,r_x)$ space with
 $r_y=r_z=0$,
 $Y=0.99$ and
 $0.5 \le X \le 3$.

 $\langle {\delta u\,\delta u} \rangle$ in the
 $(Y,r_y)$ space with
 $r_x=r_z=0$,
 $X=1.5$ and
 $0.5 \le Y \le 1.55$.

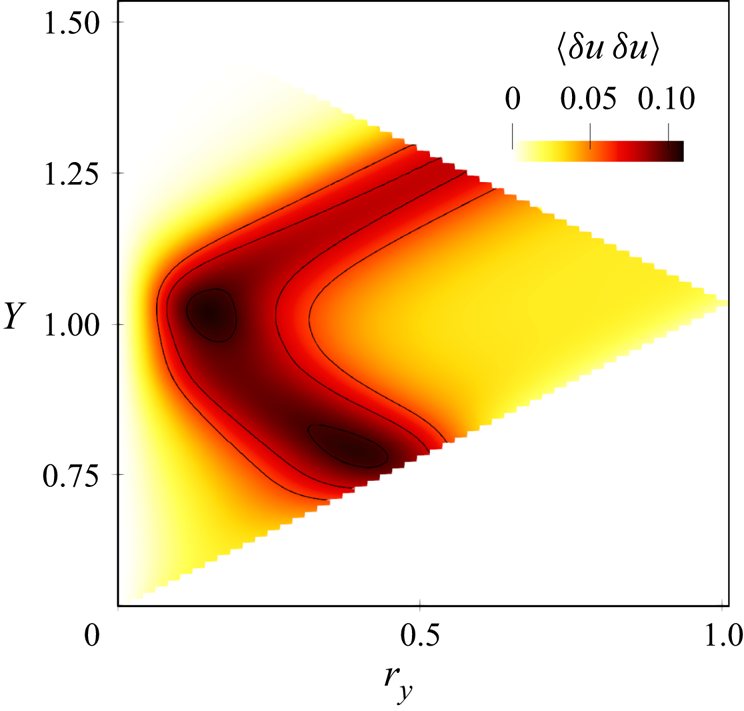
The wall-normal separation  $r_y$ is considered in figure 7, which plots
 $\langle {\delta u\,\delta u} \rangle$ in the
 $(Y,r_y)$ space for
 $r_x=r_z=0$,
 $X=1.5$ and
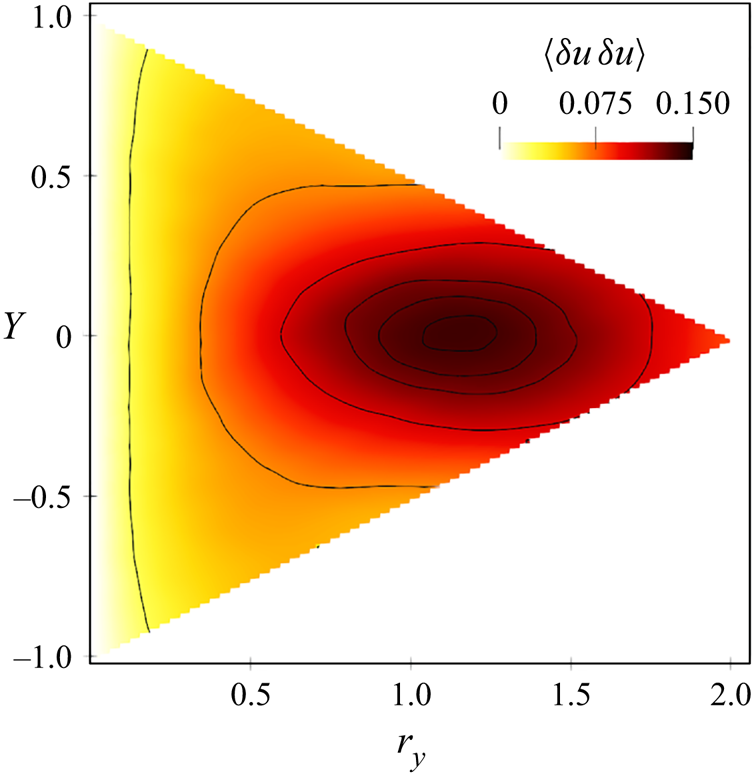
 $0.5 \le Y \le 1.55$. At
 $Y \approx 1$ (where the KH rolls are centred)
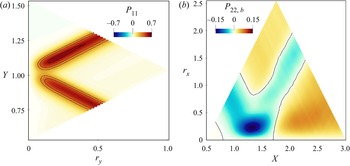
 $\langle {\delta u\,\delta u} \rangle$ peaks at
 $r_y \approx 0.15\unicode{x2013}0.25$, which identifies their characteristic vertical length scale. The rolls induce
 $u$-fluctuations at their vertical sides that yield a negative correlation
 $R_{uu}<0$ at the same range of
 $r_y$. In the
 $r_x=r_z=0$ space, large values of
 $\langle {\delta u\,\delta u} \rangle$ fall also along two oblique branches, described by
 $Y=Y_0 \pm r_y/2$. These large values of
 $\langle {\delta u\,\delta u} \rangle$, however, are not due to
 $R_{uu}$, but derive from
 $V_{11}$ (see (2.1)). This is consistent with a layer of high-velocity fluctuations, i.e. the shear layer separating from the LE, surrounded below and above by two regions where the fluctuations are weaker. Indeed,
 $V_{11}$, and thus
 $\langle {\delta u\,\delta u} \rangle$, has large values as long as at least one of the two points
 $\boldsymbol {X} \pm \boldsymbol {r}/2$ is within the shear layer. Note that the width of these branches (
 $r_y \approx 0.2$) is a measure of the vertical width of the shear layer itself at the considered
 $X$. As shown in the following, this peculiar pattern is also observed for other quantities.
3.2. Production
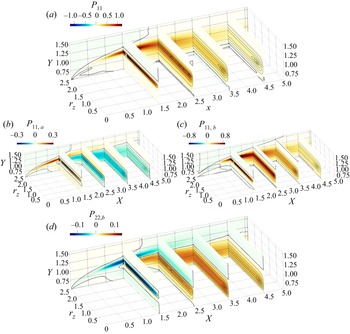
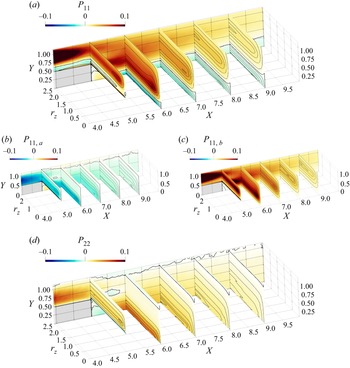
Production of the scale Reynolds stresses along the side of the cylinder in the  $r_x=r_y=0$ space is considered in figure 8. For the normal components,
 $P_{33}=0$ and the only non-zero production terms in this subspace reduce to
 \begin{equation} P_{11}= \underbrace{-2 \langle {\delta u\,\delta u} \rangle \,\frac{\partial U}{\partial x} }_{P_{11,a}} \underbrace{{}-2 \langle {\delta u\,\delta v} \rangle \,\frac{\partial U}{\partial y} }_{P_{11,b}}\end{equation}
and
 \begin{equation} P_{22}= \underbrace{-2 \langle {\delta u\,\delta v} \rangle \,\frac{\partial V}{\partial x} }_{P_{22,a}} \underbrace{{}-2 \langle {\delta v\,\delta v} \rangle \,\frac{\partial V}{\partial y} }_{P_{22,b}}.\end{equation}
(a) Plot of  $P_{11}$, with the two contributions
 $P_{11,a}$ and
 $P_{11,b}$ plotted separately in (b), (c). (d) Plot of
 $P_{22,b}$. The thick black line marks the zero contour level. White crosses are used to identify local maxima when not easily visible.

The map of  $P_{11}$ shows two independent production mechanisms of streamwise velocity fluctuations. The first and most intense is associated with the large-scale KH rolls and thus occurs along the LE free shear layer. It is visualised by the local maximum of
 $P_{11}$ at
 $(Y,r_z) \approx (1,2.4)$ for
 $0.75 \le X \le 2$, and by the maximum at
 $(Y,r_y) \approx (1.1,0.2)$ in figure 9(a), which plots
 $P_{11}$ in the same
 $r_x=r_z=0$ plane as considered in figure 7. The second and weaker peak is related to the small-scale streamwise-aligned vortices and takes place in the core of the primary vortex and downstream of the reattachment point; see the peak of
 $P_{11}$ at
 $(Y,r_z) \approx (1,0.5)$ for
 $2.5 \le X \le 5$. Interestingly, unlike in classic turbulent wall-bounded flows,
 $P_{11}$ is not positive at all positions and scales: in fact, it becomes negative below the first part of the shear layer and in the near-wall region of the aft cylinder side.
Production terms for  $\langle {\delta u\,\delta u} \rangle$ and
 $\langle {\delta v\,\delta v} \rangle$ associated with the KH rolls: (a)
 $P_{11}$ in the
 $(Y,r_y)$ space with
 $r_x=r_z=0$,
 $X=1.5$ and
 $0.5 \le Y \le 1.55$; (b)
 $P_{22}$ in the
 $(X,r_x)$ space with
 $r_y=r_z=0$,
 $Y=0.99$ and
 $0.5 \le X \le 3$.

The two contributions  $P_{11,a}$ and
 $P_{11,b}$, shown in figures 8(b,c), are considered separately to discern the production mechanism. The sign of
 $P_{11,a}$ is determined by
 $\partial U/ \partial x$, whereas its scale modulation is prescribed by
 $\langle {\delta u \delta u} \rangle$. In contrast, the sign of
 $P_{11,b}$ is not enforced by
 $\partial U / \partial y$ alone, since
 $\langle {\delta u\,\delta v} \rangle$ is not defined in sign. However, figure 4 has shown that
 $\langle {\delta u\,\delta v} \rangle$ is negative everywhere (except below the shear layer very close to the LE), so that positive
 $P_{11,b}$ generally corresponds to positive
 $\partial U / \partial y$.
Production along the shear layer is due partially to the large negative  $\partial U/ \partial x < 0$ across the layer itself, and is thus seen in the map of
 $P_{11,a}$, with a positive peak at
 $(X,Y,r_z) \approx (1.5,1,2.4)$. Also,
 $P_{11,a}$ is positive within the secondary vortex, indicating that
 $\partial U / \partial x<0$ contributes to sustaining streamwise fluctuations, albeit only weakly, also in this flow region. In contrast, within the primary vortex and after the reattachment point,
 $P_{11,a} <0$ for
 $0.5 \le Y \lessapprox 1$. Both large and small structures contribute to production: indeed, two negative peaks of
 $P_{11,a}$ are present, one at
 $r_z \approx 2$ (associated with the hairpin vortices for
 $X \le 2.5$), and the other at
 $r_z \approx 0.5$ (associated with the streamwise-aligned structures, for larger
 $X$).
While  $P_{11,a}$ dominates in the upstream portion of the LE shear layer,
 $P_{11,b}$ takes over for
 $X>1$, where it is positive almost everywhere. The positive production associated with the modulated KH rolls in the shear layer contains both
 $P_{11,a}$ and
 $P_{11,b}$, but the latter is larger since the mean shear
 $\partial U / \partial y >0$ dominates in this region. In contrast, the positive
 $P_{11}$ associated with the smaller structures in the aft cylinder side is due entirely to
 $\partial U / \partial y>0$, since at the corresponding positions and scales,
 $P_{11,b}$ is positive and larger than the negative
 $P_{11,a}$. Contribution
 $P_{11,b}$ is negative only in the separated shear layer at
 $X<1$ (Cimarelli et al. Reference Cimarelli, Leonforte, De Angelis, Crivellini and Angeli2019) and in the near-wall region at
 $X \le 2$, where the reverse boundary layer separates and creates the secondary vortex.
A further remark concerns the two regions with  $P_{11}<0$. The one beneath the shear layer is due to
 $P_{11,b}$ and has been addressed already by Cimarelli et al. (Reference Cimarelli, Leonforte, De Angelis, Crivellini and Angeli2019) and Chiarini & Quadrio (Reference Chiarini and Quadrio2021). The negative region close to the wall, instead, results from the positive
 $\partial U / \partial x$ across the reattachment and will be considered further in § 3.3, since near-wall turbulence here differs substantially from other canonical flows.
The second production term  $P_{22}$ is dominated by
 $P_{22,b}$, much larger than
 $P_{22,a}$, so that the production of vertical fluctuations is determined by
 $\partial V / \partial y$; this is consistent with the observations made by Moore et al. (Reference Moore, Letchford and Amitay2019) and Chiarini & Quadrio (Reference Chiarini and Quadrio2021) for the single-point Reynolds stress budget. Hence
 $P_{22,b}$ alone is shown in figure 8(d). Note that because of incompressibility,
 $P_{22,b}$ and
 $P_{11,a}$ must have opposite sign. The large-scale production mechanism associated with the KH instability is generally a sink for the large-scale vertical fluctuations; in fact, as shown in § 3.3, in the LE shear layer the large-scale vertical fluctuations are sustained mainly by the pressure–strain term. The large positive
 $\partial V / \partial y$ across the LE shear layer, indeed, leads to
 $P_{22,b}<0$ at all spanwise scales in the
 $r_x=r_y=0$ space, with a negative peak at
 $(X,Y,r_z) \approx (1.5,1,2)$, consistently with the scale and location of the modulated KH rolls. Similarly, a large negative peak of
 $P_{22,b}$ is detected at
 $(X,r_x)=(1.3,0.2)$ in figure 9(b), where the same
 $r_y=r_z=0$ plane as in figure 6 is considered. Note, however, that when considering
 $r_x \neq 0$,
 $P_{22,b}$ becomes slightly positive for
 $X \ge 1.7$, indicating a weak source of large-scale vertical fluctuations. Cimarelli et al. (Reference Cimarelli, Leonforte, De Angelis, Crivellini and Angeli2019) and Cimarelli, Franciolini & Crivellini (Reference Cimarelli, Franciolini and Crivellini2020) observed that the negative
 $P_{22,b}$ along the LE shear layer is a peculiarity of flows around bodies with sharp corners, and conjectured that this explains, at least partially, the enhanced thickness of the primary vortex compared to flows past bodies with rounded corners; the same results are also observed in Chiarini & Quadrio (Reference Chiarini and Quadrio2022). Unlike in the LE shear layer, the small-scale production produces both streamwise and vertical fluctuations. Within the primary vortex and after the reattachment point, indeed,
 $P_{22,b}>0$ with a distinct peak at the small scale
 $r_z \approx 0.5$ of the streamwise-aligned vortices.
In closing this subsection, we remark that the strongly inhomogeneous features observed for  $P_{11}$ and
 $P_{22}$ are challenging for turbulence theories and closures. Indeed, across the relatively small scale made by the length of the rectangular cylinder, we can recognise simultaneously regions where production is driven by flow accelerations/decelerations,
 $P_{11,a}$ and
 $P_{22,b}$, and regions where production is on the contrary driven by the more complex interaction of Reynolds shear stresses and mean velocity gradients,
 $P_{11,b}$. Of particular interest is their behaviour in the reverse flow within the primary vortex (see the near-wall region for
 $1 \le X \le 2.6$), where
 $P_{11,b}<0$ and
 $P_{22}<0$. This is driven by a weak vertical acceleration
 $\partial V / \partial y > 0$, leading to
 $P_{22}<0$, and by a negative correlation of the Reynolds shear stresses
 $- \langle {\delta u \delta v} \rangle$ with the mean streamwise shear
 $\partial U / \partial y$, thus leading to
 $P_{11,b}<0$. The latter cannot be described within the classic mixing length hypothesis (Cimarelli et al. Reference Cimarelli, Leonforte, De Angelis, Crivellini and Angeli2019), and represents an issue for two-equations eddy viscosity closures.
3.3. Redistribution
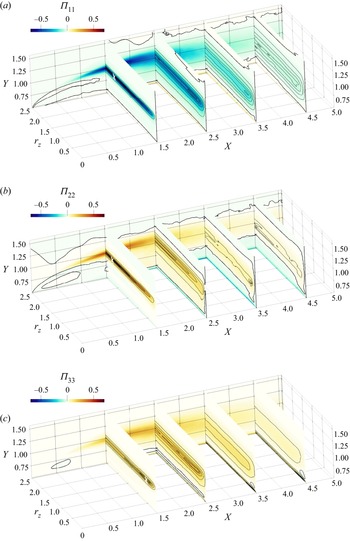
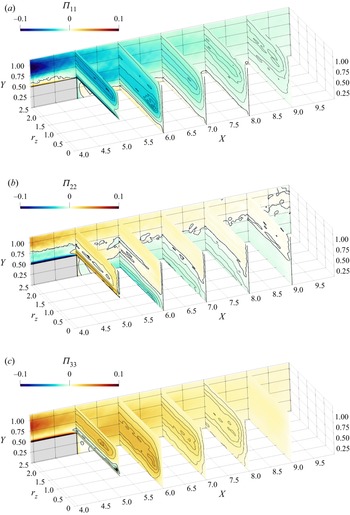
Figure 10 plots the three diagonal components of the pressure–strain tensor  $\varPi _{ij}$. The streamwise energy
 $\langle {\delta u\,\delta u} \rangle$ drained from the mean flow by the two production mechanisms discussed above is redistributed partially towards the cross-stream components
 $\langle {\delta v\,\delta v} \rangle$ and
 $\langle {\delta w\,\delta w} \rangle$ at all scales and positions, except for the near-wall region where
 $\varPi _{11}>0$,
 $\varPi _{33}>0$ and
 $\varPi _{22}<0$.
Plots of (a)  $\varPi _{11}$, (b)
 $\varPi _{22}$, (c)
 $\varPi _{33}$. The thick black line marks the zero contour level. White crosses are used to identify local maxima when not easily visible.

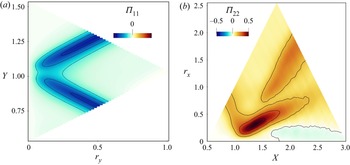
The KH instability is a net source for the large-scale vertical fluctuations despite the negative  $P_{22}$. Indeed, here the large-scale vertical fluctuations are sustained by redistribution rather than by direct production, as shown by the maps of
 $\varPi _{11}$ and
 $\varPi _{22}$ exhibiting their negative/positive peaks at
 $(X,Y,r_z) \approx (1.5,1,2.4)$. The same conclusion is arrived at when considering
 $r_y=r_z=0$ and
 $r_x=r_z=0$ around the LE shear layer, where (figure 11)
 $\varPi _{11}$ is negative and
 $\varPi _{22}$ has a large positive peak at
 $(X,r_x)=(1.3,0.2)$.
As figure 9, but for the pressure–strain terms.

The local peak of  $\varPi _{33}$ in the LE shear layer, instead, is found at smaller spanwise scales, i.e. at
 $(X,Y,r_z) \approx (1.5,1,0.5)$. This indicates that the modulation of the KH rolls is accompanied by a small-scale redistribution of streamwise fluctuations towards spanwise ones: indeed, here
 $\varPi _{11}<0$ and
 $\varPi _{22}>0$. Note that these scales and positions are consistent with the local peak of
 $\langle {\delta w\,\delta w} \rangle$ within the LE shear layer discussed above in figure 4. Along the LE shear layer, the sum
 $P_{ij} + \varPi _{ij}$ is locally positive for all three normal components, indicating that the KH instability is a net positive source of
 $u$-,
 $v$- and
 $w$-fluctuations.
Within the primary vortex and after the reattachment point, pressure–strain activity is concentrated at the small  $r_z$ scales associated with the streamwise-aligned vortices; see the local minimum of
 $\varPi _{11}$ and the local maxima of
 $\varPi _{22}$ and
 $\varPi _{33}$ at
 $r_z \approx 0.5$ for
 $X \ge 2.5$,
 $Y \approx 0.8$. This resembles the buffer layer of a turbulent channel flow (Gatti et al. Reference Gatti, Chiarini, Cimarelli and Quadrio2020), with streamwise fluctuations reoriented partially into cross-stream ones.
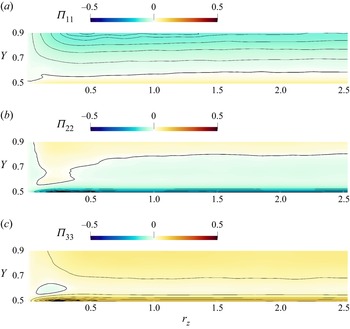
The near-wall region in the final part of the cylinder side is different, due to the flow impingement on the wall. A closeup of this region is provided in figure 12, where the plane  $X=4$ is considered. For
 $X>2.5$ and
 $Y \rightarrow 0.5$, large negative
 $\varPi _{22}$ together with positive
 $\varPi _{11}, \varPi _{33}$ are observed. This is the so-called splatting (Mansour, Kim & Moin Reference Mansour, Kim and Moin1988), where vertical velocity fluctuations turn into wall-parallel ones near a solid wall. Interestingly,
 $\varPi _{33} > \varPi _{11}$ indicates that vertical fluctuations are redistributed preferentially towards spanwise ones. The positive peak of
 $\varPi _{33}$ occurs at
 $r_z \approx 0.3$, which agrees with the local maximum of
 $\langle {\delta w\,\delta w} \rangle$ at
 $r_z \approx 0.5$, seen in figure 5. Together with the negative
 $P_{11}$, this explains why in the near-wall region the small-scale fluctuations are organised predominantly into
 $w$-structures. Moreover, we argue that these
 $w$-structures are then responsible for the generation of the streamwise vortices populating the flow at slightly larger
 $Y$. This is visualised by the local positive/negative peaks of
 $\varPi _{22}$ and
 $\varPi _{33}$ at
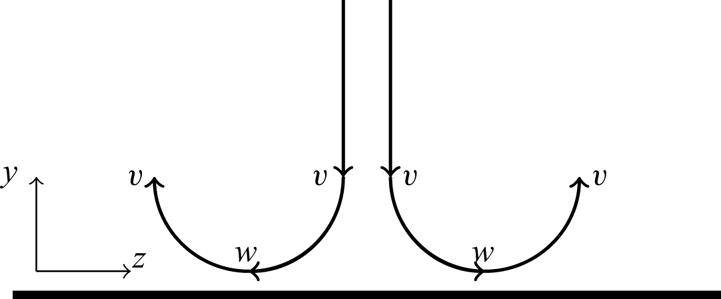
 $(Y,r_z) \approx (0.6,0.2)$. This type of impingement is sketched in figure 13: energy is transferred from
 $\langle {\delta v\,\delta v} \rangle$ mainly towards
 $\langle {\delta w\,\delta w} \rangle$ in the very near-wall region, generating small-scale
 $w$-structures. As shown quantitatively by the local peak of
 $\langle {\delta w\,\delta w} \rangle$ in figure 5 and sketched qualitatively in figure 13, these structures induce negative
 $R_{ww}<0$ for
 $r_z \approx 0.5$. Then, further from the wall, the spanwise fluctuations are reoriented into vertical ones, and energy is transferred back from
 $\langle {\delta w\,\delta w} \rangle$ to
 $\langle {\delta v\,\delta v} \rangle$ to feed the streamwise-aligned vortices.
Two-dimensional view of the pressure–strain terms, in the plane  $X=4$. Panels as in figure 10.

Sketch of the structures generated by the impingement flow on the cylinder surface in a  $(z,y)$ cross-stream plane.

In the reverse boundary layer upstream of the reattachment point at  $X=3.95$, these streamwise-aligned structures produce local peaks of
 $\langle {\delta u\,\delta u} \rangle$,
 $\langle {\delta v\, \delta v} \rangle$ and
 $\langle {\delta u\,\delta v} \rangle$ for
 $r_z \approx 0.4$, as seen for example in figure 5 at
 $X=3.5$. While travelling upstream, these structures lose their coherence and disappear eventually when the reverse boundary layer detaches for
 $X<2$ (Cimarelli et al. Reference Cimarelli, Leonforte and Angeli2018). Consistently, the impinging structures described above vanish here: for
 $X < 2.5$, the local peak of
 $\langle {\delta w\,\delta w} \rangle$ at
 $Y \rightarrow 0.5$ (see figure 5), and the negative
 $\varPi _{33}$ at slightly larger
 $Y$, disappear. Overall, the spatial organisation of the flow close to the wall differs from the classical near-wall turbulence, as also witnessed by the negative
 $P_{11}$. Since the impingement generates pairs of streamwise-aligned vortices but only at a certain distance from the wall, neither elongated streamwise vortices nor low-speed streaks are observed in the very near-wall region that, instead, is populated by
 $w$-structures.
3.4. Scale-space energy transfers
The description of the structural properties of the flow provided by the AGKE via the separate analysis of each component of  $\langle {\delta u_i\,\delta u_j} \rangle$ can be connected with the associated energy transfers by studying the fluxes of scale energy
 $\langle {\delta q^2} \rangle = \langle {\delta u_i\,\delta u_i} \rangle$ (Marati et al. Reference Marati, Casciola and Piva2004; Cimarelli, De Angelis & Casciola Reference Cimarelli, De Angelis and Casciola2013; Cimarelli et al. Reference Cimarelli, De Angelis, Jimenez and Casciola2016, Reference Cimarelli, Mollicone, van Reeuwijk and De Angelis2021). (Note that in this subsection, the subscript
 ${ii}$ implying summation will be omitted for conciseness.)
A complete scale-space characterisation of the energy fluxes requires the analysis of the complete flux vector  $\boldsymbol {\varPhi }=(\boldsymbol {\phi },\boldsymbol {\psi }$) in the five-dimensional space
 $(r_x,r_y,r_z,X,Y)$. However, since the statistical trace of the main turbulent structures is clearly visible for
 $r_z \neq 0$, here we consider only the
 $r_y=r_x=0$ subspace, where the flux vector reduces to
 $(\phi _z,\psi _X,\psi _Y)$: the terms
 $\partial \phi _x / \partial r_x$ and
 $\partial \phi _y / \partial r_y$ are moved to the the left-hand side of (2.4) and contribute to the source term of the GKE. The BARC flow is convection-dominated, so that the energy transport in the physical space due to the mean flow, i.e. the convective transfer, overwhelms the other contributions. As a consequence, in the
 $r_x=r_y=0$ space, the fluxes show a minimal scale dependency and resemble closely those observed in the single-point budget equation for the turbulent kinetic energy (Chiarini & Quadrio Reference Chiarini and Quadrio2022). To highlight the inter-scale transfer involving turbulent structures, it is useful to remove the relatively trivial effect of the mean convection. Therefore, in (2.4), also the divergence of the mean convective flux is moved from the flux vector to the source term, and a reduced flux vector and a corresponding extended source term (both indicated with
 $\hat{\cdot}$) are defined. The components of the reduced flux vector
 $\hat {\boldsymbol {\varPhi }}=(\hat {\phi }_z,\hat {\boldsymbol {\psi }})$ are
 \begin{equation} \hat{\phi}_z = \hat{\phi}_z^{turb} + \hat{\phi}_z^{visc} \end{equation}
and
 \begin{equation} \hat{\boldsymbol{\psi}} = \hat{\boldsymbol{\psi}}^{turb} + \hat{\boldsymbol{\psi}}^{press} + \hat{\boldsymbol{\psi}}^{visc}. \end{equation}
The extended source  $\hat {\xi }$, instead, reads
 \begin{equation} \hat{\xi} = P - D - \frac{\partial \phi_x}{\partial r_x} - \frac{\partial \phi_y}{\partial r_y} - \frac{\partial \psi_x^{mean}}{\partial X} - \frac{\partial \psi_y^{mean}}{\partial Y}; \end{equation}
recall that  $\phi _z^{mean}=0$ as
 $\boldsymbol {U}=(U,V,0)$. Thus the budget equation for
 $\langle {\delta q^2} \rangle$ can be written as
 \begin{equation} \boldsymbol{\nabla} \boldsymbol{\cdot} \hat{\boldsymbol{\varPhi}}=\frac{\partial \hat{\phi}_z}{\partial r_z} + \frac{\partial \hat{\psi}_j}{\partial X_j} = \hat{\xi}. \end{equation}
The flux vector describes how  $\langle {\delta q^2} \rangle$ is transferred in space and across scales. The field lines of
 $\hat {\boldsymbol {\varPhi }}$ are used to determine the orientation of the fluxes. Its divergence
 $\boldsymbol {\nabla } \boldsymbol {\cdot } \hat {\boldsymbol {\varPhi }}$, instead, provides quantitative information about the energetic relevance of the fluxes. When
 $\boldsymbol {\nabla } \boldsymbol {\cdot } \hat {\boldsymbol {\varPhi }}>0$, i.e.
 $\hat {\xi }>0$, the fluxes are energised. When
 $\boldsymbol {\nabla } \boldsymbol {\cdot } \hat {\boldsymbol {\varPhi }}<0$, i.e.
 $\hat {\xi }<0$, the fluxes release energy to sustain locally
 $\langle {\delta q^2} \rangle$. Clearly, as we consider the
 $r_x=r_y=0$ subspace, the energy transfer across wall-normal and streamwise scales is not considered. Hence in the following, transfers are said to be direct or inverse only in relation to the spanwise scale.
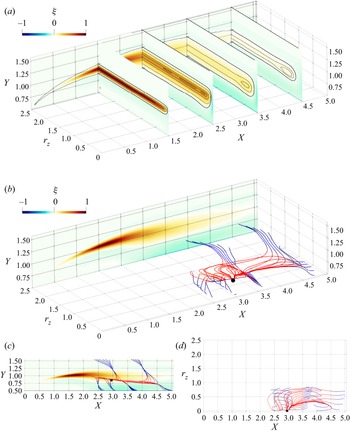
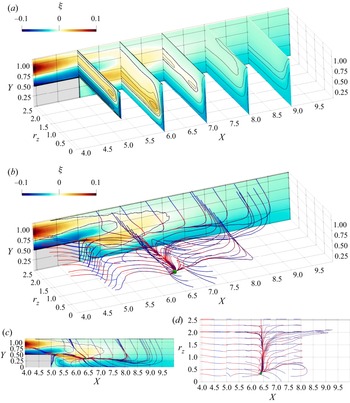
Figure 14 shows the source term  $\xi$ and the field lines of the three-dimensional reduced flux vector
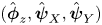 $(\hat {\boldsymbol {\phi }}_z,\hat {\boldsymbol {\psi }}_X,\hat {\boldsymbol {\psi }}_Y)$ coloured with its divergence. The source term
 $\xi$ identifies sink and source regions for
 $\langle {\delta q^2} \rangle$. A wide source area with positive
 $\xi$ starts from the LE, follows the separating shear layer embedding the core of the primary vortex, and extends downstream of the TE. Hereafter, this region is referred to as the source region. It presents localised peaks at scales and positions associated with both the KH rolls and the streamwise-aligned vortices. This means that both large- and small-scale production dominate local viscous dissipation, leading to a net production of large-scale fluctuations in the shear layer, and of small-scale ones in the aft part of the cylinder side. Along the shear layer,
 $\xi >0$ for
 $r_z \gtrapprox 0.1$; moving downstream, this spanwise scale increases, and at
 $X=4.5$,
 $\xi >0$ for
 $r_z \gtrapprox 0.25$. Two sink regions, instead, are placed below and above the source region and are referred to as side inner and outer sinks. However, here the negative
 $\xi$ does not identify a particular scale. As expected, at the smallest scales dissipation dominates everywhere, yielding
 $\xi <0$ for
 $r_z \rightarrow 0$ at all
 $(X,Y)$ positions.
Field lines of the reduced fluxes for  $\langle {\delta q^2} \rangle$ in the
 $r_x=r_y=0$ space. (a) Plot for the source term
 $\xi$. (b) The colour map on the
 $r_z=2.5$ plane is for
 $\xi$, and the lines are coloured with the divergence of the reduced flux vector
 $\boldsymbol {\nabla } \boldsymbol{\cdot } \hat {\boldsymbol {\varPhi }}$: red/blue indicate positive/negative
 $\boldsymbol {\nabla } \boldsymbol{\cdot } \hat {\boldsymbol {\varPhi }}$. (c) Side and (d) top views of the central one.

The flux lines originate from a singularity point, i.e. a point where the vector flux vanishes and its direction is consequently undefined, located at  $(X,Y,r_z) \approx (3,0.82,0)$; their positions and scales are consistent with the statistical footprint of the streamwise-aligned vortices (see figure 4). These fluxes remain confined in a small portion of the
 $(X,Y,r_z)$ space, meaning that the excess of
 $\langle {\delta q^2} \rangle$ produced by the small-scale mechanisms sustains only small-scale fluctuations placed in the aft portion of the cylinder side. Starting from the singularity point, all the lines first lay on the
 $Y \approx 0.82$ plane (as
 $\hat {\psi }_Y \approx 0$), where the fluxes gain intensity, and then deviate and release energy towards both larger and smaller scales.
Three different line families are detected, depending on where energy is released. Lines of the first family pass over the TE towards the wake. Lines of the second family are attracted by the cylinder side and release energy in the side inner sink region for  $2.5 \le X \le 5$; they approach the wall with a spiral pattern, thus showing direct and inverse transfers since the fluxes release energy at a certain scale after being energised by both smaller and larger scales (Cimarelli et al. Reference Cimarelli, De Angelis and Casciola2013, Reference Cimarelli, De Angelis, Jimenez and Casciola2016). Lines of the third family deviate towards larger
 $Y$, where they release energy to sustain the turbulent fluctuations in the range
 $0 \le r_z \le 1$ in the outer sink region. This ascending energy transfer is accompanied by an inverse energy transfer.
The above description of the scale-energy fluxes is far more complex than the Richardson phenomenological description of energy cascade. In particular, the simultaneous presence of forward and reverse transfers is a challenge for turbulence theories, and needs to be accounted for by closures. This is particularly important for large eddy simulation (LES), where a cross-over scale  $\ell _{cross}$ needs to be identified, separating smaller scales dominated by forward energy transfer, and larger scales dominated by reverse transfer. Indeed, when the length scale
 $\varDelta$ describing the local grid size (or the filter size) is such that
 $\varDelta < \ell _{cross}$, subgrid motions are dissipative and can be modelled by means of classic eddy viscosity assumptions. On the other hand, when
 $\varDelta > \ell _{cross}$, energy should emerge from the subgrid space, and more sophisticated mixed modelling approaches should be considered (Cimarelli & De Angelis Reference Cimarelli and De Angelis2012, Reference Cimarelli and De Angelis2014). A suitable candidate for estimating
 $\ell _{cross}$ is the smallest scale where the source term
 $\xi$ is zero. For the spanwise scales considered here,
 $\ell _{cross,z}$ is such that
 $\xi <0$ in the
 $r_x=r_y=0$ subspace for all
 $(X,Y)$ positions and
 $r_z < \ell _{cross,z}$. The scale
 $\ell _{cross,z}$ corresponds closely to the divergence point of the fluxes when projected in the
 $(Y,r_z)$ plane. Inspecting our data (see figure 14a) gives
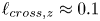 $\ell _{cross,z} \approx 0.1$, which provides a guideline for the selection of the more suitable LES approach as a function of the employed grid. The proposed
 $\ell _{cross,z}$ resembles (but is not equal to) the shear length scale
 $L_s$ explored by Casciola et al. (Reference Casciola, Gualtieri, Benzi and Piva2003). They applied the GKE (there called the Kármán–Howarth equation) to a homogeneous shear flow and, after integrating the equation on a sphere of radius
 $r$, defined
 $L_s$ as the scale
 $r$ at which the integral of the production term equals the integral of the transport term.
4. The near wake
The near wake is the wake in the vicinity of the TE, before its development into a classic, self-similar turbulent wake (Bevilaqua & Lykoudis Reference Bevilaqua and Lykoudis1978). It is known (Cimarelli et al. Reference Cimarelli, Leonforte and Angeli2018; Chiarini & Quadrio Reference Chiarini and Quadrio2021) that the BARC wake becomes self-similar for  $X \ge 10$, hence the present analysis is limited to
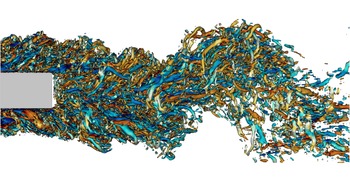
 $X<10$. The main feature of the near wake, illustrated in figure 15, is the coexistence of the large-scale von Kármán-like vortices shed from the TE with the small-scale turbulent structures advected from the boundary layer formed over the cylinder side.
Instantaneous snapshot of the BARC flow: lateral view of the isosurfaces at  $\lambda _2 = -5$, with zoom into the near-wake region. Colour depicts streamwise vorticity
 $\omega _x$, with the blue-to-red colour map ranging in
 $-10 \le \omega _x \le 10$. The vertical size
 $D$ of the cylinder can be used as reference to identify the vertical and streamwise length scales of the near wake.

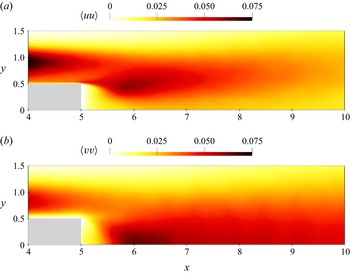
The shed vortices produce past the TE a peak in the maps of  $\langle {uu} \rangle$ at
 $Y=0.5$ and
 $\langle {vv} \rangle$ at
 $Y=0$, as shown in figure 16. The vertical position of the peaks suggests large spanwise vortices inducing the strongest
 $u$- and
 $v$-fluctuations at their vertical and lateral sides. The streamwise distance between the TE and the
 $\langle {vv} \rangle$ peak is often used to define the vortex formation length. In the present case, we measure a value of
 $1.1 D$ that is close to what was measured in the wake of a square cylinder by Trias, Gorobets & Oliva (Reference Trias, Gorobets and Oliva2015) at
 $Re=22{,}000$ and Alves Portela et al. (Reference Alves Portela, Papadakis and Vassilicos2017) at
 $Re=3900$. It should be noted, however, that the von Kármán-like vortices for the square cylinder originate from the roll-up of the LE shear layer, since the flow does not reattach over the cylinder side.
Maps of the (a)  $\langle {uu} \rangle$ and (b)
 $\langle {vv} \rangle$ components of the Reynolds stresses in the
 $(x,y)$ plane, with focus on the near wake.

4.1. Structures advected from the boundary layer
Figure 17 plots the three diagonal components of the structure function tensor and the off-diagonal component  $\langle {\delta u\,\delta v} \rangle$ in the
 $r_x=r_y=0$ space for
 $4 \le X \le 10$. Structures of the turbulent boundary layer over the aft cylinder side leave a statistical footprint in the near wake, at least up to a distance of
 $4 D$ downstream of the TE, i.e. for
 $X \le 9$.
Components of the structure function tensor plotted in the space  $(X,Y,r_z)$ in the near wake.

The energy associated with these structures, located slightly above the cylinder side ( $Y \geq 0.5$), decreases gradually along the TE shear layer to disappear eventually at large
 $X$, where it is annihilated by viscous dissipation and by the reorientation and isotropisation of the pressure–strain; see § 4.1.2. This is visible particularly in the local peaks of
 $\langle {\delta u\,\delta u} \rangle$ and
 $\langle {\delta u\,\delta v} \rangle$ at
 $r_z \approx 0.5$ and
 $r_z \approx 2$. The advected structures follow the TE shear layer; in fact, the
 $Y$ position of these maxima decreases from
 $Y \approx 0.75$ at
 $X \le 5$ to
 $Y \approx 0.5$ for larger
 $X$. Moreover, the characteristic
 $r_z$ scale of the streamwise-aligned vortices increases from
 $r_z \approx 0.5$ to
 $r_z \approx 1$ as they are advected downstream, due to the combined effect of viscous and pressure diffusion and of the scale-space turbulent fluxes. Unlike for the other components, the small-scale peak of
 $\langle {\delta v\,\delta v} \rangle$ associated with the streamwise-aligned vortices disappears quickly after the TE: already at
 $X > 6$,
 $\langle {\delta v\,\delta v} \rangle$ peaks in the core of the wake at no particular spanwise scale. As also shown by the map of
 $\langle {vv} \rangle$ in figure 16, at these positions, the large-scale vertical fluctuations produced by the spanwise-uniform von Kármán vortices dominate. Note that, as shown later, the scale information pertaining to these large vortices can be retrieved at
 $r_x \ne 0$ and/or
 $r_y \ne 0$. Finally, in the near wake
 $\langle {\delta w\,\delta w} \rangle$ is distributed over
 $0 \le Y \le 1.4$, without an evident peak at a certain scale, indicating that as soon as the wall is removed, the
 $w$-structures resulting from flow impingement disappear abruptly. It will be shown in § 4.1.2 that they are indeed destroyed by the action of the pressure–strain.
4.1.1. Production
The small-scale production associated with the streamwise-aligned vortices persists in the wake and is the main source of  $u$-fluctuations up to
 $2 D$ downstream of the TE. However, it does not outweigh the combined effects of dissipation and redistribution, so that the streamwise-aligned structures disappear further downstream. Here the streamwise velocity fluctuations become sustained mainly by the von Kármán vortices; see § 4.2. Figure 18, indeed, shows a local peak of
 $P_{11}$ at the small
 $r_z \approx 0.5\unicode{x2013}1$ for
 $X \le 7$, whereas it is at the largest
 $r_z$ for
 $X>7$. Similarly to what occurs over the cylinder side,
 $P_{11}$ is negative close to the wake centre, i.e. for
 $X>5.5$ and
 $Y \le 0.25$. However, unlike the scale-independent
 $P_{11}<0$ region close to the wall in the aft cylinder side (see § 3.2), here
 $P_{11}$ has a local minimum at the characteristic
 $r_z$ scale of the streamwise-aligned vortices. The largest positive values of
 $P_{11}$ are in the TE shear layer, as the mean velocity gradient across it is very intense.
As in figure 8, but for  $4 \le X \le 10$ and
 $0 \le Y \le 1.1$.

As in § 3.2,  $P_{11}$ is decomposed into the two terms
 $P_{11,a}$ and
 $P_{11,b}$, whose sign is determined by
 $\partial U / \partial x$ and
 $\partial U / \partial y>0$, since
 $\langle {\delta u\,\delta v} \rangle <0$ almost everywhere (see figure 17d). Term
 $P_{11,a}$ is negative everywhere, except within the wake vortex behind the TE. The largest negative values are observed within the TE shear layer, where
 $\partial U / \partial x >0$ is maximum. The scale dependency of
 $P_{11,a}$ derives from
 $\langle {\delta u\, \delta u} \rangle$ and shows a minimum at the
 $r_z$ scales of the streamwise-aligned vortices. Its vertical position evolves from
 $Y \approx 0.75$ immediately after the TE towards
 $Y=0$ at larger
 $X$, where
 $\partial U / \partial x >0$ is larger. Term
 $P_{11,a}$ dominates within the wake vortex and in the wake centreline, but, in contrast,
 $P_{11,b}$ is the main contribution everywhere else. Term
 $P_{11,b}$ is positive at almost all scales and positions, except within the wake vortex due to the positive
 $\langle {\delta u\,\delta v} \rangle$ and
 $\partial U / \partial y$. The largest
 $P_{11,b}$ is found again along the TE shear layer, where the mean velocity gradients are intense. However, the downstream evolution of
 $P_{11,b}$ differs from that of
 $P_{11,a}$: it peaks at
 $Y \approx 0.5$ and is zero for
 $Y = 0$, where
 $\partial U / \partial y=0$. The spanwise scales associated with local maxima of
 $P_{11,b}$ still identify the streamwise-aligned vortices. Like over the cylinder side, indeed, production from the streamwise-aligned structures has
 $P_{11,a}<0$ and
 $P_{11,b}>0$. However, here
 $P_{11,b}$ prevails only for
 $Y>0.25$. The positive
 $P_{11}$ for
 $Y>0.25$ is thus associated with the positive
 $\partial U / \partial y>0$, while the negative
 $P_{11}$ close to the
 $Y=0$ plane is the result of the mean flow acceleration
 $\partial U / \partial x>0$.
As over the cylinder side, the production term  $P_{22}$ is almost exclusively determined by
 $P_{22,b}$. Term
 $P_{22}$ is positive everywhere except within the wake vortex and just above the TE shear layer. The large mean velocity gradients at the TE shear layer lead to intense
 $P_{22}$. Further downstream,
 $P_{22}$ peaks at
 $Y = 0$, where
 $\langle {\delta v\,\delta v} \rangle$ and
 $\partial V / \partial y$ are both large. For
 $X \approx 5$, the scale information of
 $P_{22}$, inherited from
 $\langle {\delta v\,\delta v} \rangle$, indicates that the vertical fluctuations are sustained mainly by the streamwise-aligned structures. For larger
 $X$, instead, the scale dependency of
 $P_{22}$ is lost as the contribution of the von Kármán vortices becomes dominant: already in the near-wake region the vertical fluctuations, unlike the streamwise ones, are fed mainly by the von Kármán-like vortices.
As a final remark, we observe that  $P_{11}$ is larger than
 $P_{22}$. As for the cylinder side, this is consistent with the small-scale production sustaining mainly the streamwise velocity fluctuations. As shown later, in § 4.2, the opposite occurs for the large-scale production associated with the von Kármán-like vortices.
4.1.2. Redistribution
As soon as the wall vanishes and the no-penetration condition is relieved, redistribution near the wall ( $Y \rightarrow 0.5$) changes abruptly from what was described in § 3.3 for the flow over the cylinder side. Figure 19 shows that pressure–strain takes over its return-to-isotropy role and reorganises the structure of turbulence by partially redirecting the
 $u$- and
 $w$-fluctuations towards the vertical ones. In other words,
 $\varPi _{22}$ becomes positive for
 $Y \approx 0.55$, while
 $\varPi _{11}$ and
 $\varPi _{33}$ become negative. The pressure–strain transforms the
 $w$-structures, generated previously over the solid wall by impingement, into vertical fluctuations as soon as the wall disappears. In fact, while
 $\varPi _{11}$ does not show a preferential spanwise scale,
 $\varPi _{22}$ and
 $\varPi _{33}$ show their positive and negative local peaks at the small spanwise scale
 $r_z \approx 0.25$ that identifies the
 $w$-structures.
As figure 10, but for  $4 \le X \le 10$ and
 $0 \le Y \le 1.1$.

Further downstream from the TE, when the organisation of the turbulent fluctuation has changed, the pressure–strain terms near the  $Y=0$ plane indicate that a fraction of the vertical energy drained from the mean flow is redistributed towards
 $\langle {\delta w\,\delta w} \rangle$ and
 $\langle {\delta u\,\delta u} \rangle$ to partially balance the negative production
 $P_{11}$. This is similar to the splatting observed at the side wall and, arguably, is dictated by the antisymmetric behaviour of
 $V$ with respect to the
 $Y=0$ plane. At a larger distance from the centreline, both streamwise and vertical components are fed by the mean flow, but redistribution changes with
 $Y$. At intermediate
 $Y$, say
 $0.1 < Y < 0.5$, the pressure–strain partially redistributes
 $\langle {\delta u\,\delta u} \rangle$ and
 $\langle {\delta v\,\delta v} \rangle$ towards
 $\langle {\delta w\,\delta w} \rangle$. At larger
 $Y$, instead, the canonical scenario where
 $\langle {\delta u\,\delta u} \rangle$ is redistributed towards both
 $\langle {\delta v\, \delta v} \rangle$ and
 $\langle {\delta w\,\delta w} \rangle$ is observed.
4.2. The von Kármán vortices
The von Kármán-like spanwise vortices shed from the TE are at their early stage in the near wake, and coexist with the turbulent structures advected from the cylinder side. For their characterisation, non-zero streamwise and vertical separations are considered: the analysis is carried out first in the  $r_y=r_z=0$ space at
 $Y=0.38$ (i.e. where the turbulent kinetic energy has a peak downstream the TE, as shown by Chiarini & Quadrio Reference Chiarini and Quadrio2021), and then in the
 $r_x=r_z=0$ space at
 $X=6.5$.
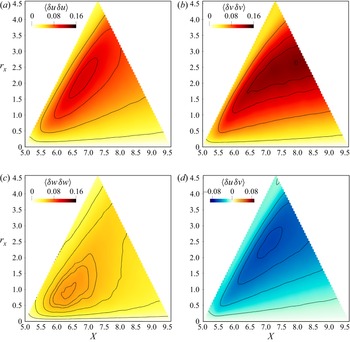
Figure 20 plots the normal components of the structure function tensor and  $\langle {\delta u\,\delta v} \rangle$ in the
 $r_y=r_z=0$ space, for
 $5 \le X \le 9.5$. The triangular shape of the figures is due to the AGKE terms being undefined (see § 2) for
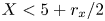 $X < 5 + r_x/2$ and for
 $X > 9.5 -r_x/2$, because of the finite size of the box where they are evaluated. Statistical trace of the spanwise rolls is found in the maps of
 $\langle {\delta u\,\delta u} \rangle$,
 $\langle {\delta v\,\delta v} \rangle$ and
 $\langle {\delta u\,\delta v} \rangle$. These structures induce a velocity field such that
 $R_{uu}<0$,
 $R_{vv}<0$ and
 $R_{uv}>0$ for non-zero streamwise separations, leading to peaks of the structure functions whose
 $r_x$-positions identify their characteristic streamwise length scale. The positions of these peaks are
 $(X,r_x)=(6.8,2.1)$ for
 $\langle {\delta u\,\delta u} \rangle$,
 $(X,r_x)=(8.2,2.7)$ for
 $\langle {\delta v\,\delta v} \rangle$, and
 $(X,r_x)=(7.19,2.5)$ for
 $\langle {\delta u\,\delta v} \rangle$. The streamwise scale
 $r_x = 2.5$, comparable to the cylinder cross-stream size, agrees with the visualisation of figure 15. The streamwise size of the vortices increases downstream, arguably due to the turbulent entrainment, and the local peaks of the structure functions shift towards larger
 $r_x$. In contrast to the streamwise-aligned vortices, organised mainly in streamwise fluctuations (see figure 17), the large-scale von Kármán vortices are organised mainly in vertical fluctuations: in this space
 $\langle {\delta v\,\delta v} \rangle$ is larger than the other normal components of
 $\langle {\delta u_i\,\delta u_j} \rangle$. This is a typical feature of the von Kármán-like vortices and has been observed also in the wake of other bluff bodies; see for example Thiesset et al. (Reference Thiesset, Danaila and Antonia2014) and Alves Portela et al. (Reference Alves Portela, Papadakis and Vassilicos2017) for the circular and square cylinders. We mention that information about the distance between two consecutive von Kármán vortices would be available once the box is long enough to contain the pair (Thiesset et al. Reference Thiesset, Danaila and Antonia2014).
Plots of  $(X,r_x)$ space with
 $r_y=r_z=0$,
 $Y=0.38$ and
 $5 \le X \le 9.5$.

Spanwise contribution  $\langle {\delta w\,\delta w} \rangle$ peaks close to the TE at small
 $r_x$, with the maximum at
 $(X,r_x) \approx (6.2,0.7)$. This peak cannot be related to the von Kármán-like spanwise vortices, because their characteristic scale is larger and, moreover, they do not induce spanwise velocity at their lateral sides. In fact, in the near wake,
 $\langle {\delta w\,\delta w} \rangle$ is unaffected by the shed vortices, as shown for example by Kiya & Matsumura (Reference Kiya and Matsumura1988) for the wake after a flat plate normal to the flow. An alternative explanation for the peak of
 $\langle {\delta w\,\delta w} \rangle$ rests on the observation that at these values of
 $X$ and
 $Y$, the maps of
 $\langle {\delta u\,\delta u} \rangle$ and
 $\langle {\delta u\,\delta v} \rangle$ (figure 17) identify streamwise-aligned structures coming from the cylinder wall, with characteristic size
 $0.5 \le r_z \le 1$. Therefore, we conjecture that the peak of
 $\langle {\delta w\,\delta w} \rangle$ is due to these structures that, once advected in the wake, tilt around the
 $z$-axis to produce regions with
 $R_{ww}<0$ at
 $r_x \neq 0$. As will be shown later, in § 4.2.2, the statistical trace of the tilting is indeed visible in the pressure–strain terms. The instantaneous snapshot in figure 15 confirms a similar tilting of the isosurfaces of
 $\lambda _2$, which in the near wake are inclined as they are embedded in the large-scale motion.
Figure 21 considers the  $(Y,r_y)$ space (where structure functions are not defined for
 $Y < -1 + r_y/2$ and
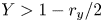 $Y > 1 - r_y/2$); here, the von Kármán-like vortices leave a significant statistical footprint only in the map of
 $\langle {\delta u\,\delta u} \rangle$. Indeed, since
 $\partial V/\partial x$ is negligible compared to the other components of the
 $\partial U_i / \partial x_j$ tensor, the
 $v$-fluctuations induced at their vertical sides are small, yielding only a negligible trace on the maps of of
 $\langle {\delta v\,\delta v} \rangle$ and
 $\langle {\delta u\,\delta v} \rangle$. The von Kármán-like vortices are placed symmetrically with respect to the
 $Y$-axis, and their vertical scale is comparable with the cross-stream size of the cylinder; the peak is found at
 $(Y,r_y) \approx (0,1.2)$, consistently with the instantaneous visualisation of figure 15.
Streamwise contribution  $\langle {\delta u\,\delta u} \rangle$ in the
 $(Y,r_y)$ space with
 $r_x=r_z=0$,
 $X=6.5$ and
 $-1 \le Y \le 1$.

4.2.1. Production
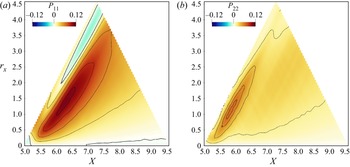
Production in the  $(X,r_x)$ space points to a second mechanism, related to the von Kármán-like vortices, acting in the near-wake region to sustain large-scale vertical and streamwise fluctuations. In figure 22,
 $P_{11}$ is shown to be positive almost everywhere, except at the smallest scales
 $r_x \rightarrow 0$ and over the
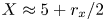 $X \approx 5 + r_x/2$ line. Its maximum is at
 $(X,r_x) \approx (6.3,1.55)$, consistently with the statistical footprint of the von Kármán-like vortices. Term
 $P_{22}$, instead, is positive everywhere, with the largest values for
 $r_x>1$, and peaks at
 $(X,r_x) \approx (5.75,1.3)$, almost the same position as
 $P_{11}$. Overall, this large-scale production mechanism drains energy from the mean flow to feed both
 $u$- and
 $v$-fluctuations at the large scales, with a preference for the former (since
 $P_{11}>P_{22}$). This differs from the large-scale production observed along the sides of the cylinder and related to the spanwise rolls generated by the KH instability, which is a source of streamwise fluctuations but a sink of vertical ones. Similarly to what was observed in the
 $(X,Y,r_z$) space,
 $P_{11}$ is dominated by
 $P_{11,b}$, and
 $P_{22}$ by
 $P_{22,b}$ (not shown). Therefore, as for the small-scale motions, production is driven by the wall-normal derivatives of the mean flow.
Production terms in the  $(X,r_x)$ space with
 $r_y=r_z=0$ and
 $Y=0.38$.

4.2.2. Redistribution
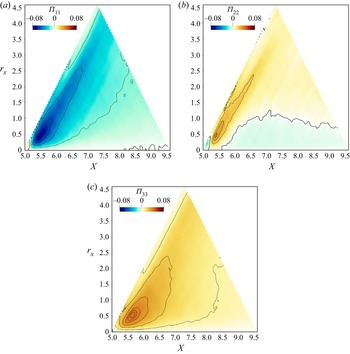
The pressure–strain redistributes the  $u$-fluctuations (
 $\varPi _{11}<0$) towards the other components (
 $\varPi _{22}>0$ and
 $\varPi _{33}>0$) at the largest streamwise scales associated with the von Kármán-like vortices, i.e.
 $r_x > 1$, as shown in figure 23. Therefore, in the near wake, the large-scale vertical fluctuations, unlike the streamwise ones, are fed by both production and redistribution; this explains the larger
 $\langle {\delta v\,\delta v} \rangle$ compared to the other components observed in figure 20 and discussed in § 4.2.
Pressure–strain terms in the  $(X,r_x)$ space with
 $r_y=r_z=0$ and
 $Y=0.38$.

For streamwise separations  $r_x<1$ associated with the small-scale structures, the character of the redistribution changes with the distance from the TE. Near the TE, the small-scale
 $u$-fluctuations are partially reoriented towards
 $v$- and
 $w$-fluctuations. For
 $X > 6$, in contrast, both
 $u$- and
 $v$-fluctuations turn into
 $w$-fluctuations:
 $\varPi _{11}<0$,
 $\varPi _{22}<0$ and
 $\varPi _{33}>0$. This agrees with the pressure–strain term in the
 $r_x=r_y=0$ space for the present value of
 $Y$, shown in figure 19. Note that the positive peak of
 $\varPi _{33}$ occurs at scales and positions compatible with the maximum of
 $\langle {\delta w\,\delta w} \rangle$ shown in figure 20, i.e.
 $(X,r_x) \approx (6,0.8)$, and that at the same scales and positions,
 $\varPi _{11}$ features its negative peak. Therefore, as discussed above, when the streamwise-aligned vortices are advected into the wake, their tilting around their
 $z$-axis is accompanied by the action of the pressure–strain, which partially turns their streamwise fluctuations into spanwise ones, producing regions of spanwise velocity responsible for negative
 $R_{ww}$ for
 $r_x \neq 0$.
4.3. Scale-space energy transfers
Figure 24 depicts the scale-space energy transfers in the near wake. The source term  $\xi$ shows that the positive source for
 $\langle {\delta q^2} \rangle$ extends from the cylinder side down to
 $X \approx 7$, with localised peaks at
 $0.5 \lessapprox r_z \lessapprox 1$ that are consistent with those observed in the map of
 $P_{11}$. The near wake has two further sinks, one within the wake vortex and the other along the wake centreline. As over the cylinder side, a particular scale is not identified in these sink regions. Again at the smallest scales the dissipation dominates, yielding
 $\xi <0$ for
 $r_z \rightarrow 0$ at all
 $(X,Y)$ positions. The field lines coming from the cylinder side, i.e. those referred to as first family in § 3.4, are attracted by the sink within the wake vortex, and show practically no scale dependency. There are no field lines linking the cylinder side with the downstream wake, as a consequence of considering the reduced flux vector only. Indeed, when the complete flux vector is used, several flux lines connect the two regions; see for instance the single-point fluxes of
 $k$ (Chiarini & Quadrio Reference Chiarini and Quadrio2022) and
 $\langle {u_i u_j} \rangle$ (Chiarini & Quadrio Reference Chiarini and Quadrio2021). The implication is that the cylinder side and the near wake interact dynamically only via the energy transfers associated with the mean energy transport.
As figure 14, but for the near-wake region  $4 \le X \le 10$ and
 $0 \le Y \le 1$.

Important field lines of the reduced flux vector in the near wake originate from a singularity point placed at  $(X,Y,r_z) \approx (6.4,0.35,0.4)$ and marked with a green dot in figure 24. They show how the excess of fluctuation energy
 $\langle {\delta q^2} \rangle$ produced by the small-scale production mechanism described in § 4.1.1 sustains velocity fluctuations in the sink regions of the near wake. All the lines are straight at first and keep the same
 $X$ and
 $Y$ (
 $\hat {\psi }_X \approx 0$ and
 $\hat {\psi }_Y \approx 0$) moving towards larger
 $r_z$ (
 $\hat {\phi }_z>0$). Their colour indicates that at this stage, the fluxes are locally energised. Then at a certain
 $r_z$, the lines suddenly bend, being attracted by the sink regions where they release energy to balance the negative
 $\xi$. Four different line types are identified. Lines of the first type bend upstream, descend and release energy in the wake vortex before vanishing at the TE. A second type is attracted towards the wake centreline, due to the effect of the viscous term. Note that these lines bend both upstream and downstream and do so over a range of
 $r_z$, thus releasing energy for a wide range of
 $X$ and at all spanwise scales. A third type bends upwards towards larger
 $Y$, releasing
 $\langle {\delta q^2} \rangle$ in the outer sink over a wide range of
 $r_z$ and
 $X$. This transfer is representative of the turbulent entrainment in the wake. All these line types feature an inverse energy transfer in the space of scales: fluxes are energised mainly at the smallest scales and release energy at the large ones. Finally, a fourth line type goes from the singularity point towards the
 $r_z=0$ plane, meaning that part of the excess of
 $\langle {\delta q^2} \rangle$ feeds the smallest dissipative scales, highlighting in this case a more classical direct energy transfer form larger to smaller scales.
Similarly to what happens over the cylinder side, it is thus found that in the near wake, the scale-energy fluxes are more complex than the classical energy cascade. The simultaneous presence of forward and reverse energy transfers challenges turbulence closures; the definition of a cross-over scale  $\ell _{cross}$ between these phenomena is a sound starting point to address the issue. As expected, our data show that the spanwise cross-over scale in the near wake is larger than over the cylinder side. In particular,
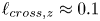 $\ell _{cross,z} \approx 0.1$ just after the TE, and
 $\ell _{cross,z} \approx 0.25$ at
 $X=6$ (see figure 24a), suggesting that the requirements for the spanwise grid resolution are less severe in the wake than over the cylinder side.
5. Conclusions
The present work has provided a statistical description of the large- and small-scale structures populating the flow along the side and in the near wake of a 5 : 1 rectangular cylinder, also known as BARC flow, at a Reynolds number  $Re = 3000$ based on the free stream velocity
 $U_\infty$ and cylinder thickness
 $D$. The study leverages the anisotropic generalised Kolmogorov equations, or AGKE, to provide a complete and quantitative description of the time-averaged dynamical processes behind the formation, transport and dissipation of each component of the Reynolds stress tensor, by considering simultaneously the space of scales and the physical space.
The goal is to provide for the first time an exhaustive scale-space characterisation of the BARC flow, by focusing on the region over the cylinder side and on the near wake just after the trailing edge, where the non-equilibrium boundary layer over the cylinder side develops gradually into a free-shear flow and interacts with the large-scale motions of the von Kármán street. We have described statistically the structures in the flow, identified precisely their characteristic length scales, and highlighted their role in the production and redistribution of the large- and small-scale velocity fluctuations. The main scale-space energy transfers, as well as implications for turbulence modelling, are discussed.
Over the cylinder side, the main structures in the flow are: (i) large spanwise rolls generated by the Kelvin–Helmholtz (KH) instability of the shear layer detaching from the leading edge, which are initially spanwise-invariant but later develop a spanwise modulation; (ii) hairpin-like vortices generated by the breakdown of the KH rolls; (iii) small streamwise-oriented vortical structures in the aft part of the cylinder side; (iv)  $w$-structures in the near-wall region created by flow impingement on the cylinder surface downstream of the reattachment. The characteristic spanwise scales of the structures are
 $r_z \approx 2.4 D$ for the spanwise-modulated KH rolls,
 $r_z \approx 1.8 D$ for the hairpin-like vortices, and
 $r_z \approx 0.5 D$ for the streamwise-aligned vortices and
 $w$-structures. Two independent sources of velocity fluctuations have been identified: one is associated with the large KH rolls, and the other with the small streamwise vortices. The large-scale source drains energy from the mean flow to sustain directly the streamwise fluctuations, with the large-scale cross-stream fluctuations being sustained indirectly mainly by pressure–strain redistribution. In contrast, the small-scale source sustains directly both streamwise and (to a lesser extent) vertical fluctuations. Pressure–strain, then, partially reorients the streamwise fluctuations into cross-stream ones, like in classical parallel wall-bounded turbulent flows. Close to the wall, the flow dynamics is dictated by redistribution. Due to flow impingement, very close to the wall, velocity fluctuations are organised into small-scale
 $w$-structures; at slightly larger wall distances, they reorient into vertical fluctuations to feed the streamwise-aligned vortices.
In the near wake, small structures advected from the cylinder side coexist and interact with large von Kármán-like vortices typically shed in the wake past bluff bodies. The small-scale velocity fluctuations modify their organisation as soon as they cross the trailing edge and the wall vanishes beneath them. Indeed, the near-wall  $w$-structures turn suddenly into vertical fluctuations, whereas the streamwise vortices weaken progressively until viscous dissipation and the isotropisation effect of the pressure–strain annihilate them at a downstream distance from the trailing edge of approximately
 $4D$. Two independent sources of velocity fluctuations are identified. A small-scale source is associated with the streamwise-aligned structures transported in the near wake, and is the main contributor to
 $u$-fluctuations up to a downstream distance of
 $2 D$. A large-scale source is associated with the large wake vortices. Unlike the KH instability, here both the large-scale streamwise and vertical fluctuations are fed directly by energy drained from the mean flow, while the pressure–strain partially redistributes streamwise energy towards the cross-stream components. As a result, in the near wake, the fluctuating field is organised mainly in
 $u$-fluctuations at the small scales and in
 $v$-fluctuations at the large scales.
The scale-space energy transfers are far more complex than the Richardson energy cascade, with the coexistence of forward and reverse energy transfers both over the cylinder side and in the near wake. This complexity has to be considered in turbulence modelling, especially when selecting the cross-over scale  $\ell _{cross}$ in large eddy simulations. As a suitable candidate for the spanwise cross-over scale, we propose the minimum spanwise scale where the source term becomes positive. Our data indicate that grid resolution requirements for the selection of the modelling approach are more strict over the cylinder side, where
 $\ell _{cross,z} \approx 0.1 D$, than in the near wake, where the spanwise cross-over scale increases up to
 $\ell _{cross,z} \approx 0.25 D$.
The present study can be extended to consider higher Reynolds numbers, and/or different aspect ratios of the cylinder. The experimental work of Moore et al. (Reference Moore, Letchford and Amitay2019), for example, determined that for smaller aspect ratios where the reattachment is intermittent or entirely absent, the main energetic scales change, owing to differences in the large-scale instabilities and in the development of the wake.
In the present formulation, the AGKE do not discriminate between the large-scale motions due to flow instabilities and the small-scale turbulent motions, detecting scales and positions where the former force the latter, and vice versa. Work is underway to overcome this issue, by exploiting the quasi-periodic nature of the large-scale motions associated with the flow instabilities. A triple decomposition of the velocity field (Hussain & Reynolds Reference Hussain and Reynolds1970) into mean, periodic and stochastic contributions may be used to extend the AGKE, similarly to what was done by Thiesset et al. (Reference Thiesset, Danaila and Antonia2014) and Alves Portela, Papadakis & Vassilicos (Reference Alves Portela, Papadakis and Vassilicos2020) for the GKE. This will lead to two different set of budget equations, one for the large-scale quasi-periodic motions, and one for the small-scale stochastic turbulent fluctuations; their analysis will provide further insight in the multiscale spatio-temporal dynamics of the flow.
Declaration of interests
The authors report no conflict of interest.