


Introduction
Depressive symptom profiles of people were long thought to be stable. Until well in the 1990s mainstream theories (e.g. diathesis–stress model) predicted that both between and within individuals, the pattern of symptoms displayed across multiple episodes is roughly the same. As such, it was thought that external factors, like stressful life events (SLEs), that were known to be associated with an increased risk for the onset of an episode of major depression (MD; e.g. Kendler et al. Reference Kendler, Karkowski and Prescott1999; Rijsdijk et al. Reference Rijsdijk, Sham, Sterne, Purcell, McGuffin, Farmer, Goldberg, Mann, Cherny, Webster, Ball, Eley and Plomin2001; Leskelä et al. Reference Leskelä, Melartin, Lestelä-Mielonen, Rytsälä, Sokero, Heikkinen and Isometsä2004; Olsen et al. Reference Olsen, Mortensen and Bech2004; Jacobs et al. Reference Jacobs, Kenis, Peeters, Derom, Vlietinck and van Os2006; Middeldorp et al. Reference Middeldorp, Cath, Beem, Willemsen and Boomsma2008; Munafò et al. Reference Munafò, Durrant, Lewis and Flint2009), were not capable of influencing the occurrence of individual symptoms. This assertion changed when research showed that depressive symptom profiles across multiple episodes of MD within the same individual were moderately stable at best (e.g. Coryell et al. Reference Coryell, Winokur, Shea, Maser, Endicott and Akiskal1994; Oquendo et al. Reference Oquendo, Barrera, Ellis, Li, Burke, Grunebaum, Endicott and Mann2004): could this partly be due to the direct influence of SLEs on individual symptoms? Yes, depressive symptoms were shown to vary as a function of the particular class of SLEs that preceded the onset of these symptoms (Keller & Nesse, Reference Keller and Nesse2005, Reference Keller and Nesse2006; Keller et al. Reference Keller, Neale and Kendler2007; Slavich et al. Reference Slavich, Thornton, Torres, Monroe and Gotlib2009): for example, romantic breakups were associated with high levels of depressed mood and feelings of guilt, while stress was associated with fatigue and hypersomnia (Keller et al. Reference Keller, Neale and Kendler2007). Thus, depressive symptom profiles are more pathoplastic than was once thought in that environmental precipitants like SLEs can give ‘content, coloring and contour’ to the individual expression of such profiles (Birnbaum, Reference Birnbaum1923). Instead of individual symptoms, the present study presents a novel approach in which the impact of SLEs on the overall pattern of correlations between these symptoms is investigated.
Why is studying the impact of SLEs on correlations between depressive symptoms important? An answer brings us back to the pioneering work of, for example, Kraepelin who tried to distinguish between psychiatric disorders based on the observation that some symptoms were more often seen together in patients than others (Kraepelin, Reference Kraepelin1923). For example, depressed mood and feelings of worthlessness were displayed in patients more frequently than depressed mood and disorganized thinking. Many similar observations later culminated in the definition of distinct psychiatric disorders, designating depressed mood and feelings of worthlessness as symptoms of MD and disorganized thinking and thought insertion as symptoms of schizophrenia. Put in statistical terms, the setup of the current classification system is based on the fact that some symptoms are more strongly correlated with each other (e.g. depressive symptoms with one another) than with other symptoms (e.g. depressive symptoms with symptoms of schizophrenia).
The critical question is why symptoms of psychiatric disorders are strongly inter-correlated. The leading hypothesis – one that is more often assumed than examined critically – postulates a common cause framework (Pearl, Reference Pearl2000; Bollen, Reference Bollen2002; Borsboom et al. Reference Borsboom, Mellenbergh and van Heerden2003; Reise & Waller, Reference Reise and Waller2009). Fig. 1 a displays how correlations between symptoms of a dysphoric episode (DE) would be understood from this perspective: the DE is the common cause of its symptoms. That is, depressive symptoms are correlated because they are caused by the same underlying (acute) liability to develop a DE. Importantly, this perspective claims that correlations between symptoms are not indicative of a real relationship between them: insomnia (or hypersomnia), for example, is not directly related to fatigue; both symptoms are only correlated because they are both caused by the same underlying depressive liability. Recently, a novel alternative has been articulated (Cramer et al. Reference Cramer, Waldorp, van der Maas and Borsboom2010) in which there is no common cause (see Fig. 1 b). Instead, correlations between symptoms (lines between symptoms in the figure) represent real relationships (possibly causal in nature) and, as such, the connected symptoms form a network. That is, this alternative model postulates that a DE (and its more severe counterpart, MD) is a network of symptoms that stand in direct (causal) relations toward one another. The most compelling argument for a network account of psychiatric disorders is commonsensical. It seems unrealistic to assume that insomnia and fatigue are only correlated because both are a result of an underlying liability to develop a DE. Surely, all of us have experienced that having trouble sleeping can directly lead to tiredness the next day.
A dysphoric episode (DE) according to a common cause (a) and a network (b) perspective. (a) The common cause DE causes the six symptoms (d1–d6) of a dysphoric episode. Stressful life events (SLE1 and SLE2) influence the symptoms of a dysphoric episode only indirectly, via the common cause DE. (b) A dysphoric episode is a network in which symptoms d1–d6 are directly connected with one another. SLE1 and SLE2 influence the symptoms of a dysphoric episode directly.

These two ways of conceptualizing psychiatric disorders assume a different relationship between a DE and SLEs. According to a common cause perspective (see Fig. 1 a), SLEs influence the symptoms only indirectly, via their impact on the common cause: if, after SLE1, d3 and d4 are more strongly correlated than after SLE2, this is because the acute liability to develop a DE (i.e. common cause) is increased after SLE1 compared with SLE2. According to a network perspective (see Fig. 1 b), SLEs can influence symptoms directly: if, after SLE1, d3 and d4 are more strongly correlated than after SLE2, this results from a real increase in the strength of the correlation between d3 and d4 after SLE1 compared with SLE2 due to the direct impact of both SLE1 and SLE2 on depressive symptoms. Hence, if SLEs make an impact on the pattern of correlations between depressive symptoms differently, the common cause perspective predicts that those differences are due to underlying differences in acute liability to develop a DE while the network perspective predicts a direct influence of SLEs on depressive symptoms and correlations between them. The present study investigates the prediction of the common cause perspective by a comparison of the impact of four SLEs on disaggregated depressive symptomsFootnote 1Footnote † in twins from a general population sample with a DE in the last year.
Method
Participants
The data for this study consisted of a subsample of 2096 participants (49.9% female) from the larger Virginia Adult Twin Study of Psychiatric and Substance Use Disorders (VATSPUD), a population-based longitudinal study of Caucasian twins from the Mid-Atlantic Twin Registry (for details, see Prescott et al. Reference Prescott, Aggen and Kendler2000; Kendler & Prescott, Reference Kendler and Prescott2006). The present study is based on members of female–female, male–male and male–female twin pairs who, at the first interview, reported (1) having experienced a DE (see Measures section) and (2) that their depressive symptoms were precipitated by one of four SLEs.
Measures
The first VATSPUD interview assessed the presence/absence of the 14 disaggregated symptoms of MD (representing the nine aggregated symptoms of criterion A for MD in DSM-III-R), lasting at least 5 days during the previous year. Whenever a symptom was present, interviewers probed to ensure that its occurrence was not due to medication or physical illness. Participants were then asked which symptoms co-occurred, and the interviewer aggregated these symptoms into syndromes. Following earlier work (Keller et al. Reference Keller, Neale and Kendler2007) we define a DE as any syndrome in which two or more of the nine aggregated depressive symptoms co-occurred.
For each DE, participants were asked whether something had happened to make them feel that way or the symptoms just came out of the blue: this methodology is to a substantial extent based on the Life Events and Difficulties measure (LEDS; Brown et al. Reference Brown, Bifulco and Harris1987) with the main difference that the LEDS concepts were adapted to be rated by the interviewer. If participants could think of a reason, they were asked to describe it. Timing of the event was recorded as described by the respondent and if unsure, the interviewer helped them with other key events in the last year. Interviewers subsequently encoded the responses to specific causal codes. If participants indicated multiple causes, they were asked to order them by causal importance. Following earlier work (Keller et al. Reference Keller, Neale and Kendler2007), the primary codes (i.e. codes that participants had indicated were of highest causal importance) were collapsed into nine SLE groups of which the four most prevalent were used in the analyses: (1) Stress: stress due to work, finances, legal problems, etc.; (2) RomLoss: ending of a romantic relationship, including divorce; (3) Health: one's own health problems; and (4) Conflict: interpersonal conflict between self and another. Inter-rater reliability for determining the occurrence and dating of the SLEs was found to be in the good to excellent range (see Kendler et al. Reference Kendler, Kessler, Walters, MacLean, Neale, Heath and Eaves1995).
Statistical analysis
We computed tetrachoric correlations between the symptoms for each SLE and presented the resulting networks graphically. We conducted three main analyses. Descriptive in nature, the first analysis investigated differences between the four SLE groups in the graphical representation of their symptom networks: for example, is the correlation between depressed mood and thoughts of death stronger in one SLE group compared with the other SLE groups? Also, we analyzed differences between SLE groups by computing each symptom's centrality in their respective networks (i.e. the sum of all tetrachoric correlations between that symptom and all others in a network; Boccaletti et al. Reference Boccaletti, Latora, Moreno, Chavez and Hwang2006): the higher the centrality of a symptom, the more strongly that symptom is connected with other symptoms in the network.
In the second analysis, we tested whether the observed patterns of correlations among the symptoms in the four SLE groups were significantly different from one another. To this end, we assessed whether constraining correlations to be equal across SLE groups (i.e. homogeneity) would result in a poorer relative fit compared with allowing the free estimation of correlations in each SLE group (i.e. heterogeneity). If so, heterogeneity would thus be preferred over homogeneity, and this implies that the differences in the correlation networks between SLE groups are significant.
In the third analysis, we sought to evaluate whether the differences in the correlation networks between the SLE groups could be due to underlying differences in acute liability to develop a DE. To this end, we compared two versions of the model as it is depicted in Fig. 1 a. The first model (model I) assumes that differences in the networks cannot be explained by underlying differences in acute liability to develop a DE (i.e. the impact of different SLEs on the DE circle in the figure is the same). Instead, differences in the networks are explained by differences in the strength of the associations between a DE and its symptoms (i.e. arrows between DE and d1–d6 in the figure). The second model (model II) assumes that differences in the networks can be explained by underlying differences in acute liability to develop a DE: SLEs influence the DE circle in the figure differently while the associations between a DE and its symptoms (i.e. arrows between DE and d1–d6 in the figure) are the same for individual SLEs. We compared the fit of both modelsFootnote 2: if model II does not fit worse than model I, this would be consistent with a common cause perspective on DEs.
We estimated models in Mplus 4.2 (Muthén & Muthén, Reference Muthén and Muthén2007) with the weighted least squares mean and variance adjusted estimator and a Delta parameterization. The fit of the models was assessed with (1) the χ2 statistic [with 0⩽χ2⩽2 degrees of freedom (df) indicating good fit and 2 df⩽χ2⩽3 df indicating acceptable fit]; (2) root mean square error of approximation (RMSEA; with RMSEA ⩽0.06 indicating good fit); and (3) the comparative fit index (CFI; with CFI ⩾0.95 indicating good fit; Hu & Bentler, Reference Hu and Bentler1999).
Results
Sample characteristics
Descriptive characteristics of the groups of subjects exposed to the four different SLEs are provided in Table 1. The average symptom sum score (i.e. the total number of endorsed symptoms) differed across the SLE groups (e.g. the average sum score was lowest in the Stress group and highest in the Conflict group) and these differences were highly significant (non-parametric Kruskal–Wallis test: χ2=99.03, df=3, p<0.001).
Descriptive characteristics of the four SLE groups
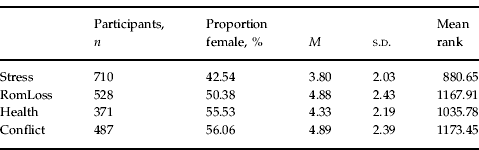
SLE, Stressful life event; proportion female, percentage of females in (sub)sample; M, average symptom sum score; s.d., standard deviation of the average symptom sum score; Stress, stress due to work, finances, legal problems, etc.; RomLoss, ending of a romantic relationship, including divorce; Health, one's own health problems; Conflict, interpersonal conflict between self and another.
Graphical representation of the correlation networks
Fig. 2 presents the correlation networks for the SLE groups (see Supplementary data; figure made with the R-package qgraph; Epskamp et al. Reference Epskamp, Cramer, Waldorp, Schmittmann and Borsboom2011). In general, the correlations between depressive symptoms are stronger after RomLoss and Conflict than after Stress or Health (where thickness of the connections between symptoms reflects the magnitude of the correlation). This general difference is, however, modest: average correlations between depressive symptoms in the four groups are 0.23, 0.21, 0.19 and 0.17 for the Stress, RomLoss, Health and Conflict groups, respectively. Differences are more substantial when differences in individual correlations between the SLE groups are examined. For example, the correlation between depressed mood (depr) and thoughts of death (deat) is much stronger in the Health and Conflict groups than in the Stress and RomLoss groups. The connection between feelings of worthlessness (wort) and thoughts of death (deat) is stronger in the Stress and RomLoss groups than in the Health and Conflict groups. There are also some similarities: in all four groups, weight loss (wlos) and weight gain (wgai) are strongly connected to decreased appetite (dapp) and increased appetite (iapp), respectively.
Correlation networks between the symptoms of a dysphoric episode for the four stressful life event groups. The top left depicts the network after stress; the top right after a romantic loss (RomLoss); the bottom left after health problems; and the bottom right after an interpersonal conflict. Each symptom is represented as a node in the networks and a connection between two symptoms represents the tetrachoric correlation between them. The connection is green when the correlation is positive and red when the correlation is negative. depr, Depressed mood; inte, loss of interest; wlos, weight loss; wgai, weight gain; dapp, decreased appetite; iapp, increased appetite; isom, insomnia; hsom, hypersomnia; pagi, psychomotor agitation; pret, psychomotor retardation; fati, fatigue; wort, feelings of worthlessness; conc, concentration problems; deat, thoughts of death.

Centrality of MD symptoms in the networks
Fig. 3 presents the centrality of each symptom in the four SLE groups. Some differences between the groups are worth noting: decreased appetite (dapp) is highly central in the Conflict group (is a distinct peak in the graph) while relatively peripheral in the RomLoss group (no peak in the graph). Loss of interest (inte) is very central in the RomLoss group while relatively peripheral in the Health group. Finally, fatigue (fati) is relatively central in the RomLoss group while relatively peripheral in the Stress and Health groups. In general, differences between SLE groups are more striking than their similarities but one similarity does stand out: feelings of worthlessness (wort) and thoughts of death (deat) rank among the most central symptoms in every SLE group.
Centrality of symptoms in the four stressful life event groups. The top left panel depicts symptom centrality after stress; the top right panel after a romantic loss (RomLoss); the bottom left panel after health problems; and the bottom right panel after an interpersonal conflict. The x-axis represents the 14 disaggregated symptoms of a dysphoric episode while the y-axis represents centrality (defined as the sum of tetrachoric correlations between a symptom and all the other symptoms in the network). depr, Depressed mood; inte, loss of interest; wlos, weight loss; wgai, weight gain; dapp, decreased appetite; iapp, increased appetite; isom, insomnia; hsom, hypersomnia; pagi, psychomotor agitation; pret, psychomotor retardation; fati, fatigue; wort, feelings of worthlessness; conc, concentration problems; deat, thoughts of death.

Homogeneity v. heterogeneity of the correlation networks
The solution in which correlations were estimated separately for each SLE group (i.e. heterogeneity) fitted much better than a solution in which correlations were constrained to be equal across SLE groups (i.e. homogeneity). This result was found in two separate analyses: (1) thresholds were estimated separately in each SLE group in both solutions; and (2) thresholds were constrained to be equal across SLE groups in both solutions. In both analyses, a highly significant χ2 difference test (χ2=384.41, df=273, p<0.001) indicated heterogeneity: the patterning of tetrachoric correlations between depressive symptoms of the SLE groups is significantly different from one another.
Source of differences in correlation networks
This analysis contrasted the fit of model I to model II, as described in the Method section, and was based on a categorical one-factor model in which the following correlations were allowed to be estimated in all models, but constrained to be equal across SLE groupsFootnote 3 (χ2=499.15, df=72, RMSEA=0.053, CFI=0.863)4: weight loss with decreased appetite, weight gain with increased appetite, psychomotor retardation with fatigue, insomnia with psychomotor agitation and hypersomnia with fatigue. Table 2 presents the results of fitting model I and model II to the data as well as a test of their relative fit. This test indicated that model II fitted the data significantly worse than model I (p<0.001). This means that the differences in the correlation networks of the four SLE groups cannot be explained by underlying differences in acute liability to develop a DEFootnote 5.
Goodness-of-fit statistics and χ2 difference tests for models testing factorial invariance of depressive symptoms across SLE groups
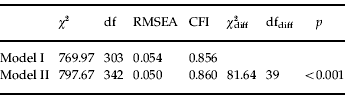
SLE, Stressful life event; df, degrees of freedom; RMSEA, root mean square error of approximation; CFI, comparative fit index; χ2 diff, χ2 statistic of the χ2 difference test; dfdiff, degrees of freedom of the χ2 difference test; p, p value of the χ2 difference test.
Discussion
Two theories about the nature of psychiatric disorders – the common cause and network hypothesis, respectively – postulate competing reasons for why SLEs influence depressive symptoms differently. The main goal of the present study was to investigate the predictions of these two hypotheses, an endeavour that is, to our knowledge, the first of its kind. To this end, we constructed networks of disaggregated depressive symptoms for four SLE groups based on participants with a DE. We compared these networks in a descriptive fashion, and assessed whether differences in the networks were (1) statistically significant and (2) best explained by underlying differences in acute liability to develop a DE. Our main results are that SLEs influence the correlations between depressive symptoms in markedly different ways; these differences are significant and cannot be explained by underlying differences in acute liability to develop a DE. That is, for example, the generally stronger correlations between depressive symptoms after a romantic breakup are not due to the fact that people have a higher liability to develop a DE after a romantic breakup compared with other SLEs.
Our results are not compatible with a common cause perspective. If a psychiatric disorder arises as predicted by the common cause hypothesis, then exogenous variables like SLEs should influence depressive symptoms only indirectly, via the common cause (i.e. acute liability to develop a DE; see Fig. 1 a). And, as such, differences between SLEs in their impact on depressive symptoms should arise due to underlying differences in the common cause. A common cause model might be adjusted so that it fits in the SLE groups with equal strength of the associations between a DE and its symptoms; e.g. by allowing (1) SLEs to influence the symptoms directly or (2) some of the residual variance of symptoms to be correlated. However, such a model might fit but still violates the idea of a common cause through which exogenous variables (SLEs) exert their influence.
A network perspective on psychiatric disorders explains our results in a natural way: the symptoms and direct (causal) relations between them are the causes of a psychiatric disorder. As such, the network perspective predicts that exogenous variables (SLEs) will make an impact on the symptoms directly without an intervening common cause: for example, a romantic breakup results in more hypersomnia than a health problem. We have not directly tested this hypothesis (i.e. we have not fitted a model like Fig. 1 b to the data, which is not possible given available methodological tools and the cross-sectional nature of the data) but, given that a common cause explanation is unlikely, the network perspective is currently the most plausible candidate for explaining the differences between SLEs in their influence on depressive symptoms.
If a network perspective on psychiatric disorders is accurate, then how do associations between symptoms arise? Suppose that depressed mood, insomnia, fatigue and concentration problems are strongly associated in someone: e.g. when Alice has trouble concentrating at work, she easily feels self-reproach for not being able to focus. Now, in such a strongly associated network of symptoms it theoretically takes only one symptom to become present as a result of an interpersonal conflict for instance – e.g. insomnia – for a syndrome to develop; for example, via the following sequence of events: insomnia→fatigue→concentration problems→self-reproach→depressed mood. It is likely that such connections between symptoms are governed by distinct pathological mechanisms. That is, a network perspective hypothesizes that symptoms will have partially distinct etiologies. For example, the connection between insomnia and fatigue will probably involve more physiological homeostatic mechanisms while the connection between depressed mood and self-reproach will be governed by more cognitive mechanisms. Moreover, individual differences are likely to arise in exactly these pathological mechanisms such that Alice will feel fatigued after one sleep-deprived night while Bob can endure four sleepless nights without developing fatigue. Therefore, given that the present study indicates that such a network of connected symptoms might portray an accurate picture of DEs, we need an alternative research agenda that promotes the discovery and analysis of pathological mechanisms that govern individual symptoms and connections between them, currently not a focus in research into the etiology of psychiatric disorders.
A conceptual shift to a network perspective has clinical implications, for example the identification of people who are at risk for developing a DE, or its more severe counterpart, MD. We have shown that the centrality of certain symptoms in the correlation networks varies depending on the nature of the precipitating event; for example, loss of interest is a central symptom after a romantic breakup but relatively peripheral after a health problem. What might this difference in centrality imply in terms of risk for developing a DE? The centrality of a symptom could be interpreted as an indicator of how risky the presence of that symptom is for the development of a full-blown syndrome: a central symptom is one that is strongly connected (i.e. correlated) to the other symptoms in the network. As such, when someone develops such a symptom, there is a substantial risk that other symptoms will subsequently emerge as well, potentially resulting in a depressive syndrome. The present findings generate testable hypotheses with respect to which SLEs in combination with what symptom(s) might most likely result in a diagnosis of a DE in the future. One such hypothesis would be that people, after having experienced a romantic breakup, who present themselves with loss of interest have an elevated risk of developing a DE compared with those (1) with the same SLE but with other, peripheral, symptoms and (2) with the same symptom but with another SLE for which loss of interest is not a central symptom.
Our results have conceptual and philosophical implications regarding the nature of psychiatric disorders. The most common approach to understanding psychiatric disorders has been ‘essentialism’ (Kendler, Reference Kendler2006; Zachar & Kendler, Reference Zachar and Kendler2007): all important properties of a psychiatric disorder arise from a single causal process roughly analogous to the way in which all features of Down's syndrome arise from the presence of all or part of an extra 21st chromosome. The common cause model is consistent with an essentialist model in that all the symptoms of a DE arise from a common process, analogous to an essence. Alternatively, we argue that a different concept of the nature of psychiatric disorders, mechanistic property clusters (MPCs), may be a more accurate model (Kendler et al. Reference Kendler, Zachar and Craver2010). This theory suggests that psychiatric disorders are more accurately defined in terms of mutually reinforcing networks of causal mechanisms. The network hypothesis is closely related to the concept of MPCs in suggesting that psychiatric disorders arise from interactions between their component symptoms rather than from some underlying essence. The findings of the present study are, to our knowledge, the first empirical piece of evidence that such models might be accurate in their portrayal of psychiatric disorders.
Our findings should be interpreted within the context of some limitations. First, the participants were Caucasian twins born in the US state of Virginia. As such, we cannot be sure whether our findings will generalize to other populations. Second, the basic model that we used for comparing model I and model II did not fit the data well, and it might therefore be argued that the results of that analysis should be interpreted with some degree of caution. The most plausible reason for this lack of good fit was that our sample was a selection of only those people who reported at least two aggregated symptoms, thus not including participants with one symptom or no symptoms at all (the model fitted the pre-selection sample data well). We repeated the analysis twice: (1) on the disaggregated data with a four-factor model that was not interpretable from a substantive point of view but fitted the data better; and (2) on the aggregated data for which a one-factor model fitted the data better than the model we reported on. In both cases, the outcome was identical to the one reported here. Third, with the available data, we cannot rule out the possibility that some of the covariation between some of the symptoms is due to an underlying, latent, mechanism (i.e. a common cause of some symptoms, rather than the common cause model as depicted in Fig. 1 a). However, we note that for many of the depressive symptoms, direct relations appear to be more likely: e.g. that it is the actual experience of not sleeping that makes you tired (instead of a common underlying mechanism that causes both insomnia and fatigue). Finally, we investigated a limited range of all possible symptoms in the context of a limited number of stressors. Also, because the inclusion criterion for this study was less stringent than having a diagnosis of MD (i.e. two or more co-occurring aggregated depressive symptoms sufficed), the results paint a picture of DEs and, as such, cannot be straightforwardly generalized to their more severe counterpart, MD. That said, it must be noted that in this particular sample, 29% of participants did have a diagnosis of MD, a percentage that is almost three times higher than what is normally reported in MD studies.
Note
Supplementary material accompanies this paper on the Journal's website (http://journals.cambridge.org/psm).
Acknowledgements
The authors thank Dawn L. Thiselton, Ph.D., and Sophie van der Sluis, Ph.D., for their comments on earlier versions of the manuscript. This study was supported in part by grants no. MH-068643 and no. MH-49492 from the National Institutes of Health (NIH). The work of A.O.J.C. and D.B. was supported by the Netherlands Organization for Scientific Research (NWO) (innovational research grant no. 451-03-068).
Declaration of Interest
None.



