


Highlights
Cost-effectiveness modeling using the AcT trial data showed tenecteplase dominated alteplase in treatment of acute ischemic stroke in Canada.
Though all benefits of simplified bolus administration were not considered, results support tenecteplase as a cost-effective strategy.
This study may help support decisions to adopt tenecteplase on hospital formularies.
Introduction
Stroke is a major cause of disability and death globally.Reference Katan and Luft1,Reference Li, Kong and Yang2 According to data from the World Health Organization, 15 million people worldwide experience a stroke annually, and, among these, 5 million people will die with another 5 million left with permanent disability, placing a major burden on patients, their families and society.3 In Canada, in 2017, there were 108,707 stroke events resulting in hospital or emergency room (ER) presentation across the country.Reference Holodinsky, Lindsay and Yu4 A recent study estimated the mean 1-year attributable direct costs of stroke (2021 Canadian dollars [CAD]) among community-dwelling adults in Ontario were $33,522, with higher costs for intracerebral hemorrhage (ICH; $40,244) than ischemic stroke ($32,547).Reference Vyas, Fang and de Oliveira5
The widespread adoption of reperfusion therapies, namely intravenous (IV) thrombolysis and endovascular thrombectomy (EVT), over the past two decades has markedly improved functional outcomes in patients with ischemic stroke, with substantial reductions in disability. Initially demonstrated in randomized controlled trials,Reference Heran, Lindsay and Gubitz6–Reference Emberson, Lees and Lyden9 these benefits are now well supported by real-world evidence, confirming their effectiveness across broader populations in reducing long-term mortality and improving functional independence.Reference Qin, Zhao and Chen10,Reference Rodriguez-Calienes, Borjas and Sanikommu11 IV thrombolysis with the tissue plasminogen activator alteplase has been the standard reperfusion treatment for acute ischemic stroke (AIS) patients presenting within 4.5 hours of symptom onset. However, more recently in 2022, tenecteplase, a genetically modified variant of alteplase that is administered as a bolus rather than a 60-minute infusion and has greater fibrin-specificity and a longer half-life,12 was added to the Canadian Stroke Best Practice Recommendations (CSBPR) as an alternative to alteplase.Reference Heran, Lindsay and Gubitz6 This recommendation, along with the Notice of Compliance granted by Health Canada on November 13, 2025, was supported by evidence from the Alteplase compared to Tenecteplase (AcT) trial. This was the first phase III study to report that tenecteplase (0.25 mg/kg based on standardized 10 kg weight bands, to a maximum of 25 mg) is non-inferior to alteplase (0.9 mg/kg to a maximum of 90 mg), with the direction of effect favoring the former. At 90 days, 36.9% and 34.8% of patients in the tenecteplase and alteplase groups, respectively, achieved the primary outcome of modified Rankin Scale (mRS) score of 0–1 (unadjusted difference = 2.1%, 95% confidence interval [CI] −2.6% to 6.9%), meeting the non-inferiority threshold. Safety analyses found no significant difference between groups in terms of mortality at 90 days (15.3% versus 15.4%), or in the proportion with symptomatic ICH at 24 hours (3.4% versus 3.2%).Reference Menon, Buck and Singh13
In light of tenecteplase’s favorable efficacy and safety profile and simplified administration protocol versus alteplase, tenecteplase may represent a cost-effective alternative. Hence, a pharmacoeconomic analysis of the two thrombolytics for AIS treatment was conducted from the Canadian healthcare payer perspective, with particular consideration of hospital resources, based on key data from the AcT trial.Reference Menon, Buck and Singh13
Methods
Study design
This was a cost-effectiveness analysis (CEA) comparing treatment of AIS patients within 4.5 hours of symptom onset with either alteplase or tenecteplase. The model and analysis were designed based on the AcT trial,Reference Menon, Buck and Singh13 including specification of the target population and comparator, and use of data for estimation of patient response to treatment (by mRS score) at 90 days. The base case analysis was conducted from the publicly funded healthcare perspective over a lifetime horizon. In addition, several scenario analyses were conducted, including an analysis using a 90-day time horizon to align with the AcT trial duration,Reference Menon, Buck and Singh13 which considered only hospital-related costs. Costs were presented in 2025 CAD; the Canadian health and personal care component of the Consumer Price Index14 was used to inflate input parameters where necessary.
Population
The AcT trial was a pragmatic study that enrolled all patients presenting to Canadian hospitals and eligible for IV thrombolysis per the CSBPR.Reference Boulanger, Lindsay and Gubitz15 Consistent with the AcT trial, the cohort entering the model was 74 years of age, 47.9% female, and with AIS (specifically, patients with a diagnosis of ischemic stroke causing disabling neurological deficit, presenting within 4.5 hours of symptom onset).Reference Menon, Buck and Singh13 Patients were treated with either alteplase (dose of 0.9 mg/kg to a maximum of 90 mg; infused over 60-minutes with 10% of the total dose administered as an initial IV bolus over 1 minute12) or tenecteplase (dose of 0.25 mg/kg to a maximum of 25 mg given as a single bolus over 5 secondsReference Heran, Lindsay and Gubitz6). It is noted that the Health Canada-approved indication for alteplase specifies that treatment should only be initiated within 3 hours after the onset of stroke symptoms.12 This is in contrast to CSBPR and the AcT trial protocol which both recommend a treatment window of up to 4.5 hours.Reference Heran, Lindsay and Gubitz6,Reference Menon, Buck and Singh13 Following meta-analytic evidence of the benefits and safety of alteplase given within 4.5 hours of AIS onset,Reference Hacke, Lyden and Emberson16,Reference Lees, Emberson and Blackwell17 this became standard practice in many countries including Canada, despite the fact that the Canadian regulatory approval was based on earlier trials that used a 3-hour symptom onset window.18,Reference Hill and Buchan19
As this was an analysis comparing treatment of AIS with alteplase or tenecteplase, in the base case, patients within a treatment arm who experienced any recurrent stroke(s) following the index stroke were assumed to experience the recurrent event more than 4 weeks after the previous stroke and were assumed to receive the same thrombolytic as they received for their index stroke. A scenario analysis was conducted, however, that applied mRS health state transitions estimated from pooled data (see Supplementary Materials, Table 1) and the average cost of thrombolytics and their administration to all patients following a recurrent stroke to model the possibility that an alternate thrombolytic might have been received for treatment of the recurrent event.
Model structure and transitions
The model structure is shown in Figure 1. Similar to previously published models of stroke treatments,Reference Gao, Moodie and Mitchell20–Reference Chen, Liang and Tong27 the model combined a decision tree and a Markov model. The model began with the decision to treat AIS patients with tenecteplase or alteplase and, based on data from the AcT trial,Reference Menon, Buck and Singh13 patients achieved one of the seven mRS health states at 90 days post-stroke (Table 1); this represented each patient’s terminal status in the decision tree and each survivor’s initial status in the Markov model. It is noted that AcT was a non-inferiority trial, and differences in 90-day mRS score distributions did not reach statistical significance. The numerical differences observed between arms were, however, used in modeling the base case, which is supported by the cumulative evidence produced via meta-analysis which favored tenecteplase on functional outcome.Reference Shen, Bao and Tang28 Nonetheless, a scenario analysis was conducted wherein the treatment-specific 90-day distributions were pooled, and the resultant mRS health state transitions (see Supplementary Materials, Table 1) were assumed for both cohorts.
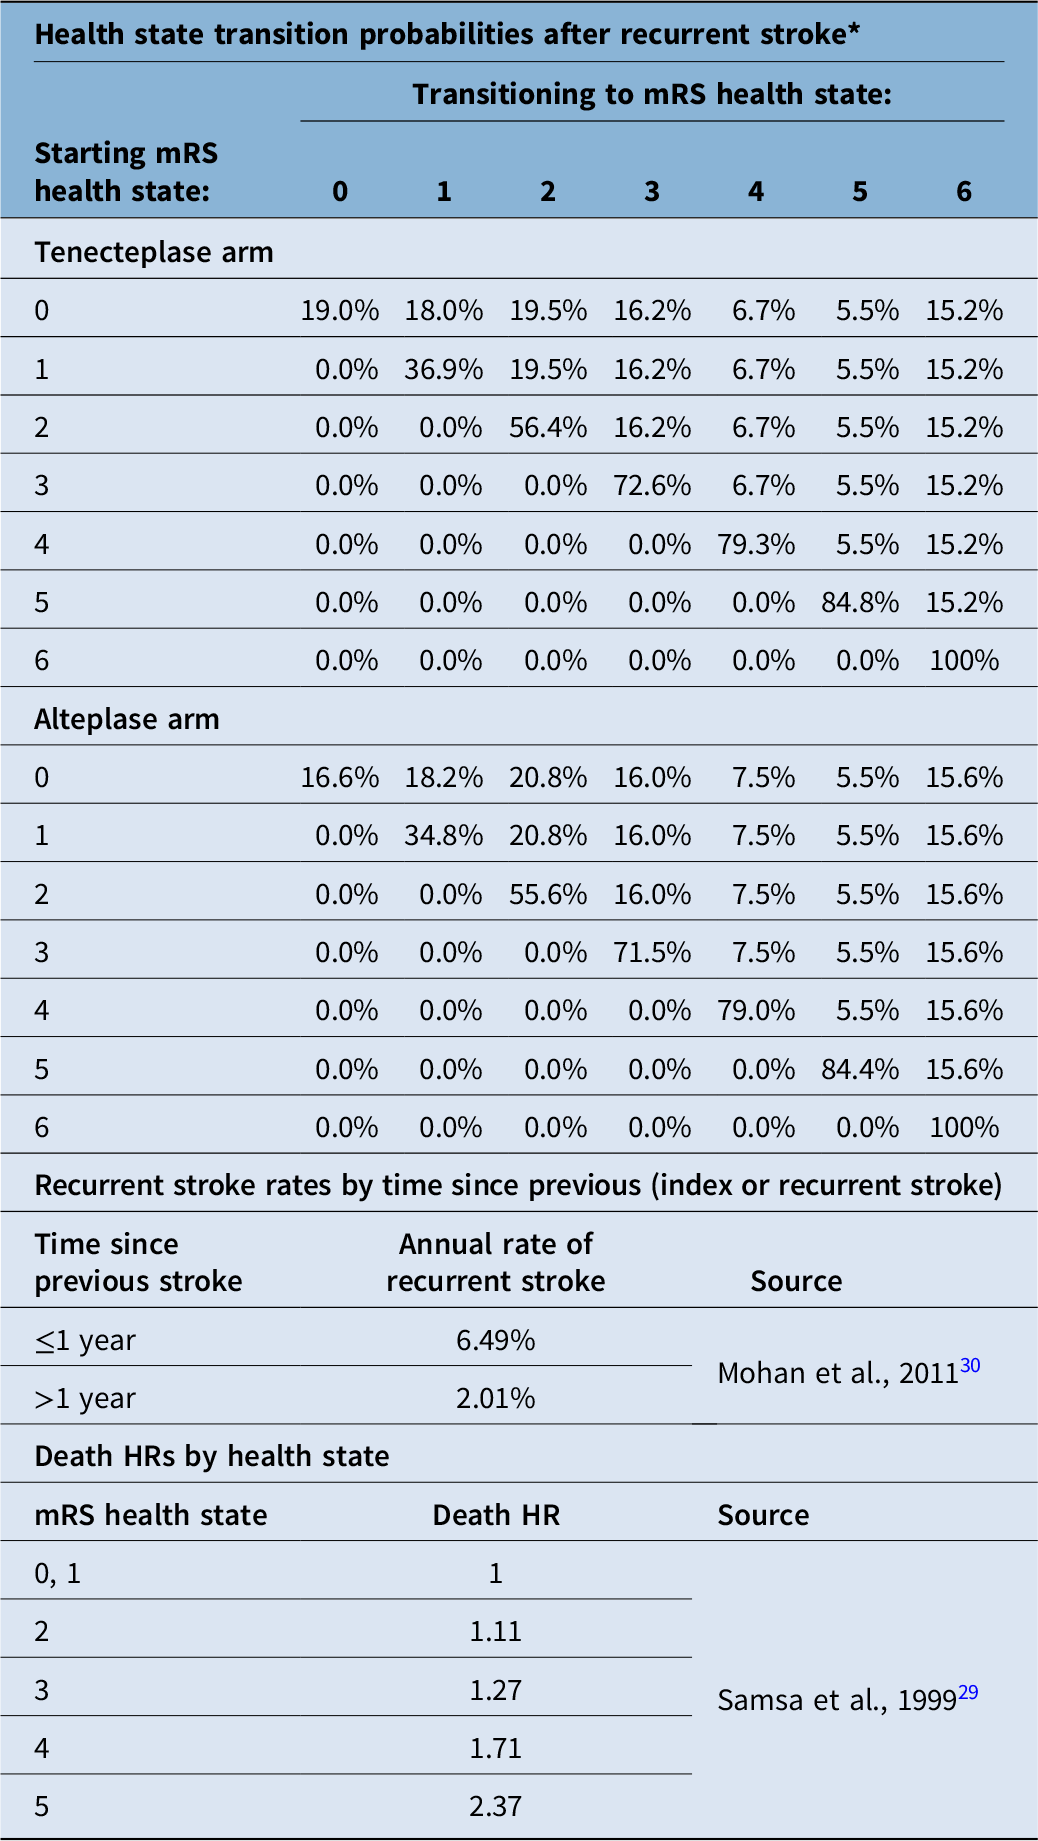
Overview of transition-related parameters used for estimation of the Markov portion of the model to define movements between health states

Table 1. Long description
The table is divided into three main sections. The first section shows health state transition probabilities after recurrent stroke for the tenecteplase and alteplase arms. It has seven rows labeled with starting mRS health states from 0 to 6 and columns labeled with transitioning mRS health states from 0 to 6. Each cell contains a percentage value representing the transition probability. The second section lists recurrent stroke rates by time since previous stroke, with rows for time intervals (less than or equal to 1 year and greater than 1 year) and columns for annual rate of recurrent stroke and source. The third section presents death hazard ratios by health state, with rows for mRS health states 0 to 5 and columns for death hazard ratio and source. Notable trends include higher transition probabilities to worse health states as the starting health state worsens and higher recurrent stroke rates within the first year compared to subsequent years.
HR = hazard ratio; mRS = modified Rankin Scale.
*Derived from the tenecteplase or alteplase arm of the AcT trial.Reference Menon, Buck and Singh13
Patients’ terminal status at 90 days in the decision tree, defined by the values in the row representing the starting mRS health state 0, represents each survivor’s initial status in the Markov model. In each annual cycle, patients who were alive faced three options: no new event, recurrent stroke and death due to other causes. At the end of each cycle, patients who experienced no new event remained in their current mRS health state, while those with recurrent stroke (whose rate varies by time since previous stroke) transitioned to a mRS health state that is equal to or worse than their current one (based on the health state transition probabilities after recurrent stroke). Death could be due to a recurrent stroke (whose hazard ratio varies according to the mRS health state) or age-specific background mortality.
The Markov model, used to extrapolate the outcomes data from the AcT trial over the lifetime of the cohort, was informed using data from the AcT trial and from the literature (Table 1).Reference Menon, Buck and Singh13,Reference Samsa, Reutter and Parmigiani29,Reference Mohan, Wolfe and Rudd30 The Markov model consisted of eight health states: seven states defined by patients’ mRS score and an additional “Death (background)” state. In each annual cycle, patients who were alive faced three options: no new event, recurrent stroke, and death due to other causes. At the end of each cycle, patients either remained in their current mRS health state, transitioned to a worse mRS health state, or died; those who experienced no new event remained in their current mRS health state, while those with recurrent stroke transitioned to a mRS health state that was equal to or worse than their current one. Death could be due to a recurrent stroke (i.e., transitions to the mRS 6 health state) or age-specific background mortality.31
Consistent with previously published CEA models,Reference Gao, Moodie and Mitchell20,Reference Arora, Makino and Tilden22 probabilities of experiencing a recurrent stroke (Table 1) were dependent on time since previous stroke and were obtained from a systematic review and meta-analysis of cumulative risks of stroke over time, published by Mohan et al., 2011.Reference Mohan, Wolfe and Rudd30 These annual probabilities were the same for both treatment arms and did not vary across mRS scores; previous publications have noted that there is no evidence that disability (i.e., mRS) levels affect the risk of stroke recurrence.Reference Gao, Moodie and Mitchell20,Reference Arora, Makino and Tilden22 Considering the values selected for the base case are relatively old (i.e., from 2010) and that the authors demonstrated a temporal reduction in risks of recurrent stroke,Reference Mohan, Wolfe and Rudd30 a scenario analysis was conducted wherein the risks were reduced by 50%. This reduction is further supported by a more recent UK study by Flach et al., 2020, which estimated risks and trends of stroke recurrence in a population-based cohort of patients with a first-ever stroke between 1995 and 2018; it was found that the rate of recurrence reduced until the mid-2000s but then generally plateaued.Reference Flach, Muruet and Wolfe32
Following a recurrent stroke, patients were able to transition to a worse mRS health state, dependent on data from the AcT trial.Reference Menon, Buck and Singh13 To derive these transition probabilities, the same mRS health state distributions as were assumed at 90 days were utilized, but with the assumption applied that patients could also remain at their current mRS score but could not improve. For example, in the event of a recurrent stroke in a patient with a current mRS score of 3 (mRS 3), the probability of transitioning to mRS 4, mRS 5, or mRS 6 health states followed the 90-day mRS score distribution of the tenecteplase or alteplase group from the AcT trial as discussed earlier (i.e., first row in each set of transitions shown in Table 1), while the probability of remaining in mRS 3 was the arm-specific summed probabilities from mRS 0 to 3 from the trial. All health state transition probabilities used in the base case are shown in Table 1.
Patients who survived an AIS (i.e., did not transition to mRS 6) were at risk of death from sex- and age-specific background mortality (i.e., death due to other causes),31 adjusted for the increased risk associated with their stroke history using mRS-specific death hazard ratios (HRs).Reference Samsa, Reutter and Parmigiani29 The HRs applied in the model are shown in Table 1 and are from an early publication of the Stroke Prevention Policy Model by Samsa et al., 1999.Reference Samsa, Reutter and Parmigiani29 In their study, risk ratios for mRS score on subsequent death hazards were derived by a panel of five clinical and epidemiology experts using a Delphi panel methodology. Although these values have been used in several published CEAs,Reference Gao, Moodie and Mitchell20,Reference Tung, Win and Lansberg21,Reference Zhao, Cheng and Tong24,Reference Pan, Chen and Zhao26,Reference Chen, Liang and Tong27 a scenario analysis was conducted wherein we conservatively assumed no excess mortality associated with stroke history.
Model schematic. AIS = acute ischemic stroke; mRS = modified Rankin Scale [+] = same structure as shown for tenecteplase. Model schematic featuring a 90-day decision tree following treatment of AIS with tenecteplase or alteplase, followed by a lifetime Markov model consisting of seven health states defined by patients’ functional outcome (mRS score 0 to 6) plus a death (background mortality) state. After the acute phase, where probabilities are derived from the AcT trial, movements between mRS states are dependent on the annual risk of stroke recurrence.

Quality-of-life and cost parameters
Quality-adjusted life-year (QALY) gains over the first 90 days were estimated utilizing mRS-specific utility values applied to patients’ terminal status and with the assumption that baseline utility values were the same between the two treatment groups in the AcT trial. Additionally, the same utility values were applied to patients in each cycle of the Markov model dependent on their mRS health state and, therefore, changed only when a patient moved to a new mRS state. The death health state (which included patients in mRS 6 and those who died from other causes) was an absorbing state in which patients did not incur additional QALYs. The health utility data defining the quality-of-life (QoL) of patients in each mRS health state were obtained from a published meta-analysis of utility weights in adults with stroke from multiple countries (Table 2).Reference Rebchuk, O’Neill and Szefer33 An alternate source of utility data was substituted in a scenario analysis (see Supplementary Materials, Table 1).Reference Chaisinanunkul, Adeoye and Lewis34
Quality-of-life and cost parameters used to value model health states, costs of treatments and their administration, and cost of stroke hospitalization

Table 2. Long description
A table comparing health state utility values, resource use, and costs for stroke treatment and management. The table has 20 rows and 3 columns. The columns are labeled Input parameter, Base case value, and Source. The rows are grouped into Health state utility values, Thrombolytic acquisition, Thrombolytic administration resources, Thrombolytic administration cost, Stroke hospitalization, and Stroke management cost by health state. Each row lists specific parameters, their base case values, and the sources of these values. Notable parameters include health state utility values for mRS 0 to mRS 6, costs of thrombolytic acquisition for Tenecteplase and Alteplase, costs of thrombolytic administration resources, costs of stroke hospitalization, and stroke management costs by health state for different time periods and mRS levels.
mRS = modified Rankin Scale; N/A = not applicable; SD = standard deviation.
Quality-adjusted life-year (QALY) gains are estimated utilizing mRS-specific utility values (varying from 0, representing death, to 1, reflecting perfect health) applied to patients’ status in each cycle. Costs implemented in the model included the costs of each thrombolytic and its in-hospital administration (very conservatively limited to the inclusion of sterile syringes and needles), the cost of the stroke hospitalization and the cost of stroke management, which varies according to the mRS health state and with time.
Costs applied over the 90-day decision tree included the costs of each thrombolytic and its in-hospital administration12,35,36 and the cost of the index stroke hospitalization.Reference Yu, Krahn and Austin37 During the Markov model, all patients received a first-year stroke management cost specific to their 90-day mRS health state.Reference Gao, Moodie and Mitchell20,Reference Yu, Krahn and Austin37 Similarly, patients experiencing a recurrent stroke during the model incurred the cost of stroke hospitalization (including a thrombolytic and its in-hospital administration) plus a first-year stroke management cost specific to their new mRS health state. To account for more intensive healthcare resource utilization in the first year post-acute stroke,Reference Gloede, Halbach and Thrift38,Reference Rogoza and Motsepe-Ditshego39 separate stroke management costs for the first versus subsequent years were applied.Reference Gao, Moodie and Mitchell20,Reference Yu, Krahn and Austin37 Base case costs are summarized in Table 2.
The acquisition cost of tenecteplase and alteplase was provided by Hoffmann-La Roche Ltd. Although dosing of each thrombolytic is weight-dependent, one vial of tenecteplase (25 mg vial) or alteplase (100 mg vial) was assumed per treated patient; given the limitations that these are single-use vials, that any unused reconstituted drug may only be stored for up to 8 hours, and that the product monographs recommend discarding unused portions,12,35 vial sharing between patients was not modeled.
While there are many advantages associated with the simpler administration protocol for tenecteplase versus alteplase (detailed in the Discussion), most were difficult to quantify for inclusion in the CEA model. Very conservatively, administration costs were limited to the inclusion of sterile syringes and needles (one of each required for tenecteplase35 versus two of each for alteplase12). However, a scenario analysis was conducted in which nurse and neurologist time were considered. Based on a protocol for thrombolysis administration from the Centre hospitalier de l’Université de Montréal (CHUM), the largest hospital in the province of Quebec, the ER nurse must remain during the 60-minute alteplase infusion for patient and infusion pump monitoring, and, furthermore, it is required that the physician remain accessible throughout the infusion to intervene quickly in the event of a complication.40 The parameters assumed in the scenario analysis, including nurse and neurologist time and associated wages and fees, are detailed in the Supplementary Materials, Table 1. While it is noted that these requirements are specific to alteplase, it is uncertain to what extent the “freed up” healthcare provider time in the case of tenecteplase administration is translated into value to other patients and/or the healthcare system and how this may change in the future as hospital staffs become more comfortable with tenecteplase in this setting.
The stroke hospitalization cost was derived from a Canadian study recently published by Yu et al., 2021.Reference Yu, Krahn and Austin37 In this study, the authors estimated direct healthcare costs in individuals (N = 101,252) admitted to hospital with stroke (87% AIS versus ICH) between 2008 and 2017 in Ontario using administrative data to calculate direct person-level costs in 2018 CAD in the one-year following stroke. Total one-year costs were presented disaggregated by care setting, and the acute care portion (which included costs of ER visits, hospitalizations for the index event and subsequent encounters in acute care) was inflated to 2025 CAD14 and utilized as the basis for the cost of stroke hospitalization in the model. To prevent double counting of costs related to thrombolytics, the total acquisition and administration costs estimated for alteplase were subtracted from the stroke hospitalization cost; as the hospitalization cost data were collected between 2008 and 2017, utilization of alteplase for AIS was assumed to be most prevalent during this time. The resultant cost (Table 2) was applied to all patients experiencing their index and any recurrent strokes in the base case, regardless of treatment arm given that the mean length of stay (LOS) was the same in the tenecteplase and alteplase arms in the AcT trial (i.e., 5 days).Reference Menon, Buck and Singh13 As it is likely that the base case cost was an overestimate of the actual index stroke hospitalization cost since the source data included subsequent encounters in acute care during the first year,Reference Yu, Krahn and Austin37 a scenario analysis was conducted wherein the base case cost was aggressively reduced by 50% (and stroke management costs were re-estimated accordingly; see next paragraph). Conversely, evidence from a recent US study indicated that stroke hospitalization costs have increased substantially over the past decade despite improvements in stroke outcomes, LOS and lower mortality.Reference Lorio, Garcia-Rodriguez and Seifi41 To reflect this possibility, a second scenario analysis was conducted in which the base case cost was increased by 50%.
Finally, while a number of Canadian costing studies were considered,Reference Mittmann, Seung and Hill42,Reference Goeree, Blackhouse and Petrovic43 Canadian stroke management costs presented on an mRS-specific basis could not be identified, and, therefore, management costs for the model were derived based on Australian costs used in a CEA published by Gao et al., 2020.Reference Gao, Moodie and Mitchell20 Similar to the approach used in a previously published Canadian CEA,Reference Ye, Zhou and Zhang23 this was accomplished by applying the Australian ratios of direct stroke management costs per mRS state to recurrent stroke hospitalization cost to the stroke hospitalization cost estimated for our model. In the absence of Canadian-specific data, it is reasonable to assume these ratios are generalizable to Canada since Canada and Australia have highly comparable health systems, both being tax-funded systems providing universal health coverage with similar institutional structures and delivery models. Furthermore, Australia’s Medicare system was originally modeled on Canada’s publicly funded systems, and both countries operate within similar high-income Organization for Economic Co-operation and Development contexts.Reference Duckett44–Reference Pervan and Sutherland46 The resultant stroke management costs, which are higher for the first-year post-stroke versus subsequent years regardless of the mRS state, are shown in Table 2. It was assumed that patients did not incur additional costs in the death states beyond the stroke hospitalization cost, and, therefore, the stroke management costs for mRS 6 were $0.
Adverse events
It was observed in the AcT trial that there were no meaningful differences in the rate of occurrence of adverse events (AEs) between tenecteplase and alteplase, specifically regarding the events of special interest which included 24-hour symptomatic intracerebral hemorrhage (sICH), orolingual angioedema and extracranial bleeding requiring blood transfusion. Hence, no AEs were included in the base case analysis. Since the rate of sICH was numerically higher in the tenecteplase arm (3.4% versus 3.2% alteplase),Reference Menon, Buck and Singh13 a scenario analysis was conducted that included cost and QoL impacts of sICH (see Supplementary Materials, Table 1 for related parameters).
Outcomes
Outcomes predicted by the model included, by treatment, total costs, life-years (LYs) and QALYs over the model time horizon. Cost-effectiveness was assessed in terms of incremental cost-effectiveness ratios (ICERs), specifically, incremental cost per QALY gained. Costs and outcomes beyond the first year were discounted at an annual rate of 1.5%;47 an alternate value of 3% was substituted in a scenario analysis.
Analyses
The base case ICER was determined deterministically and probabilistically. The probabilistic sensitivity analysis (PSA) was performed using a Monte Carlo analysis of 5000 simulations. Parameters were varied probabilistically with the following distributions: health state transitions, Dirichlet; death HRs and costs, gamma; recurrent stroke rates and utility values, beta.Reference Briggs, Sulpher and Claxton48 With the exception of utility values wherein the source publication reported standard deviations (SDs),Reference Rebchuk, O’Neill and Szefer33 the standard error for all remaining parameters was assumed to be 10% of the mean value. Results were presented in the form of a scatterplot and cost-effectiveness acceptability curves (CEAC), which show the fractions of the total simulations in which each comparator is incrementally cost-effective over a range of ICER thresholds. Deterministic (one-way) sensitivity analyses (DSAs) were also performed to assess how changes (± 20% of their base case value) in key model parameters affect cost-effectiveness results. Finally, to test the effect of key assumptions on the model’s robustness, an extensive series of scenario analyses were performed as described throughout the text.
Results
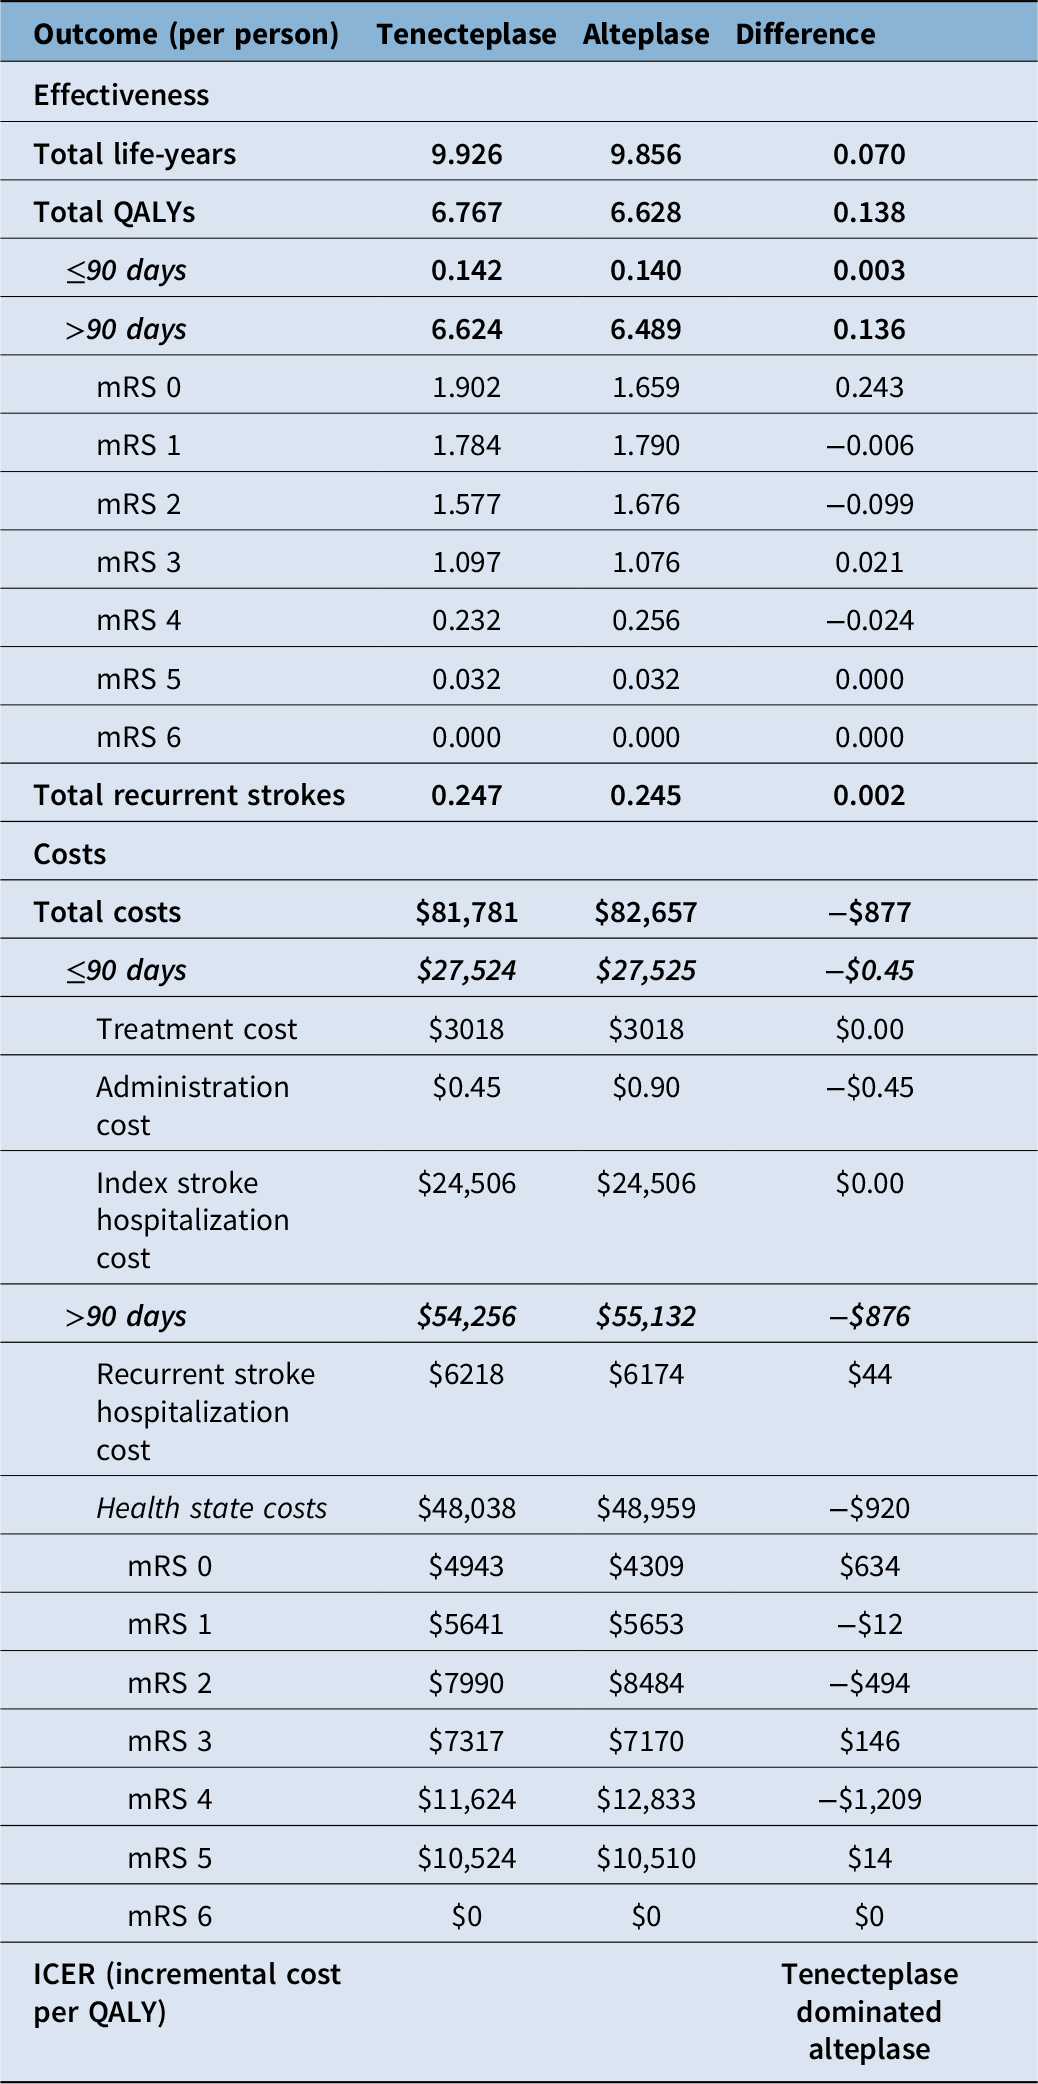
Deterministic base case results showing total and disaggregated outcomes are presented in Table 3. Patients in the tenecteplase arm had on average 9.93 LYs, which translated to 6.77 QALYs over the time horizon. Both outcomes were slightly higher than those achieved by patients in the alteplase arm, with QALY gains beginning as early as at 90 days post-index stroke and with most of the gains being attained in the mRS 0 health state. The per-patient stroke rate was slightly higher among tenecteplase-treated patients compared to alteplase, which was driven by better survival in the tenecteplase arm allowing more patients to be at risk of the event.
Discounted clinical and economic deterministic base case results

Table 3. Long description
A table comparing the effectiveness and costs of tenecteplase and alteplase treatments. The table has 25 rows and 4 columns. The columns are labeled Effectiveness, Tenecteplase, Alteplase, and Difference. The rows are grouped under Effectiveness and Costs, with subcategories for each. Row 1: Total life-years, Tenecteplase 9.926, Alteplase 9.856, Difference 0.070. Row 2: Total QALYs, Tenecteplase 6.767, Alteplase 6.628, Difference 0.138. Row 3: ≤90 days, Tenecteplase 0.142, Alteplase 0.140, Difference 0.003. Row 4: >90 days, Tenecteplase 6.624, Alteplase 6.489, Difference 0.136. Row 5: mRS 0, Tenecteplase 1.902, Alteplase 1.659, Difference 0.243. Row 6: mRS 1, Tenecteplase 1.784, Alteplase 1.790, Difference -0.006. Row 7: mRS 2, Tenecteplase 1.577, Alteplase 1.676, Difference -0.099. Row 8: mRS 3, Tenecteplase 1.097, Alteplase 1.076, Difference 0.021. Row 9: mRS 4, Tenecteplase 0.232, Alteplase 0.256, Difference -0.024. Row 10: mRS 5, Tenecteplase 0.032, Alteplase 0.032, Difference 0.000. Row 11: mRS 6, Tenecteplase 0.000, Alteplase 0.000, Difference 0.000. Row 12: Total recurrent strokes, Tenecteplase 0.247, Alteplase 0.245, Difference 0.002. Row 13: Total costs, Tenecteplase $81781, Alteplase $82657, Difference -$877. Row 14: ≤90 days, Tenecteplase $27524, Alteplase $27525, Difference -$0.45. Row 15: Treatment cost, Tenecteplase $3018, Alteplase $3018, Difference $0.00. Row 16: Administration cost, Tenecteplase $0.45, Alteplase $0.90, Difference -$0.45. Row 17: Index stroke hospitalization cost, Tenecteplase $24506, Alteplase $24506, Difference $0.00. Row 18: >90 days, Tenecteplase $54256, Alteplase $55132, Difference -$876. Row 19: Recurrent stroke hospitalization cost, Tenecteplase $6218, Alteplase $6174, Difference $44. Row 20: Health state costs, Tenecteplase $48038, Alteplase $48959, Difference -$920. Row 21: mRS 0, Tenecteplase $4943, Alteplase $4309, Difference $634. Row 22: mRS 1, Tenecteplase $5641, Alteplase $5653, Difference -$12. Row 23: mRS 2, Tenecteplase $7990, Alteplase $8484, Difference -$494. Row 24: mRS 3, Tenecteplase $7317, Alteplase $7170, Difference $146. Row 25: mRS 4, Tenecteplase $11624, Alteplase $12833, Difference -$1209. Row 26: mRS 5, Tenecteplase $10524, Alteplase $10510, Difference $14. Row 27: mRS 6, Tenecteplase $0, Alteplase $0, Difference $0. Row 28: ICER (incremental cost per QALY), Tenecteplase dominated alteplase.
ICER = incremental cost-effectiveness ratio; mRS = modified Rankin Scale; QALY = quality-adjusted life-year.
Clinical outcomes predicted by the model are expressed as life-years, quality-adjusted life-years and number of recurrent strokes per patient. On the economic side, costs are disaggregated, by category and grouped according to the moment they occur compared with the index stroke (within or after 90 days). Results (totals and disaggregated) are reported per-patient treated with tenecteplase or alteplase and were obtained through deterministic analysis using a 1.5% annual discount rate. The cost-effectiveness result shows dominance of tenecteplase over alteplase, driven by greater health gains (QALYs) alongside overall cost savings.
Mean lifetime costs were approximately $82,000, with savings of $877 predicted for patients in the tenecteplase arm. Cost savings at 90 days were minimal (i.e., $0.45, the cost of one needle/syringe), partially due to the challenges faced in quantifying the economic benefits associated with tenecteplase’s simplified administration protocol. The majority of cost savings achieved with tenecteplase were related to costs of stroke management for patients in the mRS 4 health state. Because patients in the tenecteplase arm achieved greater benefits (i.e., QALYs) at a lower total cost, the CEA predicted alteplase to be dominated by treatment with tenecteplase for AIS.
The DSA that varied all key model parameters ±20% of their base case value found the model was robust to changes in these parameters. Almost all DSAs found that tenecteplase continued to dominate alteplase (i.e., generated more QALYs and cost savings), with ICERs resulting only in analyses in which the cost of stroke hospitalization was varied only in one treatment group. In the base case, all hospitalizations were assumed to have the same cost, regardless of which thrombolytic was received (based on the same LOS observed between arms in AcT) and whether a stroke was index or recurrent. When the index stroke hospitalization cost was increased by 20% in only the tenecteplase arm or decreased by 20% in only the alteplase arm (i.e., both scenarios disadvantaging tenecteplase), ICERs of approximately $29,000 per QALY gained for tenecteplase were achieved; when the same variation was instead applied to the recurrent stroke cost, the ICERs were lower at approximately $1700 per QALY gained. Results for only these DSAs in which tenecteplase was not dominant are shown in the Supplementary Materials, Table 2.
PSA results were consistent with the deterministic base case results, that patients in the tenecteplase arm were expected to have lower costs and higher QALYs (Table 4). The scatterplot and CEAC are shown in the Supplementary Materials, Figures 1 and 2. The majority of the probabilistically generated iterations fell in the north-west quadrant, indicating a high probability of tenecteplase being cost saving and generating more QALYs. The corresponding CEAC suggests there is a 57% chance that treatment with tenecteplase will lead to cost savings. It also suggests that, at a willingness-to-pay threshold of $50,000 to gain an additional QALY, for example, there is a>70% probability that tenecteplase is the cost-effective option (i.e., that the true ICER falls below this threshold).
Probabilistic base case and deterministic scenario analyses

Table 4. Long description
A table with 18 rows and 6 columns comparing costs and QALYs for Tenecteplase and Alteplase across different analyses and scenarios. The columns are labeled Cost, QALYs, Difference, and ICER, with sub-columns for Tenecteplase and Alteplase. The rows are grouped into Base case and Scenarios (deterministic), with specific scenarios listed under each group. Each row provides cost and QALY values for both treatments, their differences, and the ICER. Notable trends include Tenecteplase generally having lower costs and higher QALYs compared to Alteplase across most scenarios.
HR = hazard ratio; ICER = incremental cost-effectiveness ratio; mRS = modified Rankin Scale; QALY = quality-adjusted life-year; sICH = symptomatic intracerebral hemorrhage; AcT = Alteplase compared to Tenecteplase.
Where uncertainty on clinical (thrombolytic received, efficacy based on mRS, recurrent stroke risk, death risk, utility values, adverse events), economic (administration cost, hospitalization cost) or analytic (time horizon, discount rate) parameters used in the model was raised, scenario analyses were conducted to test the robustness of the base case conclusion. Results of these analyses, achieved through use of alternate data sources and/or assumptions relative to the deterministic base case results, are expressed as total per-patient lifetime costs, QALYs, incremental differences and ICERs. The results of all scenario analyses support the initial conclusion by confirming the dominance of tenecteplase (i.e., a strategy associated with savings and generating more QALYs compared to alteplase).
An extensive series of scenario analyses were conducted, with a summary of each scenario and its corresponding results presented in Table 4. In all scenarios, tenecteplase continued to dominate alteplase in the treatment of AIS. The cost savings and QALY gains for tenecteplase versus alteplase were lowest when the analysis was conducted over a 90-day time horizon and when the same efficacy (i.e., pooled values) was assumed in both arms (i.e., cost-minimization analysis); in each of these scenarios, the cost difference between arms was driven by the cost of an additional needle and syringe required for each alteplase administration. The largest cost differential was achieved in the scenario in which the death HRs were removed such that patients in the model (all having a stroke history) were assumed to face the same mortality risks as the general population. In this scenario, total costs and QALYs per arm were higher than in the base case since patients survived longer and were therefore at higher cumulative risk of recurrent stroke (with its associated costs and opportunity to move to a worse mRS health state). There were minimal changes in the incremental QALYs predicted across the scenario analyses, even when an alternate source of utility data was used.Reference Chaisinanunkul, Adeoye and Lewis34
Discussion
The results of our economic analysis, which is similar in model design to other published models of stroke treatmentsReference Gao, Moodie and Mitchell20–Reference Chen, Liang and Tong27 and leverages data from the landmark Canadian AcT trial,Reference Menon, Buck and Singh13 demonstrated tenecteplase to dominate alteplase (i.e., produced more QALYs [0.138/patient; 2.1% increase] and LYs [0.070/patient; 0.7% increase] at lower costs [savings of $877/patient]) in the treatment of AIS patients within 4.5 hours of symptom onset. Although our base case analysis, conducted from the healthcare system perspective, utilized a lifetime horizon, tenecteplase dominance was also achieved when assessed at 90 days post-AIS (i.e., AcT trial duration). Numerous sensitivity and scenario analyses confirmed the robustness of these findings. The functional (QALY) advantage was the more robust finding: the cost difference was smaller and less certain, with about 57% of probabilistic iterations cost-saving, so the economic result can be read as cost-neutrality with probable savings rather than as uniform dominance.
The clinical outcomes predicted by the model were driven mainly by numerical differences favoring tenecteplase observed in the AcT trial, specifically the proportion of patients reaching mRS 0 (i.e., no residual symptoms; tenecteplase 19.0%, alteplase 16.6%) and mRS 6 (i.e., death; tenecteplase 15.2%, alteplase 15.6%) at 90–120 days.Reference Menon, Buck and Singh13 AcT enrolled a large sample under pragmatic eligibility criteria reflective of routine Canadian practice, and, although designed as a non-inferiority trial, the direction of effect favoring tenecteplase is consistent with subsequent meta-analytic evidence. In a systematic review and meta-analysis restricted to the same comparison evaluated here (tenecteplase 0.25 mg/kg versus alteplase within 4.5 hours of onset; 11 randomized trials, 7545 patients), tenecteplase was associated with a higher likelihood of an excellent functional outcome (mRS 0–1) at 90 days (risk ratio 1.05, 95% CI 1.01–1.10; absolute risk difference 2.95%, 95% CI 0.76–5.14), with comparable rates of sICH (risk ratio 1.12, 95% CI 0.83–1.53) and 90-day mortality (risk ratio 0.97, 95% CI 0.82–1.15). These pooled estimates support the small functional advantage and the safety equipoise assumed in the model.Reference Palaiodimou, Katsanos and Turc49
While our study attempted to accurately predict both the clinical and economic benefits associated with tenecteplase treatment, the base case cost savings (and, possibly, the clinical gains) can be considered very conservative, particularly regarding the modeling of tenecteplase administration advantages. As has been noted, benefits related to the simpler administration protocol for tenecteplase versus alteplase (i.e., single 5-second IV bolus versus 1-minute bolus followed by 60-minute infusion) were difficult to quantify for inclusion in the CEA model and, in the base case, were limited to the costs of sterile syringes and needles (one of each required for tenecteplase35 versus two of each for alteplase12). A scenario analysis was conducted, trying to capture opportunity costs related to nursing and neurologist time required for infusion pump and extra patient monitoring (mainly derived from the CHUM protocol for alteplase administration40), respectively; freeing up these resources in the case of tenecteplase may translate into more patient-centered care for the AIS patient and/or for other patients or tasks requiring attention. Inclusion of nursing wages and physician fees related to these potential efficiencies increased the base case cost savings achieved with use of tenecteplase from $877 to $926 per patient, which amplifies the extent of its dominance compared to alteplase.
Additional advantages that could not be quantified for our modeling, specifically related to the lack of infusion pump requirement for tenecteplase, include the following: i) time savings for hospital staff in terms of securing and transporting the pump to the patient, set-up/programming, and cleaning/sterilization; ii) potential reduction in dosing errors from incorrect programming;Reference Dancsecs, Nestor and Bailey50 iii) earlier treatment initiation;Reference Warach, Dula and Milling51 and iv) no interruption of treatment. Furthermore, infusion pump monitoring during intra-hospital or inter-hospital transfer is not required and, hence, patient transfer can be initiated soonerReference Warach, Dula and Milling51 and is simpler than with alteplase. Patients can be transferred (to a comprehensive stroke center for thrombectomy, for example) immediately after receiving the IV bolus of tenecteplase and without the attendance of an advanced life support crew. Transfer of patients within a hospital, especially to the angiography suite for EVT procedure, is potentially easier and more efficient, when an infusion pump is not required. While it seems intuitive that these advantages associated with the simpler administration of tenecteplase should result in benefits to patients, healthcare workers, hospitals and the healthcare system, they are not reflected in our analysis. Their inclusion would have advantaged tenecteplase and increased the magnitude of its dominance versus alteplase.
Another limitation of our analysis is that it was challenging to find a recent, published source of stroke hospitalization and management costs in Canada in the format required for the model. Two landmark (older) studies that estimated stroke costs in Canada were considered.Reference Mittmann, Seung and Hill42,Reference Goeree, Blackhouse and Petrovic43 A study by Goeree et al. (2005) estimated the 1-year cost of managing patients with ischemic stroke (N = 188) in Canada to be $53,576 (2004 CAD; including indirect costs) based on a prospective follow-up study of patients presenting to the ER of a large teaching hospital in Hamilton over a 6-month period in 2001. The initial hospitalization costs represented the largest contributor to the 1-year cost ($19,026) with an average LOS of 18.5 days. One-year costs by mRS at discharge, presented graphically, range from approximately $20,000 for mRS 1 to >$200,000 for mRS 5, though it is noted that these estimates were each based on data from only three patients.Reference Goeree, Blackhouse and Petrovic43 A second Canadian study by Mittman et al., 2012 calculated costs for the first year post-stroke, with stratification of patients by mRS score groupings at discharge, based on data collected in the Economic Burden of Ischemic Stroke (BURST) Study. BURST was a prospective study with a cohort of stroke patients recruited at 12 Canadian stroke centers between 2005 and 2009. Among the 232 ischemic stroke patients in the study, the average annual cost (societal perspective; 2009 CAD) was $74,353 (mRS 0–2, $48,339; mRS 3–5, $107,883).Reference Mittmann, Seung and Hill42 It is noteworthy that only 15.5% of patients in BURST were treated with a thrombolytic (% not reported in Goeree et al., 2005) and that Mittman et al. reported that indirect costs were a major contributor to total costs, being the main driver between 4 months and 1 year; as costs were not presented in a disaggregated manner, those indirect costs could not be removed from the total. Further, the mean LOS reported in both studies (i.e., 18.5 and 18.2 days, respectively) was considerably longer than observed in AcT, presumably related to changes in treatment practices over the past 1–2 decades.
Given the limitations of these sources, particularly related to the age of the data, the stroke hospitalization cost used in our base case was derived from a more recent Canadian publication by Yu et al., 2021. As noted previously, it is likely that this cost ($24,506; 2025 CAD) was an overestimate of the actual hospitalization cost of the index and/or recurrent stroke(s) since the source data included subsequent encounters in acute care during the first year.Reference Yu, Krahn and Austin37 On the other hand, since the analysis by Yu et al., 2021 was based on hospitalizations from 2008 to 2017,Reference Yu, Krahn and Austin37 and evidence from a US study suggests that stroke hospitalization costs have increased substantially over the last decade,Reference Lorio, Garcia-Rodriguez and Seifi41 the cost used in the model may also be underestimated. Further, stroke management costs by health state and time since stroke were derived based on trends observed in Australian costs used in a CEA published by Gao et al., 2020.Reference Gao, Moodie and Mitchell20 Because of these limitations, in two separate scenario analyses we reduced and increased the hospitalization cost by 50% and adjusted the stroke management costs accordingly; although the cost savings in the tenecteplase arm were reduced to $436 per patient when the hospitalization cost was lowered (and increased to $1317 when the cost was increased), the conclusion of the analysis was unchanged – alteplase was dominated by tenecteplase. Given the mean LOS was the same in the tenecteplase and alteplase arms in the AcT trial,Reference Menon, Buck and Singh13 scenario analyses applying different hospitalization costs by treatment arm were not warranted.
It is noted that older data were also used for estimating the risks of recurrent strokes.Reference Mohan, Wolfe and Rudd30 In line with observations made by these authors and supported by more recent evidence from Flach et al., 2020Reference Flach, Muruet and Wolfe32 that recurrence rates declined until the mid-2000s, a scenario analysis was conducted in which recurrent stroke risks were reduced by 50%. Interestingly, the lower recurrence rates led to modestly greater cost savings and QALY gains with tenecteplase, driven by slightly longer survival relative to alteplase; however, though tenecteplase remains a dominant treatment option, the reduction in cumulative lifetime strokes attenuated the overall incremental difference between treatments.
An additional consideration relates to the fact that our results may not be generalizable to AIS patients with previous strokes and/or higher disability. In light of the fact that the AcT trial enrolled patients from primary and comprehensive stroke centers across Canada, included a large sample size and applied pragmatic eligibility criteria encompassing all patients with AIS eligible for IV alteplase (i.e., patients were not excluded based on stroke history nor disability level), the AcT trial population was representative of routine acute stroke care in Canada and quite likely included patients with higher disability and prior strokes. However, since the trial did not present mRS data for any subgroups based on prior stroke and/or disability level, and because the parameters used in model (e.g., utility values, death hazard ratio, stroke management cost) were not explicitly derived from a subcategory of more severely affected patients, it was not possible to conduct any subgroup analyses to confirm whether or not our findings are applicable to more severe AIS subgroups.
Finally, while the base case predicts a per-patient direct medical cost saving of $877, fairly modest at the individual level, its importance becomes apparent in the context of the substantial economic burden of acute stroke care. Relative to AIS hospitalization costs, among the largest drivers of acute care spending, this corresponds to 3.6% of the cost of an index stroke hospitalization, equivalent to avoiding one index hospitalization cost for every 28 patients treated with tenecteplase.
When extrapolated to the Canadian population (approximately 56,000 AIS patients annuallyReference Holodinsky, Lindsay and Yu4), this corresponds to a theoretical maximum of roughly $49 million in annual savings if all incident AIS cases were treated with a thrombolytic. In practice, realized savings would be lower, as IV thrombolysis is administered to only a minority of patients; importantly, these savings are achieved without compromising clinical efficacy or patient safety. Beyond its economic impact, the simplified bolus administration of tenecteplase, when implemented across tens of thousands of cases, has the potential to deliver meaningful system-level efficiencies and reduce the operational burden on frontline healthcare teams nationwide.
Conclusion
In conclusion, this economic analysis represents the first Canadian CEA assessing the cost-effectiveness of tenecteplase in place of alteplase, in alignment with the CSBPR,Reference Heran, Lindsay and Gubitz6 in the treatment of AIS within 4.5 hours of symptom onset. Though all the benefits to the healthcare system related to its simplified and faster administration could not be quantified for integration in the model, results from this analysis robustly demonstrate that tenecteplase represents a cost-effective strategy compared to alteplase in the Canadian setting. Along with the accumulating clinical evidence, this economic study may be helpful in supporting decisions regarding the potential addition of tenecteplase to Canadian hospitals’ formularies and its use in place of alteplase in clinical practice.
Supplementary material
The supplementary material for this article can be found at https://doi.org/10.1017/cjn.2026.10669.
Acknowledgements
The authors thank Simon Yunger for reviewing earlier versions of this work as well as Anita Dumanski and Gregory Hunt for providing helpful insights and advice throughout the project.
Author contributions
All authors were involved in study design and interpretation of the analysis. SC programmed the model with quality assurance by DLB and MCA. All authors were involved in model estimation. SC and DLB conducted the analysis. DLB and SC wrote the initial draft of the manuscript, and all remaining co-authors critically revised the manuscript and approved the final version.
Funding statement
This study was funded by Hoffmann-La Roche Ltd., Mississauga, Ontario. Canada.
Competing interests
MCA, JZ, and CN are employed by Hoffmann-La Roche Ltd. DLB is a shareholder in Quadrant Health Economics Inc., which was contracted by Hoffmann-La Roche Ltd. to conduct this study. SC is a consultant at Quadrant Health Economics Inc. DB is a site principal investigator for several industry-sponsored clinical trials (Bayer, Boehringer Ingelheim, Servier Canada), has been on an advisory board for Hoffmann-La Roche Ltd., is co-chair of the Advisory Board for the Heart and Stroke Foundation of Canada Canadian Stroke Best Practice Guidelines and has provided unpaid advice to AstraZeneca. BKM is principal investigator of the AcT trial and has been on advisory boards for Hoffmann-La Roche Ltd. and Boehringer Ingelheim.




 Open access

