Introduction
The mass loss from the Greenland ice sheet has increased rapidly in the last two decades (Reference VelicognaVelicogna, 2009), largely due to the widespread acceleration of Greenland’s tidewater (i.e. marine-terminating) glaciers (Reference Rignot and KanagaratnamRignot and Kanagaratnam, 2006) and due to an increase in surface meltwater runoff (Reference Van den BroekeVan den Broeke and others, 2009). Reference Holland, Thomas, de Young, Ribergaard and LyberthHolland and others (2008a) hypothesized that ocean warming caused the collapse of the floating ice tongue in front of Jakobshavn Isbræ and triggered an acceleration of Greenland’s largest tidewater glacier. Yet, little is known about rates of subaqueous melting of these marine-terminating glaciers, and there are virtually no quantitative estimates of the mechanical impact of subaqueous melting on glacier dynamics. Vigorous subaqueous melting may control glacier retreat rates and the position of the grounding line, which, in turn, would control flow speeds near the terminus (Reference Nick, Vieli, Howat and JoughinNick and others, 2009).
In Alaska, Reference Motyka, Hunter, Echelmeyer and ConnorMotyka and others (2003) analyzed oceanographic data in front of LeConte Glacier to estimate a subaqueous melt rate of 12md–1 across the calving face during the summer of 2000, which represented half of the total ice mass flux through the glacier terminus. In Greenland, Reference Rignot, Koppes and VelicognaRignot and others (2010) estimated rates of subaqueous melting from three major tidewater glaciers in a similar manner, and found melt values ranging from 0.7 to 3.5 md–1 on the calving faces during the summer of 2008, which corresponded to 20–80% of the total ice volume flux to the glacier termini. These results illustrate the significance of subaqueous melting for tidewater glaciers (i.e. a significant component of mass loss) and highlight the need for more quantitative studies of ice melting and its sensitivity to both ocean and climate forcings, so that this knowledge can be included in numerical models of ice-sheet evolution.
In this study we modify an existing ocean general circulation model, the Massachusetts Institute of Technology general circulation model (MITgcm), to include the processes of subaqueous melting, by which we are referring to melting along the vertical calving face of tidewater glaciers. We apply the MITgcm to a realistic simplification of a glacial fjord in West Greenland to predict melt rates along the calving face of the glacier at the head of the fjord and how these melt rates vary with ocean thermal forcing and with subglacial freshwater discharge.
Model and Methods
Ice-front melt parameterization
The MITgcm (Reference Marshall, Hill, Perelman and AdcroftMarshall and others, 1997b, Reference Marshall, Adcroft, Hill, Perelman and Heiseya) includes a representation of freezing and melting at the near-horizontal base of floating ice shelves (Reference LoschLosch, 2008). The three-equation formulation, which is used to represent freezing and melting below floating ice shelves (e.g. Reference Holland, Jenkins and HollandHolland and others, 2008b), can also be applied to represent freezing and melting of a vertical face, because the boundary layer structures are similar (Reference WellsWells, 2008). For this study we add a new module to the MITgcm that represents the vertical ice/ocean boundary using:


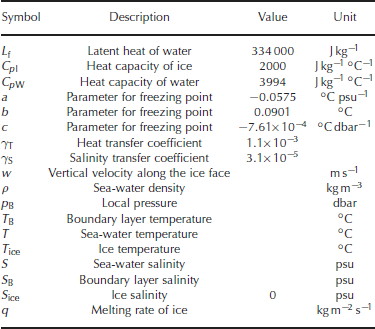
Equation (1) states that temperature at the ice/ocean boundary is at the local melting/freezing point, which is a linear function of salinity and pressure. Equation (2) is the conservation of heat, which states that the heat flux at the ice/ocean boundary brings ice or water to the melting point and melts or freezes it. Equation (3) is the conservation of salinity, which states that the boundary layer salinity balances the salinity of freezing or melting ice and the salinity of ambient sea water. The heat and salinity transfer coefficients, γ T and γ S respectively, follow the values of C d 1/2ΓT and C d 1/2ΓS in the work of Reference Jenkins, Nicholls and CorrJenkins and others (2010).Definitions of the variables used, units and parameter values are given in Table 1. Equations (1–3) are solved at the vertical ice/ocean boundary in order to obtain estimates of freezing or melting rate.

Model configuration
The MITgcm modified with subaqueous melting on vertical ice walls is applied to a simplified glacial fjord geometry. The goals are to produce model estimates of the melt rate and to test the sensitivity of the model results to ocean thermal forcing and subglacial discharge.We base our model geometry on the general configuration of the glacial fjord in front of Store Glacier (70°22′ N, 50°38′W),West Greenland, which we surveyed by boat in August 2010. The glacier is ~5 km wide at the ice front. The fjord extends 60 km westward to the open ocean and is 400–600m deep near the ice front. The location and depth of any sills in the outer fjord are unknown at this time. In our numerical experiments, the fjord is 500 m deep and 6.4 km long. Model grid spacing is 5 m in the vertical and 20 m in the horizontal along the fjord near the calving front, gradually increasing to 50m at the open ocean boundary of our domain, illustrated in Figure 1. The model configuration is two-dimensional, i.e. there is no variability in the across-fjord direction, and no Coriolis force.
Model domain for the MITgcm with the temperature (T w) and salinity (S w) forcing at the open ocean boundary (left-hand side, fjord entrance); model mesh (actual mesh is 4× denser) in the fjord; sea surface, sea floor and ice/ocean boundary (right-hand side).

We collected temperature and salinity profiles with a Seabird SBE-19 conductivity, temperature and depth (pressure) profiler 4 km from the Store Glacier front on 18 August 2010 (Fig. 1). These measurements are used as initial conditions, as well as boundary conditions, for our model. Ice temperature at the calving front is set at −2°C the temperature typically measured in outlet glaciers in coastal Greenland (Reference Thomsen and ThorningThomsen and Thorning, 1992).
The model is integrated as a free surface and non-hydrostatic configuration. Dynamic viscosity is chosen to approach minimum values to avoid gridscale noise when modeling the fastest subglacial discharge. We choose a vertical viscosity of 0.1 m2 s–1, and a horizontal biharmonic viscosity of 300 m4 s–1. Diffusivity is set to equal the viscosity to make the Prandtl number equal to one for the turbulent plume.
Subglacial discharge
We implement subglacial discharge as a flux of fresh water at the pressure-dependent melting-point temperature and inject this discharge horizontally into the ocean at the base of the vertical ice face. Specifically, the subglacial flux is fixed by the size of the subglacial channel (i.e. tunnel), where fresh water is injected at the glacier base, and the velocity of that subglacial water flow.
We use estimates of surface runoff from the Regional Atmospheric Climate Model (RACMO) (Reference EttemaEttema and others, 2009) as a proxy for the subglacial water flux, Q sg. We assume that (1) all glacier surface meltwater collects at the glacier bed upstream of the glacier terminus and (2) subglacial meltwater channels merge into a few large channels before reaching the terminus, as is commonly observed at land-terminating glaciers. At Store Glacier, Q sg may reach 500 m3 s–1 in summer and drops to ~0m3 s–1 in winter; the average discharge during the May–September melting season is 200 m3 s–1. The large seasonal variability of Q sg is consistent with observations conducted on nearby land-terminating glaciers (Reference Mernild and HasholtMernild and Hasholt, 2009). From our boat survey in August 2010, we identified at least two main channels of subglacial outflow along the north and south edges of the terminus of Store Glacier; there could be more. We therefore expect the freshwater flux from each channel to average 100 m3 s–1 from May to September, with peak values approaching 250 m3 s–1 in midsummer.
Reference RöthlisbergerRöthlisberger (1972) established a theoretical framework to estimate the size of subglacial channels in steady state by assuming that the rate of closure of the channel caused by ice deformation is balanced by the rate of opening from melting of the inner face. Here we use an ice/water pressure difference of 50 dbar, ice deformation rate of 727 bar s1/3, and channel roughness of 0.02 (Reference RöthlisbergerRöthlisberger, 1972, and references therein) to calculate a typical channel size, which we find to be ~50m2 in steady state for our average Q sg of 100 m3 s–1, and 100 m2 for our maximum Q sg of 250m3 s–1. As direct underwater observations of subglacial channel size or flow speeds are difficult to conduct and have not been done at any calving glacier termini to date, we bound the range of possible channel sizes from observations of circular or semicircular subglacial channels at the outlets of land-terminating glaciers, which are typically several meters in diameter (e.g. Reference Näslund and HassinenNäslund and Hassinen, 1996). The sizes of these channels change over timescales of several months, while the subglacial water flux, Q sg, typically changes over timescales of hours to days. Therefore, channel size can be assumed to be constant throughout the 5 day period of integration of each model run.
In order to test the influence of uncertainty in channel size on our estimates of the subaqueous melt rate, we tested three rectangular channel sizes in our model: 25 m2 (2.5m×10 m), 50m2 (5m × 10 m) and 100m2 (10m × 10 m). Within each channel, subglacial water is at the pressure-dependent melting point (−0.28°C), with zero salinity. The speed of the flow in the subglacial channel is varied from 0 to 4ms–1, which changes subglacial water flux, Q sg. The added water flux from the subglacial channel is removed evenly at all depths along the open ocean boundary at the distal end of the fjord to avoid having excess water build up in the fjord.
Sensitivity analyses
In a first set of experiments designed to test the influence of subglacial discharge, we keep the temperature and salinity profile at the ocean boundary constant and only vary the subglacial water flux, Q sg. Each sensitivity experiment is initialized with the temperature and salinity profiles collected in 2010 and shown in Figure 1 (left panel). In a second set of experiments, we keep the subglacial water flux and the ocean salinity constant, and linearly vary the deviation of ocean temperature from the in situ pressure-melting point from 0 to 8°C, as shown in the inset in Figure 4. We run each ocean-warming experiment with a subglacial channel size of 50 m2 and with three values of subglacial discharge corresponding to 0.5, 5 and 25 m3 s–1. The ocean-warming experiments are initialized with the temperature profiles shown in the inset of Figure 4. Each sensitivity experiment is integrated for 5 days, until it reaches a quasi-equilibrium indicated by a stable melt rate and ocean circulation.
Results
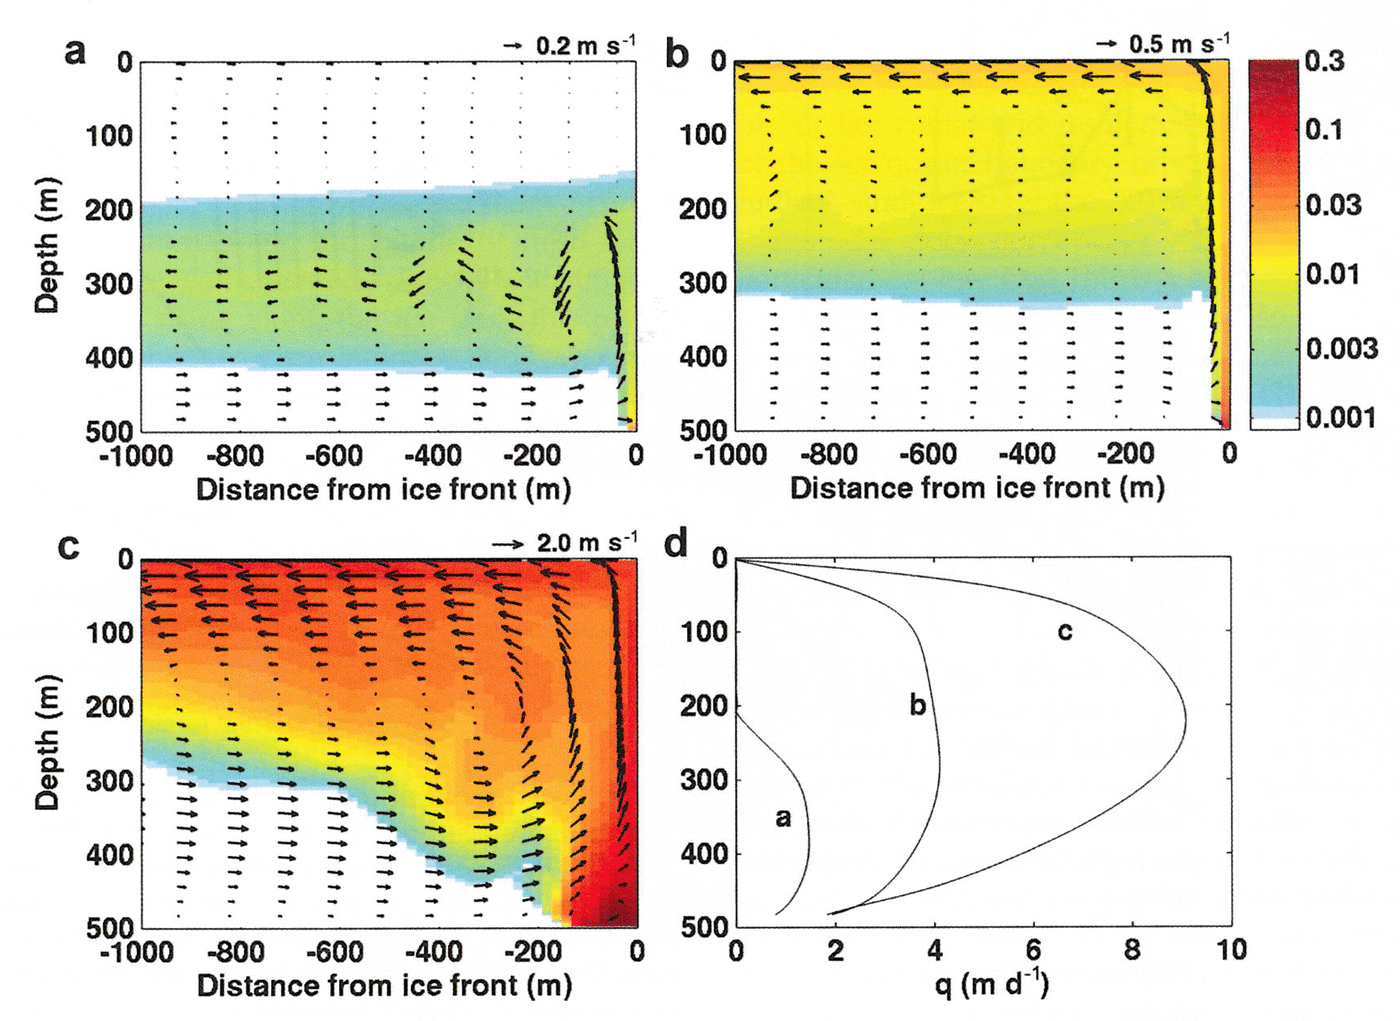
When subglacial discharge is near zero, the model generates little convection in front of the glacier and the melt rate is very low. As soon as a small amount of subglacial discharge is added (Fig. 2a), freshwater rises along the ice/ocean interface and drives bottom ocean water to flow toward the ice face. Fresh water from melted ice and subglacial discharge mixes with the ambient sea water before flowing away from the ice face at some intermediate depth in a stratified ocean. Subaqueous ice melting takes place at depths below 200 m, where upwelling is present at the ice front (Fig. 2d). As Q sg increases, upwelling along the ice/ocean interface increases in speed and reaches shallower depths below the ocean surface. This upwelling drives stronger ocean circulation, manifested by a larger volume of sea water entrained toward the ice and by higher flow speeds. When Q sg approaches ~5m3 s–1 (Fig. 2b), upwelling forces fresh water all the way to the ocean surface and this water subsequently flows away from the ice along the ocean surface. The calculated melt rate averages ~4md–1 at all depths, except near the top and the bottom of the ice face (Fig. 2d). When Q sg increases to 150 m3 s–1, which corresponds to a flow speed in the subglacial channel of 3 ms–1, the freshwater plume moves horizontally off the ice face near the ocean bottom for ~100m, mixes with ambient sea water, and forms a broad, rising plume (Fig. 2c). The maximum melt rate in this instance occurs at mid-depths and approaches 9 md–1 (Fig. 2d).
Modeled ocean circulation in front of the glacier for a subglacial flux, Q sg, of (a) 0.5 ms–1, (b) 5 ms–1 and (c) 150 ms–1, overlaid on the mixing ratio in volume of subglacial water vs sea water, color-coded from white (zero) to brown (0.3). (d) The water-equivalent melt rate, q (m d–1), vs depth along the ice/ocean interface for cases (a), (b) and (c). Arrows represent the water velocity.
When we compile the results obtained by varying Q sg from 0 to 250 m3 s–1 (Fig. 3), we find that the depth-averaged melt rate increases with Q sg in a nonlinear fashion. A reasonable fit is obtained with a power law of ~1/3 for low subglacial fluxes, consistent with Reference JenkinsJenkins (2011), who used a simplified one-dimensional convection-driven plume model and found the cube-root dependence of subaqueous melt rate on the subglacial discharge. Increasing or decreasing the horizontal viscosity by a factor of three changes the calculated melt rates by <10%, as indicated by the error bars on the results, using a channel size of 50 m2, in Figure 3.
Depth-averaged melt rate of the ice front, q (mw.e. d–1), and subglacial flux, Q sg (m3 s–1), for subglacial channels of various sizes. Error bars using the 50 m2 channel size scenario were derived by varying the horizontal viscosity from 100 to 900 m4 s–1 (except for when Q sg > 150m3 s–1, where the minimum viscosity is limited to 300 m4 s–1). At high subglacial fluxes, when subglacial flow speeds exceed 2 ms–1, the melt rate decreases.

In Figure 3, we also compare the results using the three different sizes of subglacial channels. For low values of Q sg, all three curves have a similar shape, which suggests that the melt rate is not sensitive to channel size or flow speed when the subglacial flux is low. As Q sg increases to 50 m3 s–1, the results using the smallest channel size (25m2) start to diverge. With a smaller channel size, and therefore a higher subglacial flow speed at a constant flux, subglacial water tends to move horizontally away from the ice face near the ocean bottom when Q sg > 50m3 s–1, and melting becomes less efficient. With a larger channel size, this saturation point for the melt rate occurs at higher values of subglacial flux (e.g. melting becomes less efficient when Q sg exceeds 125 m3 s –1 for a 50 m2 channel). In our second set of ocean-warming experiments, we linearly increase the ocean temperature from the in situ freezing point of sea water to 8°C above the freezing point (Fig. 4). This is a direct measure of ocean thermal forcing, which we define as the difference between the ambient ocean temperature, T w, and the pressure-dependent melting point of sea water, T f . The results, shown in Figure 4, indicate that no subaqueous melting occurs when the thermal forcing is zero, and melting increases linearly as ocean thermal forcing increases.
Depth-averaged melt rate of the ice front, q (mw.e. d–1), and depth-averaged ocean thermal forcing, T F (°C), where T F = T w − T f (T w is ocean temperature, T f is sea-water freezing point), for subglacial fluxes, Q sg, of 0.5, 5 and 50 m3 s–1. Inset plot shows the change in ocean temperature, T w, vs depth for different model runs. T F = 0 in the initial run (leftmost profile) and is increased in 1°C increments for each subsequent run.

Discussion
Our model experiments indicate that subglacial discharge plays an important role in ocean circulation near the glacier calving front, and in determining the rate of subaqueous melting of the glacier calving face. In winter, when subglacial discharge is negligible, the model predicts very low melt rates. This is consistent the observations of Reference Walters, Josberger and DriedgerWalters and others (1988) during winter at Columbia Glacier, Alaska. We are not aware of any other studies at glacier termini that measured ice-front melting in winter. During late spring, summer and early fall, when subglacial discharge is significant, our model suggests that subaqueous melting rapidly becomes a substantial component of overall ice mass loss. The melt rates observed (Reference Rignot, Koppes and VelicognaRignot and others, 2010) and simulated (this paper) range from one to several meters per day for Greenland’s tidewater glaciers.
We find a sub-linear dependence of the melt rate on the subglacial flux, where the melt rate does not increase as rapidly as the subglacial discharge. In our simulations with a fixed channel size, we also find a ‘saturation’ point for melt rates when the subglacial water flow speed exceeds a certain value. At this saturation point, the plume of fresh water ‘detaches’ from the ice wall and mixes directly with ambient sea water instead of rising along the ice face; this results in less upwelling at the ice/ocean interface and lower melt rates. Given that we do not have any direct measurements of the size of subglacial outflow channels or the speed of subglacial water flow from any tidewater glacier, let alone any seasonal measurements of ice-front melting, we cannot confirm whether such a saturation point is ever reached during the summer months in reality.
An interesting corollary to the dependence of subaqueous melting on subglacial discharge is that an increase in surface runoff production in Greenland would result in an increase in ocean-forced melting of the calving faces of the glaciers. It is therefore possible that the enhanced runoff experienced by the Greenland ice sheet in the last two decades may have indirectly impacted the stability of ice fronts in Greenland by enhancing subaqueous melt rates.
As revealed in our model, most of the buoyant freshwater plumes rise right along the ice face. Several lines of evidence provide support for this model result. One is a common observation of a significant rise in sea surface height (as high as 1 m) at the calving fronts of marine-terminating glaciers (personal communication from R. Motyka, 2011). This is a robust and repeating feature in our model results. A second line of evidence is the presence of pronounced fluting on the vertical ice face, which is observed in overturned icebergs (personal communication from R. Motyka, 2011). This fluting pattern is consistent with a spatial pattern of buoyant fresh water rising along the submerged ice face and melting the ice along vertically oriented preferential paths incised into the ice face.
Reference StraneoStraneo and others (2011) observe two distinct layers of fresh water near the surface and at 200m depth near the front of Helheim Glacier, East Greenland. This is also a feature that can be explained by our model results, where not all the fresh water resulting from melting of the ice face reaches the ocean surface. Instead, a portion of the meltwater approaches an equilibrium in density with ambient sea water at some intermediate depth in the fjord. Depending on the flow speed, the outflow of subglacial fresh water from the glacier can emerge along the ice front, mix with ambient water at some intermediate depth, and/or reach the surface at a distance from the ice front. In reality, the distribution of subglacial discharge is likely more complex than assumed in our model, and we would expect to find a mixed regime of fresh water and sea water stabilizing at a variety of depths in the fjord.
We also find that the melt rate increases linearly with ocean warming, a conclusion also reached by Reference JenkinsJenkins (2011) using a convection-driven plume model. We believe this linear dependence of melt on ocean forcing is robust, because the flow speed of fresh water along the ice face does not increase in proportion to the ocean thermal forcing; if it did, we would expect the relationship between thermal forcing and melt rates to be quadratic.
These results are robust, no matter which values of horizontal viscosity and diffusivity are applied in the model; the melt rates changed by <10% when the viscosity and diffusivity parameters were varied by a factor of three. However, some residual uncertainties related to the selection of our horizontal grid resolution and the parameterization of the ice/ocean boundary processes remain, that require further study. Using the 20m horizontal grid spacing, the model does not always resolve convective plumes, particularly at low Q sg. This is a common attribute of ocean circulation models. To test this, we also ran the model with a 10× finer horizontal resolution, i.e. at 2m horizontal resolution. In so doing, we found that (1) the general pattern of ocean circulation remained unchanged, i.e. the grid spacing does not affect the speed when the plume detaches from the ice wall; (2) at 2 m grid spacing, we were able to resolve the plume (i.e. it is seen spreading over several gridcells) at high Q sg but not at very low Q sg; (3) the melt rate increased by 39–75%, or 60% on average; however (4) the melt rate displayed the same cubic-root dependence on the subglacial flux.
In all our sensitivity experiments, we use the velocity, temperature and salinity results from the first gridcell next to the ice face to calculate the melt rate. The parameterization values we used for the heat and salt transfer coefficients, γ T and γ S, in Eqns (1–3) are the same as those calculated by Reference Jenkins, Nicholls and CorrJenkins and others (2010), which were obtained based on observations under horizontal ice shelves, with a velocity measured at 20 m and a temperature measured at 1.9 m from the bottom of the ice shelf. We employ the same transfer parameters in all our numerical experiments, regardless of the width of the first gridcell adjacent to the vertical ice face, although we expect that decreasing the horizontal grid spacing would produce higher melting rates. In the absence of direct measurements of ice melt to compare with our model, we decided not to adjust these parameters. While this could be a significant source of uncertainty in our model results, we note that our simulations suggest that the choice of heat and salt transfer parameters does not affect the nature of the relationship between melt rates and subglacial discharge, nor between melt rates and ocean thermal forcing, which is the focus of this study.
We note that, for simplicity, several other factors of potential importance have not been considered in this study. One potential contributing factor is ocean tides, since tidal currents may affect the ventilation of the ice cavity (Reference StraneoStraneo and others, 2010). Another potential factor is winds, particularly katabatic winds that could affect the motion of the surface waters in front of the glaciers and within the fjords. Similarly, we did not investigate the impact of fjord bathymetry or the presence of sills. Most importantly, our model is two-dimensional, whereas melting at the ice/ocean boundary is expected to be three-dimensional, due to turbulence of the freshwater plumes, the injection of subglacial discharge along the ice face at discrete locations, and the presence of ocean eddies near the ice face. All these aspects will be addressed and evaluated in future studies.
Conclusion
In this study, we modified the MITgcm to include ice melting along the vertical face of a marine-terminating glacier forced by the discharge of subglacial fresh water at the glacier base. The model reveals important features about the pattern of ocean circulation in front of the glacier, the rates of subaqueous melting that might be expected, and how this melt rate depends on subglacial discharge and ocean temperature. The model indicates (1) high rates of subaqueous melting (meters per day) in the summer months, (2) negligible melting in winter, (3) a cube-root dependence on subglacial discharge and (4) a linear dependence on ocean thermal forcing. These results, combined with the recent study of Reference JenkinsJenkins (2011), help provide first-order constraints on how a warmer climate and warmer ocean may affect the melting of calving fronts of tidewater glaciers and, in turn, affect the grounding-line stability and flow speeds of these outlet glaciers, with repercussions for the stability of the Greenland ice sheet as a whole.
Acknowledgements
This work was performed at the Department of Earth System Science, University of California, Irvine, and the California Institute of Technology Jet Propulsion Laboratory under a contract with the National Aeronautics and Space Administration Cryosphere Science Program. We thank M. van den Broeke for RACMO data. We also thank T. and C. Jensen for their assistance in data collection in Greenland in 2010.