Introduction
In Brazil, the modern era of Amazon frontier expansion began during the military government (1964–1985) with the introduction of large scale colonization projects focused on agriculture, mineral extraction and wide-ranging human settlement (de Castro et al., Reference de Castro, Monte-Mor, Sawyer and Singer2006). Settlements in the Amazon begin by clearing and cultivating lands. Combined with poor living conditions, this exposes settlers to a high risk of anopheline bites and malaria. The re-emergence of malaria in tropical regions with rapid population growth through agricultural colonization projects has been referred to as frontier malaria (Sawyer, Reference Sawyer1988).
Recently, deforestation has been linked to a rise in malaria prevalence (Singer & de Castro, Reference Singer and de Castro2001; de Castro et al., Reference de Castro, Monte-Mor, Sawyer and Singer2006; Vasconcelos et al., Reference Vasconcelos, Novo and Donalisio2006; Vittor et al., Reference Vittor, Gilman, Tielsch, Glass, Shields, Lozano, Cancino and Patz2006; Olson et al., Reference Olson, Gangnon, Silveira and Patz2010). Increased density of Anopheles darlingi (Diptera: Culicidae) adults, the most important vector in the Amazon (Oliveira-Ferreira et al., Reference Oliveira-Ferreira, Lourenço-de-Oliveira, Teva, Deane and Ribeiro1990; Tadei & Thatcher, Reference Tadei and Thatcher2000) has been demonstrated in areas with human presence and deforestation (Vittor et al., Reference Vittor, Gilman, Tielsch, Glass, Shields, Lozano, Cancino and Patz2006; Yasuoka & Levins, Reference Yasuoka and Levins2007). Also, an increase in An. darlingi larval abundance (Vittor et al., Reference Vittor, Pan, Gilman, Tielsch, Glass, Shields, Sánchez-Lozano, Pinedo, Salas-Cobos, Flores and Patz2009) has been reported in deforested areas.
Anopheles darlingi is a typical riverine species (Hudson, Reference Hudson1984; Rozendaal, Reference Rozendaal1990) associated with lowland rainforest, and it has been reported to be only captured <1 km away from rivers (Roberts et al., Reference Roberts, Manguin, Harbach, Woodruff, Rejmankova, Polanco and Wullschleger1996). This reflects the marked dependence on water habitats for their survival and propagation. Malaria transmission in frontier zones appears to be epidemiologically distinct from alluvial malaria (Sawyer, Reference Sawyer1988; Gil et al., Reference Gil, Alves, Zieler, Salcedo, Durlacher, Cunha, Tada, Camargo, Camargo and Pereira da Silva2003; Barros et al., Reference Barros, Honório and Arruda2011). In frontier zones, the absence of large rivers and seasonal flooding mean that larval habitats are relatively scarce. Vector breeding is dependent on the natural or artificially created water collections and less dependent on the level of the water table. Although there have been a few reports on the larval habitats of An. darlingi (Moreno et al., Reference Moreno, Rubio-Palis and Acevedo2000; León et al., Reference León, Valle, Naupay, Tineo, Rosas and Palomino2003; Tineo et al., Reference Tineo, Medina, Fallaque, Chávez, Quispe, Mercado, Zevallos, León and Palomino2003; Brochero et al., Reference Brochero, Rey, Buitrago and Olano2005), the habitats in frontier zones have not been well characterized, and longitudinal variations remain poorly described. Larvae of this species are notoriously difficult to find (Manguin et al., Reference Manguin, Roberts, Andre, Rejmankova and Hakre1996), having not been found in several studies in areas where adults were present (Roberts et al., Reference Roberts, Manguin, Harbach, Woodruff, Rejmankova, Polanco and Wullschleger1996). This probably accounts for the lack of systematic studies (Roberts et al., Reference Roberts, Manguin, Rejmankova, Andre, Harbach, Vanzie, Kakre and Polanco2002).
Recently, it has been demonstrated that malaria cases in agricultural frontier zones are not evenly distributed, but clustered in high risk areas (de Castro et al., Reference de Castro, Monte-Mor, Sawyer and Singer2006; Silva et al., Reference Silva, Tadei and Santos2010). We have also reported that the distribution of malaria cases in a typical agricultural frontier zone is concentrated near specific water collections that harbor larvae of An. darlingi (Barros et al., Reference Barros, Honório and Arruda2011). We postulate that larval distribution in frontier zones is similarly not random. In this paper, we attempt to determine larval habitat parameters influencing distribution of An. darlingi larvae along a temporary river in a malarigenous frontier zone. A spatial study was performed involving both natural and deforested portions of the river in an attempt to understand if deforested sites differ in the parameters associated with An. darlingi larval occurrence. Additionally, a longitudinal study was performed to explore how changes in rainfall and river height influence larval densities.
Materials and methods
Study site and malaria distribution
The study was conducted within an agricultural frontier settlement of Rorainópolis, 300 km south of Boa Vista, the capital of the Province of Roraima, in the northern Brazilian Amazon. Climate and ecoregional characteristics of Roraima have also been previously reported (Barros et al., Reference Barros, Aguiar, Rosa-Freitas, Luitgards-Moura, Gurgel, Honório, Arruda, Tsouris and Vasconcelos2007a; Rosa-Freitas et al., Reference Rosa-Freitas, Tsouris, Peterson, Honório, Barros, Aguiar, Gurgel, Arruda, Vasconcelos and Luitgards-Moura2007). Located deep inside the rainforest, most settlements in the area are recent (<10 years) and are composed of multiple sideroads that run perpendicular to a main road, forming a characteristic fish-bone pattern. The area is flat and no mountains can be seen until the horizon. Malaria in the area is unstable and hypoendemic, predominantly due to Plasmodium vivax (Chaves & Rodrigues, Reference Chaves and Rodrigues2000). Sideroad 19 (00°51′N, 60°21′W) was chosen due to its higher malaria endemicity, in comparison with neighboring sideroads (Rorainópolis, Municipal Health Service, data not shown).
The construction of roads, performed from the feeding artery into the forest, may take months or years to be completed, even though the National Institute for Colonization and Agricultural Reform (INCRA) has already designated land lots for each family. Many arriving settlers spend time in town and only move to their lands when the roads have reached them. The result is that newcomers to the sideroads are usually further away from the feeding artery (the beginning of the sideroad) than settlers that arrived earlier. Migration into the land lots usually occurs definitively during the dry season (November or December to March or May) to perform forest clearing. Consequently, deforestation tends to be concentrated in areas further away from the feeding artery. Slash-and-burn agriculture is practiced in the area mainly for planting dry rice fields and manioc. In Sideroad 19, at the time of study, deforestation was occurring only from the ninth kilometer onwards, where large fields were being cleared (fig. 1). After being cut, trees and bushes are left to dry for a few weeks before they are burnt. Although government environmental laws state that gallery forests must be left untouched, this is usually not respected.
(a) The study site involved an agricultural settlement in Rorainopolis district, Roraima, Brazil. (b) Detail of the settlement, demonstrating Sideroad 19, and showing the fishbone pattern and arrangement of houses (top). Neighboring side roads are approximately 3 km apart. The lines outline the area where deforestation was occurring at the time of the study. Dots represent the houses where malaria cases were reported from January 2002 to December 2004 (one dot equals five cases).

Sideroad 19 is a typical secondary road composed of 66 inhabited houses. Residences are spaced at 300-m intervals and lined up near the sideroad. The sideroad branches perpendicularly from the main road for 18.8 km into the rainforest (fig. 1). A total of 33 cases were diagnosed during the one year of observation, which corresponds to an annual parasitological index (API, malaria cases per 1000 persons per year) of 99. To explore seasonal incidences and spatial distribution, the number of cases from January 2002 to December 2004 was analyzed. The highest density of malaria cases in Sideroad 19 was in the houses near a location where a river crossed the sideroad (Barros et al., Reference Barros, Honório and Arruda2011). Of the 186 malaria cases reported, approximately 117 (57%) of them were located from the 12th to the 14th kilometer, as indicated in fig. 1. The number of malaria cases per month in this area is shown in fig. 2. The 11 houses in which the majority of these cases occurred are the ones shown in fig. 3.
Number of cases per month of symptomatic thick-smear positive malaria in 11 houses of Sideroad 19, from January 2002 to December 2004, and log density of An. darlingi adult mosquitoes captured in these houses on six occasions, from August 2003 to July 2004 (▪, Number of malaria cases; □, Log Mosquito density).

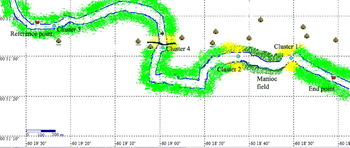
Spatial distribution of A. darlingi larvae in the Azul River1. The locations where significant larval clusters were found are indicated by blue circles. Cluster 1 is the most likely cluster. Primary vegetation is indicated by dark grey and forest fringes by light grey. The black line represents the bridge. The position of the manioc field and of houses are indicated. The size of the river has been exaggerated for increased clarity. 1The site where the staff gage was placed for measuring river height is indicated by the asterisk (*). The three underlined houses were the sites where An. darlingi adult densities were sampled.

A well-defined six-month-long dry period lasts from November to April, with 55–60% of the precipitation occurring from May to July (Furley, Reference Furley1994). Mean temperatures were 28.5°C, and relative humidity was around 88%, with little yearlong variation.
Data on malaria case distribution in Sideroad 19 and more methodological human and entomological sampling details have been reported (Barros et al., Reference Barros, Arruda, Vasconcelos, Luitgards-Moura, Confalonieri, Rosa-Freitas, Tsouris, Lima-Camara and Honório2007b, Reference Barros, Honório and Arruda2011).
Terrain topography and hidrology of the Azul River
Located 110 m above sea level, the area is more than a 100 km from large rivers, such as the Branco River (>100 m wide), the largest river in Roraima Province and approximately 30 km away from the nearest medium-sized river, the Anauá River (50–80 m wide). Although there are many streams (<4 m wide) in the area, the Azul River is the only small temporary river (5–15 m wide) along the sideroad. It intersects Sideroad 19 at the 13th kilometer as it winds its way northeast towards the Anuá River. The river also crosses other sideroads. There are no swamps in the area, but transient flooding occurs near (<10 m) the margins of the Azul River. It measured up to 14 m wide in August, but became reduced to multiple pools approximately 3–5 m wide and 5–20 m long from November to May. The flow of the river is not entirely continuous but is blocked, partially or totally, in various areas by fallen tree trunks and branches. Terrain was rocky and irregular at one locality, in a manioc field, creating pools of variable size. Tree trunks were large and some are up to 1.5 m in diameter. Most of the flow obstructions in the river were associated with barriers 0.5 m high, although this was not systematically quantified.
Entomological studies: general larval sampling presumptions and methods
Larval and adult collections were conducted during six bimestrial collecting excursions from August 2003 to July 2004, including November 2003, January 2004, March 2004 and May 2004. Larval surveys were performed using a 0.5-liter dipper (Bioquip Co., Gardena, CA, USA) (Service, Reference Service1991). Based on the empirical knowledge of our team, the following presumptions were made for larval sampling studies: Nyssorhynchus larvae are randomly distributed in a water collection and are not retrieved from perimeters without bordering vegetation or floating debris. Larvae are also not retrieved from the open water, at the middle of the river or temporary pool. Therefore, perimeters with emerging vegetation, algae or surface debris were searched more extensively. Larvae collected from different portions of the same larval habitat were kept in separate containers. Pupae and first/second instar larvae were reared for identification.
Entomological studies: adult captures
Adult mosquitoes were captured while landing by one collector positioned in each of the peridomicilliary areas of the three houses underlined in fig. 3. Captures were performed on four consecutive nights of each collection period, when collectors exposed their arms and legs and mouth-aspirated landing mosquitoes. Larvae were taken to the field laboratory in breeding site water. Adult mosquitoes and larvae were identified using the key from Consoli & Lourenço-de-Oliveira (Reference Consoli and Lourenço-de-Oliveira1994) and Gorham et al. (Reference Gorham, Stojanovic and Scott1973).
Spatial study of larval habitats in the Azul River: exploratory analysis
Identification of larval habitats in the entire Azul River was performed by one continuous exploratory sampling study performed in May 2003. During the same day, larvae were collected in separate vials and identified. At that moment, the river was composed of multiple pools, with a mean size of 10 m each. Most of these pools were connected by small streaks of water. Larval sampling was performed along the Azul River from 0°51′55.4″N 60°25′49.7″W (reference point), under primary forest, to 0°51′37.8″N 60°17′39.0″W, end point, also under primary forest. Between these two coordinates, the river crosses a manioc field which is approximately 250 m wide. This field had been progressively created through deforestation for 2–3 years before the time of study.
The positions of each dip were determined and maps were developed from global positioning system (GPS) coordinates of the position of the larval habitats. One dip was performed at approximately every two meters, on the same side of the river, in the upriver direction (southeast) and approximately 2000 m were covered, comprising 1000 dips. In approximately 5% of sites, samples were not taken because of lack of water collections. Since the resolution of available GPS devices was below that required for spatial mapping of dips in the river, the approximate location of each sample was determined by GPS coordinates taken every 20 m and coordinates of samples between these points were determined using ArcGIS 8.0. The arbitrarily fixed reference point was considered 0 m, and the distances from that point to samples taken along the river were determined. Cartesian coordinates were determined, transforming the data into a linear metered Cartesian model and imported into SatScan version 9.1, a spatial statistical analysis software. A purely spatial scan, the Kulldorff statistical analysis, was used to test whether larvae were randomly distributed along the river and to identify significant spatial clusters if present (Kulldorf & Nagarwalla, Reference Kulldorff and Nagarwalla1995). Clusters with high likelihood rates were analyzed using the Bernoulli model implemented in the SatScan software (Kulldorf, Reference Kulldorff1997). This program creates circular windows that are moved systematically throughout the geographic space to identify significant clusters of infections. The windows are centered on each of the sample locations, with the maximum window size set to include 50% of the dip locations (i.e. the largest possible cluster would encompass 50% of the population at risk). For each location and size of the scanning window, SatScan performs a likelihood ratio test to evaluate whether infections are more prevalent within that specific circular window as compared with the outside. The sequential Monte Carlo procedure was used to terminate calculations and P-values were determined using 100,000 Monte Carlo replications of the data set, and a level of significance of 5% was adopted. The P-values were adjusted for the multiple testing stemming from the multitude of circles/cylinders corresponding to different spatial and/or temporal locations and sizes of potential clusters evaluated. This means that, under the null-hypothesis of complete spatial randomness, there is a 5% chance that the P-value for the most likely cluster will be smaller than 0.05 and a 95% chance that it will be bigger.
Associated parameters and temporal distribution of An. darlingi larvae: general description
Longitudinal studies were performed in 20 locations in the Azul River. All sites were located within 2000 m of the exploratory study. Sampled larval habitats were composed of separate pools in November, January, March and May. In August and July, the river was one continuous body of water. Four sites (20%) were at the Azul River, inside primary forest; two locations (10%) were small streams inside the forest that were affluents to the Azul River, also under primary forest; five sites (25%) were forest fringes between forested and deforested areas; and nine (45%) were in deforested areas. The forest fringes studied included the three zones where An. darlingi larvae clusters were found, as well as a portion of a field, adjacent to one of the forest fringes, where a few trees were still standing and secondary growth was present.
Larval habitat parameters studied
In the sites sampled longitudinally, the following 11 physicochemical and environmental parameters were determined for each site: seasonality, type of bordering vegetation, overhead vegetation, light incidence, soil type at the bottom, current, width, depth, pH, the distance to the nearest house and the degree of obstruction to flow. Also, larval habitats were classified as to the area where they occurred, i.e. deforested, primary forest or forest fringe. Parameters were determined twice during the study period, in August 2003 and March 2004. The observed values were grouped into those parameters representative of the dry season (March) and those representing the wet season (August). They will be referred to accordingly in the rest of the text.
The parameter ‘seasonality’ was used to describe if the larval habitat dries out completely during the dry season (temporary) or if not (permanent). Bordering vegetation was classified as leaflitter or grasses. Overhead vegetation was classified as primary forest, secondary growth or no cover. Shade was quantified by measuring the amount of reflected light at the sites where larvae were retrieved, as measured by a reflected light meter (Nikon™). Data was transformed into average scene luminance, in candela m–2 (cd m–2) using the reflected light exposure equation:  , where k=the reflected-light meter calibration constant (12.5 for Nikon™ reflected light meters); N=the relative aperture (f-number); S=the ISO arithmetic speed (ISO=100 was routinely used); and t=exposure time (shutter speed) in seconds. Luminance was ranked into three categories: well shaded or decreased luminance (<20 cd m−2, typically <10 cd m−2); moderately shaded or moderate luminance (20–100 cd m−2, typically 30–60 cd m−2); and exposed or high luminance (>100 cd m−2, typically 400–500 cd m−2), according to the amount of light on the surface of the water on sunny days, always during the morning (from 8 am to 10 am). Reflected light on the entire water surface of the pool was not evaluated. Larval habitats that presented decreased luminance were associated with overhead and lateral vegetation, near the water surface, covering more than 3–4 steradians (>50–60%) of the area above the site of collection (a hemisphere has approximately 6.28 steradians). These sites will be referred to as ‘shaded’. Sites located inside primary forest were considered shaded. Sites with high luminance lacked overhead cover or were associated with little cover, i.e. less than one steradian of cover (<20%) near the surface and at the sides, usually lacking overhead cover. These sites will be referred to as ‘exposed’. Breeding sites with moderate luminance had approximately 1–3 steradians (20–50%) of overhead cover and were not directly exposed to sunlight, although the water surface was not dark during a sunny day. The soil type at the bottom was classified into mud, soft sand and hard sand. Current was visually estimated by evaluating the movement of floating debris at the site where larvae were collected and classified as present or absent. The presence of current in the vicinity of the collection sites was not evaluated. The depth and width of water bodies at the end of the wet season (November) were measured by metered rods or estimated by GPS coordinates. pH was determined by colored dipsticks (Merck™). The distance to the nearest house was estimated by GPS mapping, using the site where larvae retrieved were within the larval habitat and not the nearest border of the water collection. Since larvae were repeatedly sampled at the same spots of the breeding sites, variations between wet and dry seasons in distances to the nearest dwelling were considered insignificant. Obstruction to river flow was graded into three categories: little (mean number of 0.2 per 10 m), moderate (mean number of two per 10 m) and high (mean number of three per 10 m). Obstructions were usually secondary to large tree trunks and branches that had fallen into the river bed.
Principal components analysis for associating breeding site parameters with occurrence of larvae
To reduce the number of total variables and to obtain uncorrelated descriptors of the measured parameters, we used principal component analysis based on covariances between the variables (PCA and Classification module, Statistica™, version 6.0). Principal component analysis (PCA) involves a mathematical procedure that transforms a number of possibly correlated variables into a number of uncorrelated variables called principal components. This transformation is performed in such a way that the first principal component has as high a variance as possible (that is, it accounts for as much of the variability in the data as possible), and each succeeding component in turn has the highest variance possible under the constraint that it be orthogonal to the preceding components. Principal components (PCs) were verified if they occurred before the leveling off in the continuous drop of values, as assessed on the scree plot (Cattell, Reference Cattell, Banks and Broadhurst1966). Only PCs with Eigen values >1.0 were retained for further analysis, whereas those with values <1.0 were ignored (Hatcher & Stepanski, Reference Hatcher and Stepanski1994). However, if PCs >1.0 occurred below the cutoff point in the scree plot, and thus contributed little for the overall variation, they were excluded. Principal component analysis was performed using the number of An. darlingi larvae retrieved from November to May, as the grouping variable and the predictor variables were the breeding site parameters observed in the dry season. Data from four collections were grouped to obtain a single dependant variable, resulting in a larger sample size for each site, increasing larval numbers, as compared to analyzing each collection separately. The larvae of An. darlingi collected from November to May were considered together as representative of the dry season and, from now on, will be referred to accordingly. May was grouped as a ‘dry season’ collection because the larval survey was performed during the beginning of the month, when gage height was still low, few heavy rains had occurred and the characteristic dry season pooling of the river was still evident.
We analyzed the PCs by multiple regression with the number of larvae per site, during the dry season, as the dependant variable, using the generalized linear multiple regression module of Statistica™ version 6.0 (StatSoft, Inc., Tulsa, OK, USA). Also, a forward multiple regression was performed with the four PCs to confirm the model. Variables to be included in the model were required to produce significant changes in adjusted R-square, as well as significant F-statistics and t-tests. For all multiple regression analyses, the most important variables contributing to the regression model were determined by significant F-statistics and t-tests for standardized regression coefficients (Iles, Reference Iles and Fry1993). Residual and influential analyses were performed.
Non-parametric tests (Mann-Whitney U tests, Spearman rank correlation), Fisher's exact test and ANOVA
Only one principal component was significantly associated with the occurrence of An. darlingi larvae, and the variables associated with the highest factor loadings in this PC were further explored through nonparametric tests and Fisher's exact test. Continuous variables were studied with two-tailed Mann-Whitney U tests using a binomial grouping variable to compare differences between An. darlingi negative sites to positive sites. Any site where An. darlingi was retrieved at least once during the six collections was considered a positive site. Two-tailed Spearman rank correlation tests were used to study the association of breeding site parameters with the number of larvae of An. darlingi encountered. Fisher's exact test was used for analyzing the dichotomous categorical variables seasonality and the presence of current, using a 2×2 table to compare differences between An. darlingi negative sites to positive sites. The trichotomous categorical predictor's soil type and degree of obstruction were studied using one-way analysis of variance (ANOVA) of the log (n+1) of the number of An. darlingi larvae encountered per site during the dry season. Log transformations were performed when necessary for meeting assumptions on the normal distribution of residuals. A one-way ANOVA of the log (n+1) of larvae of An. darlingi VS degree of luminance was performed. Separate analyses were performed for deforested and forested sites. Statistical significance levels (P<α) for multiple testing were adjusted using Bonferroni correction for multiple comparisons, to account for experiment-wise type I error, as follows: corrected α=0.05 k −1, where k=number of comparisons (Holm, Reference Holm1979).
To test the relative importance of each variable, a generalized linear regression model was performed using the log (n+1) of An. darlingi larvae collected in all breeding sites in the dry season as the predictor variable and the seven parameters retained from the PC analysis (distance to the nearest house, current, pH, flow obstruction, width, seasonality and type of soil) as the predictor variables.
Spatial study: forward stepwise multiple regressions
To explore the association of sites with differing vegetation cover (deforested, primary forest and forest fringe) with breeding site parameters, each category was separately studied with forward stepwise multiple regression. The number of An. darlingi larvae collected in the dry season was the dependant variable. Independent variables were breeding site parameters. All parameters were used in the model, except when they had to be excluded for lack of variance. The distance to houses and depth were treated as continuous variables, and the area of the breeding site, the type of perimeter vegetation, light incidence, seasonality, and type of overhead vegetation were treated as categorical predictors.
Longitudinal study: gage height variations and rainfall
A staff gage was placed two meters from the center of the river bed in July 2003 and was used to measure the fluctuations in river water level (gage height), in meters, until June 2004. The rod was placed in an area under primary forest, where no obstructions to river flow were present. The site is signaled in fig. 3. The value 0 m was arbitrarily defined by the gage height at the time of placement and variations were recorded by verifying the stage height once daily, at the same time of day. The lowest recordable gage height in this area was −0.8 m, which roughly corresponded to the formation of puddles in the river bed, during the dry season. The highest recordable gage height was +2 m, since the rod had a height of 2.8 m. A pluviometer was installed in the study site for daily monitoring of rainfall throughout the entire year.
Forward stepwise multiple regression of the number of times a site was found positive with An. darlingi larvae as compared to breeding site parameters in the dry season
We studied, with forward stepwise multiple regressions, the number of times each site was found positive for An. darlingi larvae. The number of times each site was positive was used as the dependent variable, and breeding site parameters determined during the dry season were the predictor variables.
Results
Adult captures
A total of 481 adult An. darlingi were captured. Mean densities were 1.98 mosquitoes per man×hour. Densities from November to May were 2.1 mosquitoes per man×hour. In August and July, densities were 1.6 mosquitoes per man×hour. The log number of mosquitoes per man×hour in each month is shown in fig. 2.
Exploratory data: spatial distribution of An. darlingi larvae along the Azul River
Anopheles darlingi larvae occurred in only 41 (4.1%) dips out of 1000 samples in the Azul River. The distribution of An. darlingi larvae along the Azul River studied using spatial cluster analysis identified four significant clusters (fig. 3). Among the four significant clusters identified, three were forest fringes.
The most likely cluster (cluster 1) was in a forest fringe around 1720 m from the reference point, at 0°51′31.1″N 60°18′29.2″W, where 20 An. darlingi larvae were identified. The area is approximately 50 m long and located in a forest-manioc field transition. The relative risk of finding larvae in this location was 44.0, with a log likelihood ratio of 68.18 (P<<0.0001). The nearest house was approximately 110 m from the larval habitat.
The second most likely cluster (cluster 2) was in the forest fringe zone around 1504 m from the reference point, at 0°51′28.9″N 60°18′43.1″W, where seven An. darlingi larvae were recovered. The relative risk of finding larvae in this location was 27.1, with a log likelihood ratio of 22.41 (P<<0.0001). This site is located at the opposite side of the manioc field from the first site. The nearest house was 80 m from the larval habitat.
Two other secondary clusters were identified under primary forest. A third site (cluster 3) was located at 104 m (0°51′38.7″N 60°19′21.8″W) and a fourth (cluster 4) at 856 m (0°51′32.5″N 60°18′57.6″W), with four and six larvae each, respectively. The relative risk of finding larvae in these locations was, respectively, 24.9, with a log likelihood ratio of 12.5 (P<0.005) and 26.29 with a log likelihood ratio of 19.1 (P<<0.0001). Cluster 3 was located where the sideroad crossed the Azul River. Although the forest was relatively preserved here, some deforestation had occurred, especially for the construction of the wooden bridge. A house was located nearby, only 30 m from the larval habitat. Cluster 4 is located under primary forest, but where the Azul River approaches the sideroad and the houses lined next to it. At this site, the river is just 130 m from the nearest inhabited house.
General results
During the longitudinal study period, 6106 dips were made in the 20 larval habitats that were longitudinally studied. Larval surveys retrieved 1080 specimens, comprising 12 species. The number and percentage of the total of each species were: An. darlingi 29.17% (n=315), An. triannulatus 31.94% (n=345), An. albitarsis 14.72% (n=159), An. oswaldoi 11.94% (n=129), An. nuneztovari 9.54% (n=103), Chagasia bonneae 2.31% (n=25), An. peryassui 0.28% (n=3). Other larvae, collected infrequently (<3 specimens) were An. mediopunctatus, An. strodei, An. mattogrossensis, An. evansae and An. kompi.
Presence of An. darlingi in larval habitats: qualitative and quantitative analysis
Larvae occurred in 55% (n=11) of sampled sites. Of these sites, nine (81.8%) were either forest fringes or deforested areas and only two (28.2%) were primary forest sites. All the transition zones studied and five out of nine (55.5%) of the deforested sites were positive for An. darlingi.
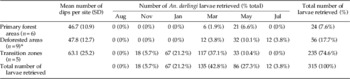
In total, 315 larvae of An. darlingi were found; 17.4% (n=55) of these larvae occurred within the nine deforested breeding sites, which gives a mean of 6.1 larvae per site per year of sampling; 80.3% (n=253) of the larvae occurred within the five transition zones areas (mean of 50.6 larvae per site per year); and 1.9% (n=6) occurred within the six primary forest areas (mean of one larva per site per year). Larvae of An. darlingi occurred in the river during the dry season with increasing frequency but were absent in the river during the peak of the rainy season (August). In November, at the beginning of the dry season, An. darlingi larvae were found in 10% (n=2) of the 20 sites sampled in the river; in January, larvae were retrieved in 20% (n=4). This figure rose to 30% (n=6) in March and to 35% in May, at the dry-wet transition. In July, the percentage of positive sites dropped again to 15% (n=3) of sampled localities.
Sampling sites were grouped into deforested, under primary forest or forest fringes. The sideroad-river crossing was considered a forest fringe since there was extensive deforestation on the edges of the river. The number of An. darlingi larvae sampled per site per month, as well as the mean number of dips at each site, is shown in table 1.
Number of An. darlingi larvae in the Azul River. The 20 larval habitats sampled are grouped into three categories based on their location relative to deforestation.

* In March, total number of deforested sites was seven because two sites were dry.
During the wet season, only three sites were found positive and, presumably due to the low number of larvae found, statistical tests failed to demonstrate any associations. Therefore, only data from the dry season will be presented and statistically studied.
Exploratory analysis for overall distribution model: PC study
Significant correlations were detected among (9%) of the measured parameters. PC analysis reduced the number of variables from 12 to four. Retained PC1 to 4 had the following Eigen values: 4.2, 3.3, 1.5 and 1.0. The proportions of variances explained by each component was 35.5%, 27.6%, 12.9% and 8.4%, which means the four retained PCs would explain 84.5% of the deviance observed. PC5, which was excluded, along with the others, had an Eigen value of 0.82 and explained 6.8%. PC6 to 12 had lower Eigen values and explained 3.9% to lesser amounts of the variance.
A generalized linear multiple regression model of the four retained PCs revealed a significant association of only PC2 (P<0.05) with the number of An. darlingi larvae found in the dry season. Beta coefficients (β) for factors 1–4 were, respectively, 0.12 (SE=0.21), 0.52 (0.21), −0.01 (0.21) and 0.09 (0.21), and overall R2=0.29, F(4,15)=1.59 P=0.22. Forward stepwise multiple regression of the four retained PCs confirmed the association of only PC2 with An. darlingi numbers collected in the dry season (R2=0.27; F(1,18)=6.70; β=0.52, SE β=0.20; B=0.52; P<0.05).
The most important factor loadings for PC2, in decreasing order of importance, were the following: −0.82 for the distance to the nearest house; −0.69 for current; 0.68 for pH; 0.67 for flow obstruction, 0.61 for width, 0.58 for seasonality and −0.56 for the type of soil. Other parameters had factor loadings of only −0.34 (light incidence) and lower and were not considered in the overall model.
Testing the association of variables in PC2 with presence of An. darlingi larvae
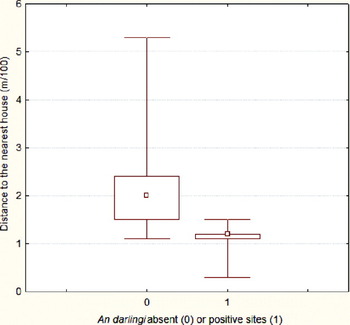
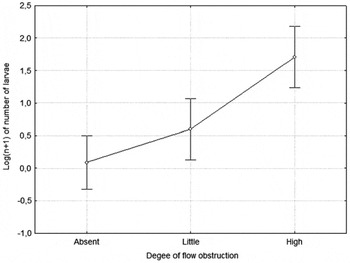
The number of larvae encountered in each site was also associated with the distance to the nearest house by Spearman rank correlation (r=−0.68; Bonferroni adjusted P<0.005). Negative values denote that the greater the distance to houses, the fewer larvae were retrieved. A box-and-whisker plot of the distance to the nearest inhabited house in negative and positive An. darlingi breeding sites is shown in fig. 4. The degree of flow obstruction was similarly associated with the number of larvae retrieved in each site by Spearman rank correlation (r=0.82; Bonferroni adjusted P<0.0001). A Mann-Whitney U test demonstrated a significant difference between An. darlingi positive and negative sites (Bonferroni adjusted P<0.01). Also, a binomial covariate denoting the presence of high grade flow obstructions was significantly associated with An. darlingi positive sites during the dry season by Fisher's exact test (P<0.005). The mean log (n+1) of An. darlingi larvae collected in each site with differing degrees of flow obstruction (absent, little, high) differed significantly from each other (fig. 5).
A box-and-whisker plot analysis of positive and negative An. darlingi breeding sites along the Azul River, as related to the distance to the nearest inhabited house in Vicinal 19 ( , Median;
 , 25%–75%;
 , Min–Max).

An ANOVA of the log(n+1) number of An. darlingi larvae retrieved in the dry season in breeding sites along the Azul River. Sites differ by the degrees of water flow obstruction caused by tree trunks and branches in the river bed. Bars denote 95% confidence intervals and are centered around the means. Differences significant at F(2,17)=15.13; P<0.0005.

Fisher's exact test performed on the binomial variable current demonstrated no significant association with sites positive for An. darlingi (P=0.18). The association with permanent sites (n=12) was only marginally significant with non-adjusted P-values (P=0.06; Bonferroni adjusted P<0.1). The Mann-Whitney U test demonstrated no difference in width between An. darlingi positive and negative sites (P<0.4; Bonferroni adjusted P<1.0). Also there was no significant difference in pH by Mann-Whitney U test in An. darlingi positive and negative sites (P<0.8). The type of soil was not significantly associated with the log (n+1) of An. darlingi larvae collected in the dry season by ANOVA (F(2,17)=1.24; Bonferroni adjusted P<0.9).
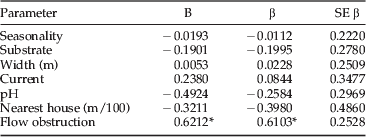
A generalized linear regression model of the occurrence of the log (n+1) of An. darlingi larvae collected in all breeding sites in the dry season, using seven parameters from PC2 (distance to the nearest house, current, pH, flow obstruction, width, seasonality and type of soil) showed that the overall most important predictor variable was the presence of flow obstructions (table 2).
Generalized linear multiple logistic regression model of the log(n+1) of Anopheles darlingi larvae retrieved in larval habitats as the dependant variable and breeding site parameters as independent predictors. Values were obtained during the dry season1.

1 Overall R2=0.82, F(7,12)=3.58; P=0.02.
* Significant P-values of parameter estimates (P<0.05).
Forward stepwise multiple regression of primary forest sites
A multiple forward stepwise regression of only the breeding sites in the primary forest gave a similar result. The number of An. darlingi larvae retrieved during the dry season was used as the grouping variable, and all breeding site parameters were the predictor variables. Only the presence of obstructions was above the significance for entering the model (F(1,9)=6.45; 0.41; P<0.05; β=0.64; SE β=1.46). The variables overhead vegetation and area of occurrence were removed from the model because of lack of variance.
Forward stepwise multiple regression of deforested sites (dry season)
For this analysis, we evaluated only sites classified as deforested. A multiple forward stepwise regression was performed using all possible breeding site parameters as predictor variables and the number of An. darlingi larvae retrieved during the dry season as the grouping variable. Light incidence was the most significant predictor variable and the only one to be included in the regression model (β=−0.58; SE β=0.19; R=0.58; R2=0.34; F(1,18)=9.46; P<0.01). Some parameters, such as overhead vegetation, area of occurrence and current had to be removed from the model because of lack of variance.
ANOVA of the log number of larvae in deforested areas with differing luminance
An ANOVA of the log(n+1) of the number of An. darlingi larvae retrieved in shaded and exposed breeding sites of deforested areas showed a significant difference in mean number of larvae retrieved (F(1,7)=57.68; P<0.001; Bonferroni adjusted P<0.005). The same was not true for areas under primary forest and forest fringes (F(2,8)=0.79; Bonferroni adjusted P>0.8). The Mann-Whitney U test also demonstrated a significant difference in the number of An. darlingi larvae retrieved in shaded as compared to exposed sites (Bonferroni adjusted P<0.05) when all breeding sites were analyzed or only the deforested sites (Bonferroni adjusted P<0.05). However, no difference was evident when only primary forest and forest fringes were evaluated (P>0.4). Results suggest luminance is a predictor of larval distribution only in deforested sites.
Forward stepwise multiple regression of transition zones
Finally, we performed a regression only with sites classified as transition zones. A forward multiple regression analyzed all breeding site parameters as predictor variables, while the number of An. darlingi larvae retrieved during the dry season was the grouping variable. Depth was the most significant predictor variable and the only one to be included in the regression model (β=0.95; SE β=0.16; B=310; P<0.05; R=0.95; R2=0.91; F(1,3)=33.91; P<0.01). However, depth was not associated with occurrence of larvae by Spearman rank correlation (r=−0.16; Bonferroni adjusted P>1.0).
Longitudinal study: changes in breeding site parameters
Most of the parameters determined in August were the same in March, such as pH, perimeter vegetation, type of soil, etc. However, width had higher values in the wet season than the dry season: mean 14.1 m (SD=2.7 m), as compared to 6.4 m (SD=3.7 m). Depth also had higher values in the wet season than the dry season: 0.80 m (SD=0.06) as compared to 0.40 m (SD=0.03).
Longitudinal study: Azul River stage variations
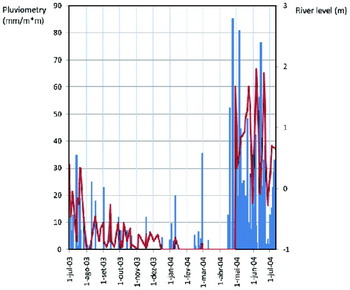
The variation of the Azul River gage height, in meters, is shown in fig. 6. Annual rainfall was 1367 mm m−2. Year-round mean gage height was 0.2 m above the reference level (SD=0.88 m), but levels differed significantly in September to April (mean 0.67 m; SD=0.7 m) as compared to May to August (mean −0.70 m; SD=0.35 m) (P<<0.0001). These periods roughly correspond to the dry and wet seasons. There were ample variations in the gage height from May to August, accounting for the increased SD. The point of zero flow, when puddles formed at the bottom of the river channel, was briefly reached in November and December, but only in January did it first become stable for more than seven days. The highest recorded level was 2.0 m, in June 2004.
Variation of the gage height of the Azul River and relation to pluviometry. The wet season corresponds approximately to the period from May to October or November, although rains are concentrated from middle May to July. The dry-wet transition is characterized by a sharp rise in water levels while, in the wet-dry transition, water levels decreased slowly ( , Pluriometry; ▬, River level).

Longitudinal study: analysis of the association of the number of times site was found positive with An. darlingi larvae with breeding site parameters
Forward stepwise multiple regression revealed the most important variable for predicting the number of times per year a breeding site would be positive for An. darlingi was the presence of obstructions to river flow (R2=0.70; F(1,18)=18.22; β=0.70; SE β=0.16; B=1.17; P<0.001). Areas with high grade flow obstruction were positive more times (up to five out of the six collections) than areas with little or no flow. Sites with no obstruction (n=8) were positive a mean of 0.12 times during the year (SD=0.35) during the study; sites with little obstruction (n=6) were positive 1.00 time during the year (SD=0.89); and sites with high obstruction (n=6) were positive 2.5 times during the year (SD=1.64). The mean number of times each type of site was positive during the year of study was significantly different by ANOVA (F(2,17)=8.98; P<0.005). All sites found positive in November (n=2) and January (n=4), and two of the three sites found positive with larvae of An. darlingi in July were associated with high grade obstructions. This means that, while sites with high grade obstruction were found positive for An. darlingi from November to July, comprising up to nine months of the year, sites with low grade obstruction would tend to be positive only in March and/or May, for a total of only one to three months.
Discussion
Spatial clustering of larvae at forest fringes
We observed a concentration of An. darlingi larvae under the primary forest immediately adjacent to both sides of a manioc plantation field and where the sideroad crossed the Azul River. Larvae occurred mainly on the forest side of the forested-deforested transition zones. Deane et al. (Reference Deane, Causey and Deane1948) have observed that, while An. darlingi larvae are abundantly distributed during the wet season, during the dry season they become limited to foci that are almost always located at forest fringes. We have previously demonstrated an increased occurrence of anopheline larval density and diversity in a forest fringe (Barros et al., Reference Barros, Arruda and Honório2010), as well as increased parasite infestation of anopheline larvae by trophonts of a Tetrahymenidae, possibly an unidentified Lambornella species (Barros et al., Reference Barros, Vasconcelos, Arruda, Confalonieri, Luitgards-Moura and Honório2006).
Definition of ‘microdams’ and the flush-out theory
The link between hidroeletric dams and An. darlingi breeding and malaria incidence is well demonstrated (Tadei et al., Reference Tadei, Mascarenhas and Podestá1983; Zeilhofer et al., Reference Zeilhofer, Santos, Ribeiro, Miyazaki and Santos2007; Cruz et al., Reference Cruz, Gil, Silva, Araújo and Katsuragawa2009; Gomes et al., Reference Gomes, Paula, Natal and Gotlieb2010), but obstruction in much smaller scales has uncommonly been mentioned. However, overhanging bamboo has been found to contribute to An. darlingi larval habitat because it functioned as a barrier to surface water flow, causing the lodging of debris that could then attract gravid females for oviposition (Achee et al., Reference Achee, Grieco, Andre, Roberts and Rejmankova2006). The presence of puddles in the river channel has been suggested to be one the preferred breeding sites of An. darlingi in the dry season (Rozendaal, Reference Rozendaal1992). Rozendaal (Reference Rozendaal1992) hypothesized that breeding sites became available as the river height drops and pools form, and suggested that this increased An. darlingi adult abundance during the long dry season in Suriname.
We have termed these small river obstructions as ‘microdams’ because we believe they exert a role as if they were miniature dams. The term has been previously used when small dams were associated with An. arabiensis malaria transmission in Ethiopia (Alemayehu et al., Reference Alemayehu, Ye-ebiyo, Ghebreyesus, Witten, Bosman and Tekle-haimanot1998). Microdams can be defined as any kind of obstruction to continuous river flow, from terrain topography to tree trunks, that cause seasonal pooling in a river as gage heights rise or fall. The importance of microdams may be explained by the resistance they confer to larval flushing after raining. The flush-out theory of mosquito breeding has been briefly mentioned when dealing with Amazonian anophelines (Russel et al., Reference Russell, West, Manwell and MacDonald1963; Charlwood, Reference Charlwood1980, Reference Charlwood1996) and will be discussed here due to its importance in explaining our results. The theory has been experimentally demonstrated for An. gambiae (Paaijmans et al., Reference Paaijmans, Wandago, Githeko and Takken2007). These authors propose that, apart from flushing, rainfall may also cause larval mortality by the following mechanisms: direct impact of raindrops on the water, depending on the size of raindrops; ejection of immature stages onto muddy surroundings; and exhaustion of larvae by constantly moving away from the surface to avoid being struck by raindrops.
Although, to our knowledge, larval flush-out has not yet been experimentally documented in the Amazon, and seasonal malaria incidence appears to be compatible with its existence (Barros et al., Reference Barros, Honório and Arruda2011). The theory is based upon the notion that mosquito reproduction is successful only if larval habitats remain stable for a duration equivalent to the development of immature stages. After heavy raining, gage height suffers sharp rises, and it is believed that larval mortality could occur by flushing away these immature stages. In the Azul River, the percentage of sites positive for An. darlingi larvae increased with the progression of the dry season and decreased progressively in the rainy season. During the wet season, the gage height is well above the blockades (tree trunks and branches), which means that damming is ineffective and the likelihood of flushing by the currents produced by rainfall would be the same in areas with or without microdams. Rises in gage height are followed by steep drops, suggesting that some of the causes of damming, such as branches or debris, may have been washed away. While unimportant during the wet season, microdams would affect transmission patterns by enabling breeding during the dry season and also during the inter-season transitions.
The importance of microdams in An. darlingi breeding: influence on spatial distribution and breeding season of An. darling
The presence of microdams was the most important parameter determining spatial distribution of An. darlingi larvae in our study, both in the overall model and when only primary forest areas were analyzed. The presence and degree of obstructions were associated both with larval densities and with the number of times per year An. darlingi was collected in each breeding site. To our knowledge, this is the first study to document the role of small flow obstructions in a river to An. darlingi larval distribution and to a prolongation of seasonal breeding of this species.
During the wet-dry transition, colonization by An. darlingi in areas of the river with microdams occurred sooner than that of other areas. As gage height drops, during the end of the rainy season, areas where tree trunks are present create pools that could serve as adequate larval habitats for An. darlingi larvae. In our study, An. darlingi larvae were already retrieved in November in areas with flow obstruction, when the margins of the river were, approximately, below the 0.5 m high tree trunks that were causing obstructions. In contrast, in areas under primary forest, the lesser amount of trunks and debris mean that fewer adequate larval habitats would be present and larval flushing could continue during the dry season. Flushing may only cease with the formation of stable puddles at the bottom of the river channel (point of zero flow), which occurred around January. In our study, An. darlingi larvae were only retrieved in these primary forest puddles in March and May.
Similarly, during the dry-wet transition, areas with microdams could be found positive later than areas without obstructions. In June, two of the three sites where larvae were found were areas with high grade obstructions. Our results suggest that the presence of microdams may increase the breeding season of An. darlingi.
Microdams may be associated with forest fringes
Forest fringes presented a higher number of microdams. All five forest fringe sites were associated with high grade obstructions, while all six primary forest sites were associated with no obstructions. Of the deforested sites, only one out of nine sites (11%) had high grade obstructions, while six (66.6%) had little flow obstruction. An ANOVA of the degree of obstructions at each type of site (primary forest, deforested and transition) showed the difference was statistically significant (F(2,17)=32.10, P<<0.00001), and microdams were more numerous at forest fringes. However, due to the small number of sites studied in the present paper, the association of microdams with forest fringes and/or deforestated areas must be better studied and verified in other areas.
Seasonality studies of malaria transmission in the Amazon are compatible with dry season-only breeding sites as the determining factor of malaria transmission
In our study site, malaria transmission occurred mostly during the dry season (fig. 2); 88% of cases were concentrated from December to May. The mean adult biting densities of An. darlingi near the river followed a similar seasonal curve, increasing progressively during the dry season and reaching a peak at the end of the dry season (fig. 2). In contrast, near fish-farming dams, malaria cases occurred year-round, biting densities were more constant year-round and mean densities were one order of magnitude higher than near the river (Barros et al., Reference Barros, Honório and Arruda2011). The 11 houses where malaria was concentrated were located less than 400 m from the Azul River. Using a distance×density regression equation (Barros & Honório, Reference Barros and Honório2007), it may be estimated that approximately 29% of the mosquitoes emerging from the Azul River will fly 400 m, while only 4.5% will fly 1000 m.
Seasonal An. darlingi abundance studies in frontier zones have shown similar increases in adult mosquito density and malaria cases in the dry season (Camargo et al., Reference Camargo, dal Colletto, Ferreira, Gurgel, Escobar, Marques, Krieger, Camargo and Silva1996; Tadei & Thatcher, Reference Tadei and Thatcher2000; Gil et al., Reference Gil, Alves, Zieler, Salcedo, Durlacher, Cunha, Tada, Camargo, Camargo and Pereira da Silva2003) or the dry-wet and wet-dry transitions (Charlwood, Reference Charlwood1980; Tadei et al., Reference Tadei, Thatcher, Santos, Scarpassa, Rodrigues and Rafael1998; Souza-Santos, Reference Souza-Santos2002). When affecting inter-seasonal periods, the wet-dry transition appears to be more affected than the dry-wet transition. It is at these transitions that greater larval numbers have been retrieved in a longitudinal study (Vittor et al., Reference Vittor, Pan, Gilman, Tielsch, Glass, Shields, Sánchez-Lozano, Pinedo, Salas-Cobos, Flores and Patz2009). In the Province of Roraima, where colonization projects account for the majority of malaria cases, a wave can be visualized where incidences increased gradually from the beginning of the dry season and reached a maximum in the driest months (December) (Dias, Reference Dias2003).
We hypothesize that an important factor determining seasonal malaria occurrence within the frontier zones of the Amazon could be dry-season-stable-wet-season-unstable larval habitats. These habitats could correspond to the blockage of small running water collections, such as streams or small rivers, causing temporary water collections that are stable during the dry season but become inhospitable during the wet season. River blockage may occur due to many factors, such as: creation of dams for any reason, fish-farming, cattle ranching or recreational dams; road construction, which elevates the ground, causing damming of water; erosion of the river bank (either spontaneously or secondary to deforestation), resulting in trees tumbling into the river channel; gold-mining in river banks; and irregularities or characteristics of the terrain. Ideal conditions for breeding could involve a specific amount of rain and/or interval between rains: too much rain would result in larval flushing and too little in drying out of pools. The dry-wet transition, in our study site, was faster, since heavy raining started abruptly, as compared to the wet-dry transition, when raining diminished slowly, through progressively longer intervals. Better characterization of terrain morphology in agricultural settlements, hydrology and meteorology is needed for better understanding the role of microdams in other areas.
Alluvial malaria observation
It should be noted that the alluvial pattern of malaria appears to differ epidemiologically from the dry-season predominant frontier malaria. In areas on the margins of large rivers, breeding and An. darlingi densities markedly increase in the rainy season, with the rise of river level (Klein & Lima, Reference Klein and Lima1990; Charlwood, Reference Charlwood1980; Guarda et al., Reference Guarda, Sayag and Witzig1999; Magris et al., Reference Magris, Rubio-Palis, Menares and Villegas2007).
Other determinants of spatial distribution of larvae: luminance and proximity to houses
In this study, other important factors associated with increased breeding of An. darlingi were the proximity to inhabited houses and luminance. In our study, depth was a weak predictor of the presence of larvae and was significant only when analyzing solely forest fringed sites. The association of An. darlingi larvae with shade has been well documented (Komp, Reference Komp1942; Tadei et al., Reference Tadei, Santos, Costa and Scardana1988, Reference Tadei, Santos, Scarpassa, Rodrigues, Ferreira, Santos, Leão and Oliveira1993; Rozendaal, Reference Rozendaal1990; Manguin et al., Reference Manguin, Roberts, Andre, Rejmankova and Hakre1996). Although An. darlingi may breed in unshaded sites, there is a marked preference for shaded waters. Reflected light was not important in the overall regression model; but, when only sites in deforested areas were analyzed, the amount of reflected light was the most significant predictor variable for collecting An. darlingi larvae. This suggests that deforestation could promote a change in the limiting factor of larval presence, from microdams to luminance.
We preferred using the notion of luminance, which describes the degree of reflected light, than the more usual term ‘shade’. The latter refers to blocking of direct sunshine by any interposed structure. We believe that the preference for less luminous sites is secondary to a behavioral characteristic of the forest-adapted ovipositing female, since An. darlingi larvae survive well when moved to sunlit sites and attraction for low luminance sites could help explain the preference of An. darlingi for black waters (F.S.M. Barros, unpublished data). It is generally believed that anophelines oviposit during the early morning hours and dusk (Russell & Rao, Reference Russell and Rao1942; Detinova, Reference Detinova1962). During twilight, the sun is from 0 to −18° below the horizon. Using the NOAA Solar Position Calculator (http://www.srrb.noaa.gov/), we determined that biting activity in Sideroad 19 (Barros et al., Reference Barros, Arruda, Vasconcelos, Luitgards-Moura, Confalonieri, Rosa-Freitas, Tsouris, Lima-Camara and Honório2007b) starts in the evening with the sun at −1 to −5° below the horizon and ends in the morning with the sun at approximately the same position. Presuming oviposition follows a similar pattern, at this time there is no direct incidence of sunlight. During twilight, the distinction between shaded and unshaded sites is not possible because indirect sunlight is scattered in the upper atmosphere in multiple directions. The amount of inciding light in each part of a larval habitat should vary in accordance to the amount of steradians (solid angles) of unobstructed sky, as well as factors related to twilight sky brightness (Divari & Plotnikova, Reference Divari and Plotnikova1966).
In the Brazilian Amazon, Tadei et al. (Reference Tadei, Santos, Scarpassa, Rodrigues, Ferreira, Santos, Leão and Oliveira1993) observed that, while An. darlingi was not retrieved in unaltered areas, it was found in practically all sampled areas that were altered by human activity (hydroelectric dams and roads). Vittor et al. (Reference Vittor, Gilman, Tielsch, Glass, Shields, Lozano, Cancino and Patz2006) demonstrated increased densities of An. darlingi adults in inhabited areas. One of the best predictor of An. darlingi larval distribution was the proximity to humans (Vittor et al., Reference Vittor, Pan, Gilman, Tielsch, Glass, Shields, Sánchez-Lozano, Pinedo, Salas-Cobos, Flores and Patz2009). Barros et al. (Reference Barros, Arruda and Honório2010), using collections from two sites in Roraima, one including Rorainópolis, have also demonstrated that shade and the proximity to human dwellings were the best predictors of the presence of An. darlingi. Vittor et al. (Reference Vittor, Gilman, Tielsch, Glass, Shields and Patz2002) have, however, recovered An. darlingi larvae in lightly inhabited, as well as uninhabited areas, although in much lower densities than near humans.
Literature linking frontier malaria to newcomers: lack of resistance or proximity to the forest fringe?
High risk areas of malaria morbidity involve forest fringes (de Castro et al., Reference de Castro, Monte-Mor, Sawyer and Singer2006; Silva-Nunes et al., Reference Silva-Nunes, Codeço, Malafronte, Silva, Juncansen, Muniz and Ferreira2008; Silva et al., Reference Silva, Tadei and Santos2010). Malaria has also been clearly associated with forest-related activities such as land clearing (Silva-Nunes et al., Reference Silva-Nunes, Codeço, Malafronte, Silva, Juncansen, Muniz and Ferreira2008). Lack of resistance, of newcoming settlers, has been mentioned as an explanation; however, whenever dense forest is rapidly cut and cleared, leaving large open areas, minimal malaria transmission occurs (Singer & de Castro, Reference Singer and de Castro2006). Transmission remains low despite large-scale influx of non-resistant workers. This rapid clear-cutting land clearance process has been the norm when deforestation is performed by the corporate sector in Brazil. Therefore, other factors other than resistance to infection appear to be at work.
In our study area, settlers that had colonized the land for a mean of ten years still had a high number of malaria cases and only 31% (n=103) of the total population was affected, while 69% (n=230) was malaria free from their arrival (mean of five years) (data not shown). Incidence of malaria had no correlation with the time of arrival in the sideroad (Barros et al., Reference Barros, Honório and Arruda2011), and the number of malaria cases was usually low, around one or two cases in five years (mean of 1.5 cases per year), not enough to confer resistance to infection. Only 6% of the population (n=21) reported more than ten cases. We believe that resistance to malaria infection is a poor explanation to account for the distribution of cases in our study site. We hypothesize that a contributing factor to increased malaria transmission in the proximity of forest fringes, and also among land-clearers, could be increased breeding of An. darlingi at these sites. But due to the low number of sites studied in this paper, this increased breeding pattern, and associated malaria, remains to be verified in future studies and in other areas. The role of resistance must also be better studied.
Linking deforestation to malaria risk at the forest fringe: explaining increased breeding of An. darlingi with the ‘forest fringe model’
It has been proposed that volatile compounds emanating from algae or decaying leaf litter could provide olfactory cues for An. darlingi, influencing its oviposition behavior, or that certain trees exert an inhibitory effect on mosquito oviposition (Vittor et al., Reference Vittor, Pan, Gilman, Tielsch, Glass, Shields, Sánchez-Lozano, Pinedo, Salas-Cobos, Flores and Patz2009). However, the existence of volatile compounds would fail to account for an increased presence of larvae under primary forest, at the forest fringe, as observed in this study. Also, increased malaria transmission associated with the forest fringe would remain unexplained, as observed in other studies (de Castro et al., Reference de Castro, Monte-Mor, Sawyer and Singer2006; Silva-Nunes et al., Reference Silva-Nunes, Codeço, Malafronte, Silva, Juncansen, Muniz and Ferreira2008). Here, we propose an alternative explanation to olfactory cues and malaria resistance for linking An. darlingi breeding with deforestation, the ‘forest fringe model’, which could account for discrepancies observed in the literature. In this model, three factors would interact to increase An. darlingi breeding at the forest fringe.
Land-clearing techniques used by settlers, at least in southern Roraima State, do not usually preserve gallery forests, and fire commonly causes extensive damage to the trees near small rivers. Burnt trunks or branches near the river bed, associated with heavy rains, may easily suffer erosion and fall into the small river or stream, causing partial blockage of water flow. At the same time, deforestation exposes large areas to sunlight.
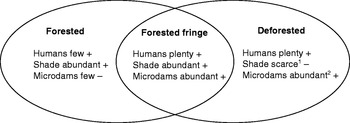
Our data suggests that at least three factors would interact to determine An. darlingi distribution at the forest fringe: (i) availability of human blood meals, the preferred vertebrate host; (ii) availability of stable water collections; and (iii) preference for shaded water collections. We hypothesize that deforestation and human presence creates a new habitat, a forest fringe ecosystem, by promoting three changes in An. darlingi binomics: (i) increasing contact with humans; (ii) increasing the number of microdams, which increases the number of potential larval habitats as well as the breeding season; and (iii) reducing the number of shaded breeding sites in a given geographical area, which results in a concentration of larvae in remaining shaded areas (fig. 7). The ideal breeding site occurs in the forest fringe, where the three factors, shade, microdams and human blood meals, are located close to each other. The relative contributions of each factor remains to be determined, as well as the possible influence of other factors. The end-result would be an increased density of larvae at the forest fringe. The presence of larval habitats increases the density of emerging adults, but a more important effect may be that ovipositing females, thus parous vectors, are concentrated near these sites (Menach et al., Reference Menach, McKenzie, Flahault and Smith2005).
Proposed model of An. darlingi breeding in the forest fringe in recently deforested sites that lack secondary growth. The model is based on breeding site parameters found significantly associated with the occurrence of larvae in the present study. The influence of each factor on the breeding of An. darlingi is indicated by a plus or minus sign. 1The amount of luminance may suffer variation in accordance to secondary growth. 2Number of microdams may vary with time and in different areas. Man-made dams increase flow obstruction and decomposition or clearance of tree trunks from streams could possibly decrease the number of microdams.

With more prolonged occupation and improvement of living conditions of settlers, deforestation is more extensive. Cattle ranching may also replace agricultural practices in some areas. In this phase of frontier malaria, malaria transmission is substantially reduced (Sawyer, Reference Sawyer1988; de Castro et al., Reference de Castro, Monte-Mor, Sawyer and Singer2006); extensive forest clearing leaves few shaded areas and the forest fringe is further away from human dwellings. Although we observed many flow obstructions due to fallen tree trunks and branches in recently (<1–2 years) deforested sites, sites that had been cleared more than four to five years before lacked these dams, presumably due to the rotting of the wood or washing away of smaller branches (F.S.M. Barros, unpublished data). We believe that further studies are necessary for understanding the long-term effects of deforestation on An. darlingi breeding. The introduction of alternative feeding sources must also be evaluated.
Methodological limitations
Our study has a number of methodological limitations. The most important is the small scale of the project. Due to the large number of dips involved, precise geographic positioning and accurate determination of the exact site where An. darlingi larvae occurred, the study had to be limited to a small geographical area. Although, a relatively long area was studied, the collections involved only a single river. Results must be viewed with caution, since they may not be representative of other regions or the same region in higher scales.
Some factors that have been mentioned to influence An. darlingi breeding, such as algae, were not studied in this paper because of lack of variance (Vittor et al., Reference Vittor, Pan, Gilman, Tielsch, Glass, Shields, Sánchez-Lozano, Pinedo, Salas-Cobos, Flores and Patz2009); we rarely verified algal mats in the sites studied. Water body size was also not well evaluated because sites differed little in size due to the study design. Water turbidity was not studied because all sites had clear water at the time of larval studies. Suspended oxygen and water conductivity were not studied due to technical limitations.
The effect of deforestation on An. darlingi breeding was not the primary objective of the study and was derived from spatial data information and associations with breeding site parameters. Deforestation was not longitudinally studied and the one year observation period may have been too short for determining long-term effects. It should be noted that, although Vittor et al. (Reference Vittor, Pan, Gilman, Tielsch, Glass, Shields, Sánchez-Lozano, Pinedo, Salas-Cobos, Flores and Patz2009) found increased An. darlingi larval abundance in areas with deforestation and secondary growth, this scenario is distinct from the one described in this study. In our study site, deforestation was performed for using land for agriculture, which means secondary growth was mostly cut down by settlers because it interfered with the manioc plantation. The effect of secondary growth on An. darlingi breeding was not adequately studied in this paper. We have repeatedly observed that An. darlingi larvae can be found clustered where secondary vegetation (primarily Cecropia spp., in our site) is tall enough to provide shade. Deforestation may be a non-homogeneous process and different land-uses may have diverging influences on An. darlingi breeding and malaria transmission. We believe more studies are necessary for evaluating secondary growth qualitatively and quantitatively in frontier zones and determining its association with An. darlingi breeding. This information would also help fill existing knowledge gaps regarding the model proposed in this article.
The physico-chemical properties of the breeding sites were determined only twice during the study period, during the wet season and the dry season. We did not study alterations during every collection period because of logistical limitations, and it was assumed that inter-collection variation was low. If subtle or transient seasonal variations in physico-chemical properties of the breeding sites did occur, the effect that this may have in An. darlingi breeding could have been missed. Suspended sediment and dissolved oxygen, for example, may increase with subtle alterations in current flow. Also, water speed and volumetric discharge were not measured, which could have provided more accurate parameters than gage height or visual current estimations. Crest-stage gages were not used for measuring maximum river levels, and these may have been missed by the once daily staff gage readings. Photometric readings where performed only with visible light and ultraviolet and infrared spectrums were not evaluated. Categorization was used, instead of a continuous parameter, due to incomplete data sets for some habitats.
Finally, it is possible that An. darlingi has a high degree of geographical variation in genetic and behavioral factors, as suggested from preliminary data from Manaus, Brazil (Silva et al., Reference Silva, Tadei and Santos2010). However, few studies have been performed on genetic polymorphisms of this species and more information is necessary to determine this.
Concluding remarks
In attempting to identify key determinants of the breeding behavior of An. darlingi, we verified a spatial variation in the parameters associated with breeding and clustering of larvae in forest fringes. Linking malaria to deforestation practices has important implications for control strategies. It is possible that surpervision and control of deforestation practices near streams and rivers may reduce the abundance of An. darlingi and malaria transmission in frontier zones. The distance to shaded stable water collections could be particularly important. The use of wells as water sources, in contrast to small dams, could also possibly increase the distance between humans and breeding sites, reducing contact with An. darlingi. Counseling could be performed on the distance that houses should have from the forest fringe, from fish-farming dams and from rivers.
To our knowledge, this is the first demonstration of spatial variation in breeding site preference for this species. We have confirmed that deforestation may modify the breeding behavior of An. darlingi and proposed a model to explain why larvae are clustered in forest fringes. However, exactly how deforestation affects An. darlingi breeding must still be determined, and the relative role of absence of shade, proximity to humans and of other factors possibly associated must be better defined. In particular, the importance of a previously unrecognized factor, the obstructions to river flow or microdams, must be further studied. Their importance in determining seasonal malaria incidence and in increasing the breeding season of An. darlingi needs to be better characterized.
Acknowledgements
To José Francisco Luitgards Moura, for the kind support and for helping our group with logistical problems. To the personnel of FUNASA in Roraima, especially Ducineia de Aguiar.
This work was supported by the Inter-American Institute for Global Change Research.
Ethical clearance
The procedures used in this paper were approved by the ethics committee of the Oswaldo Cruz Foundation (Fiocruz) (Protocol 05/03).