

INTRODUCTION
In August 2017, global media covered the successful launch and landing of one of SpaceX’s Falcon 9 spacecraft’s second recycled rocket, which was previously launched in January of the same year. SpaceX released videos of the landing which surprised viewers, since the reason behind the innovation of recycling rockets was to drastically reduce the cost of launching rockets into space. According to SpaceX’s announcement, space travel at one-tenth of the current price is not unattainable. The question is, however, where do these innovations of SpaceX – one of the most innovative firms in the 21st century – come from? A firm cannot develop all the necessary resources internally; it must rely on external resources to successfully contend with competitors (Powell, Koput, & Smith-Doerr, Reference Powell, Koput and Smith-Doerr1996). Alliances are favorable factors in overcoming resource limitation issues, as they create new opportunities to use the scale and scope of resources beyond the boundaries of a focal firm (Wassmer & Dussauge, Reference Wassmer and Dussauge2011; Zheng, Li, & Wu, Reference Zheng, Li and Wu2013). To overcome technical limitations and internal investments, SpaceX formed alliances with institutions such as the NASA. After the 1990s, there was a significant increase in alliances that take advantage of external partner firms across many industries (Lavie, Reference Lavie2007; Kale & Singh, Reference Kale and Singh2009).
Traditionally, alliance research has predominantly focused on a dyadic relationship between two firms, neglecting consequences of several coordinated alliances. However, the crucial factor is not the success or failure of a single alliance, but whether a focal firm reaches its strategic goal with a bundle of alliances (Kenis & Knoke, Reference Kenis and Knoke2002; Wassmer, Reference Wassmer2010). Therefore, placing a whole alliance of a focal firm – referred to as an alliance portfolio (AP) – at the center of interest, keeps the broader firm strategy in mind (Duysters & Man, Reference Duysters and Man2003). Ozcan and Eisenhardt (Reference Ozcan and Eisenhardt2009) showed that an AP is the result of a firm’s strategic choices. Most modern firms engage in APs to access diverse resources, rather than depending on a single alliance (Hoffmann, Reference Hoffmann2007; Wassmer, Reference Wassmer2010). By pursuing multiple goals through an AP, firms can potentially overcome uncertainty and spread the risk across several alliances (Hoffmann, Reference Hoffmann2007).
Prior research on APs has mainly involved one degree from a focal firm, which are direct alliances or partners. However, we know from previous research that a focal firm is not only affected by direct alliances or partners (Ahuja, Reference Ahuja2000a). To overcome such limitations, this study introduces the Three Degrees of Influence Rule from sociology of Christakis and Fowler (Reference Christakis and Fowler2009). This rule states that the range of influence reaches up to three degrees from a focal firm in terms of the structure or density of an extended alliance portfolio configuration (APC), the size or number of alliances (NOA), and the number of partners (NOP) in an extended APC. The research category of this study is included in the configuration study among the three AP research areas, namely emergence, configuration, and management of an AP. The APC research field can be further divided into four dimensions: size, structure, relationships, and partners. However, this study only focuses on the size, structure, and relationships between these explanatory variables of firm innovation.
This study makes several contributions to the APC literature and provides further implications. First, it bases the definition of an APC (a focal firm’s egocentric network) on the scope of an extended APC from one degree to three degrees, using the Three Degrees of Influence Rule from sociology, and uses several variables, including size (both NOA and NOP) and density extracted by the extended APCs. In the past, Ahuja (Reference Ahuja2000a) studied the alliance as both direct and indirect NOA concepts separately, not from an integrated perspective. To complement past literature, this study first evaluates the impact of an extended APC on innovation from an integrated perspective. Second, according to Wassmer’s (Reference Wassmer2010) review article, a research gap exists in the simultaneous study of two dimensions in the APC research. Therefore, this study adapted the size and structural dimension variables and analyzed the relationship between the two variables, which showed that one dimension alone cannot explain firm innovation. Third, this study introduces two concepts (NOA and NOP) that are significantly lacking in the alliance literature, and uses them as variables (Wassmer, Reference Wassmer2010; Phelps, Heidl, & Wadhwa, Reference Phelps, Heidl and Wadhwa2012; Kim & Choi, Reference Kim and Choi2014a). Scholars and managers should be able to understand and distinguish between these two completely different variables.
The remainder of this study is arranged as follows: second section develops the theoretical background of why the concept of an extended APC should be adapted in the APC research field. Based on this, third section describes hypotheses related to the structure, size, and relationship terms related to the concept of an extended APC. In fourth section, the hypotheses are tested using data from the Korean bio-pharmaceutical industry and employing the two-step generalized method of moments estimates. Finally, fifth through seventh sections present the empirical results and conclusion with a discussion of the implications, limitations, and directions of future research for managers and scholars.
THEORETICAL BACKGROUND
When alliances are formed, they agglomerate into vast networks of alliances that encompass many firms despite starting from a single dyad. These alliance networks are invisible and too complex to be understood intuitively. Therefore, to understand these complex alliance networks among firms, there has been two primary research streams, AP and interfirm collaboration networks. This study focuses on AP, which is a study area related to a focal firm that has multiple alliances or egocentric networks (Baum, Calabrese, & Silverman, Reference Baum, Calabrese and Silverman2000; Bae & Insead, Reference Bae and Insead2004; Lavie, Reference Lavie2007). However, studies on interfirm collaboration networks focus on a focal firm’s position within a broader alliance network or the structure of its immediate network neighborhood (Schilling & Phelps, Reference Schilling and Phelps2007). Many scholars have pointed out that the aggregate properties of APs that affect innovation are significant and developing issues (Lavie, Reference Lavie2006; Wassmer, Reference Wassmer2010). The fundamental premise of AP is that its arrangement of several aggregate properties has a marked effect on firm innovation (Fiss, Reference Fiss2007), and APC has the potential for reaching network resources. In addition, an AP can determine the quality, quantity, and diversity of resources available to a focal firm, which in turn can influence the firm’s ability to develop and introduce innovation (Hoffmann, Reference Hoffmann2007; Wassmer, Reference Wassmer2010).
Research on APs began in earnest after 2000, with the development of the social network theory in sociology (Kim & Choi, Reference Kim and Choi2014a). Scholars differ somewhat regarding the definition of AP (Baum, Calabrese, & Silverman, Reference Baum, Calabrese and Silverman2000; Bae & Insead, Reference Bae and Insead2004; Hoffmann, Reference Hoffmann2007; Lavie, Reference Lavie2007), but it can be generalized as ‘a focal firm’s egocentric network’ from a social network perspective (Wassmer, Reference Wassmer2010). According to Wasserman and Faust (Reference Wasserman and Faust1994), this notion of the egocentric network includes a focal firm (ego), its set of partners (alters), and their alliances (relationships). AP research has been divided into three research fields:
-
1. emergence (e.g., Ahuja, Reference Ahuja2000b; Ozcan & Eisenhardt, Reference Ozcan and Eisenhardt2009),
-
2. management (e.g., Anand & Khanna, Reference Anand and Khanna2000; Kale, Dyer, & Singh, Reference Kale, Dyer and Singh2002; Schilke & Goerzen, Reference Schilke and Goerzen2010); and
-
3. configuration (e.g., Ahuja, Reference Ahuja2000a; Baum, Calabrese, & Silverman, Reference Baum, Calabrese and Silverman2000; Stuart, Reference Stuart2000).
This study fits into the APC research field, which can be divided into the following four dimensions:
-
1. size, specifically NOA and NOP (e.g., Deeds & Hill, Reference Deeds and Hill1996; Ahuja, Reference Ahuja2000a; Hoffmann, Reference Hoffmann2007);
-
2. structure, namely breadth, density, and the level of redundancy (e.g., Ahuja, Reference Ahuja2000a; Hoffmann, Reference Hoffmann2007; Koka & Prescott, Reference Koka and Prescott2008);
-
3. relationships, such as tie strength (e.g., Rowley, Behrens, & Krackhardt, Reference Rowley, Behrens and Krackhardt2000; Hoffmann, Reference Hoffmann2007); and
-
4. partners, including partner-related characteristics (e.g., Stuart, Reference Stuart2000; Lavie, Reference Lavie2007).
This study specifically considers the size dimension of NOA and NOP, the structural dimension of density, and the relationship between these variables.
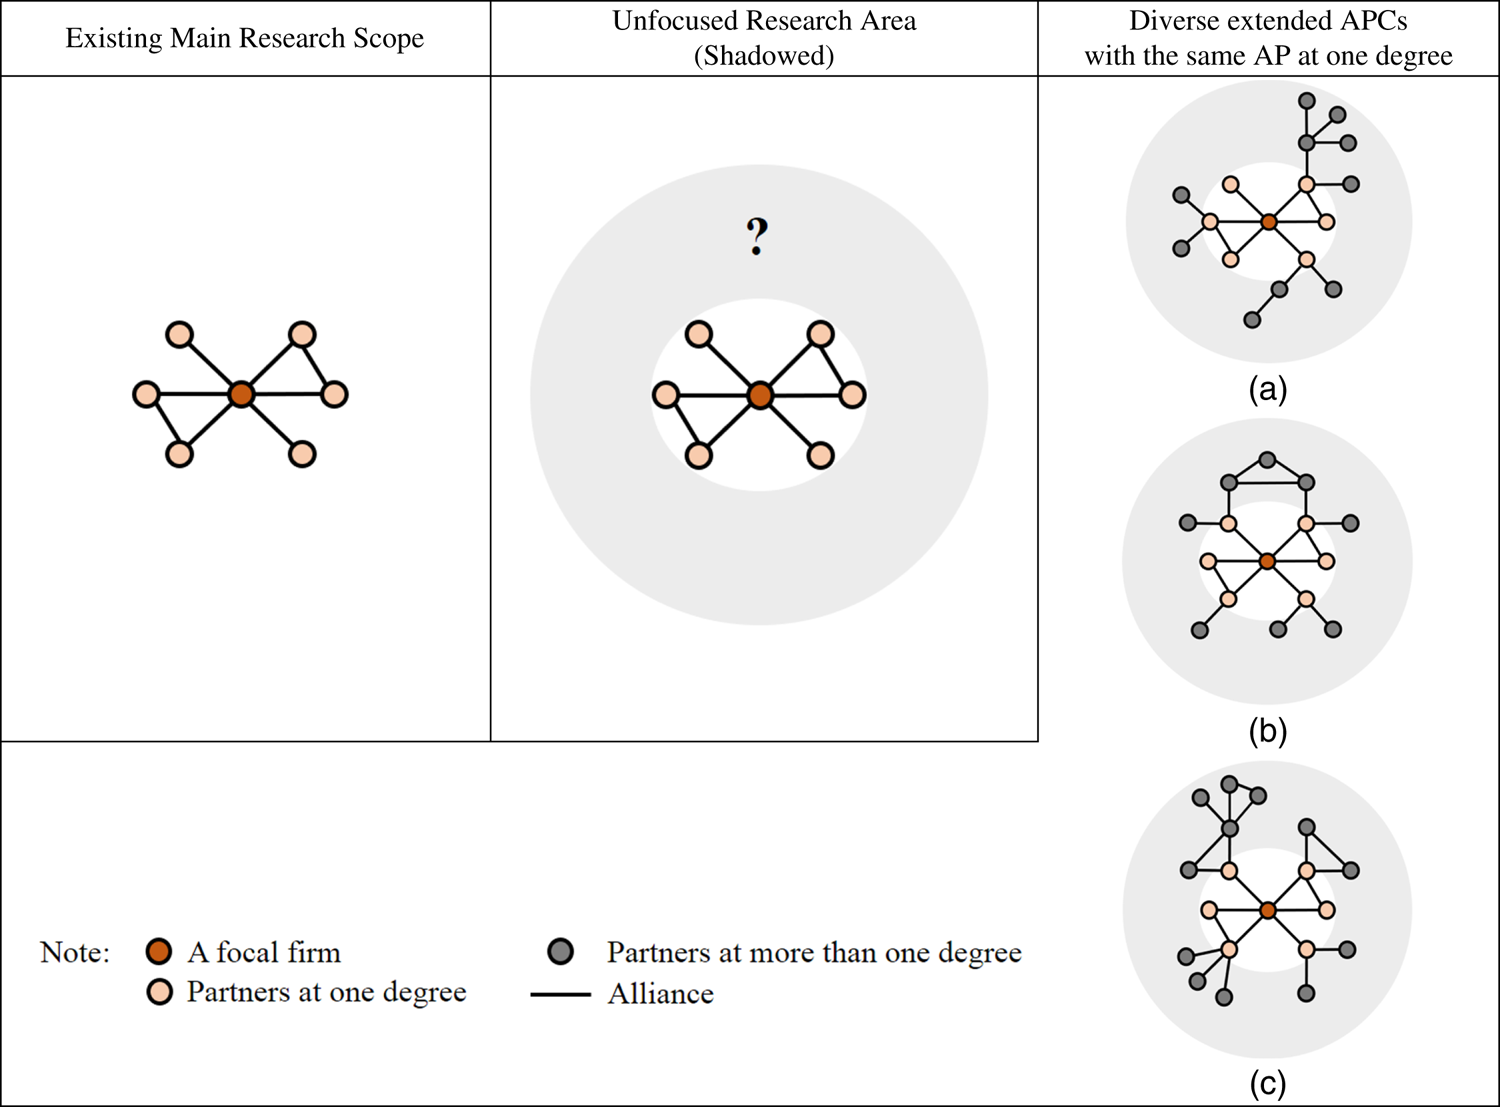
In reviewing the APC definitions and prior studies, one important fact was noticeable: most scholars have focused on directly connected alliances based on the definition of a focal firm’s egocentric network, such as the one shown in the picture on the left in Figure 1. The reasons for this could be as follows: first, scholars may have believed that directly connected alliances to a focal firm have the greatest impact, whereas indirectly connected alliances have a relatively negligible impact. However, as shown by Ahuja (Reference Ahuja2000a), it is possible within limits to understand external alliances considering only directly connected alliances, although it is difficult to find related studies. Ahuja (Reference Ahuja2000a) proved that both direct and indirect alliances have a positive effect on innovation. Second, a possible lack of computing ability could be a factor. Judging from the data collected in the present study, the NOA increases exponentially by degree, moving further away from a focal firm. This complexity might have caused a serious constraint in adapting the extended APC concept. In fact, considerable effort was necessary to construct data representing alliances at two and three degrees. Therefore, the extended concept of APC research may have been lacking thus far, but through this study, we will attempt to fill this gap. As shown in the picture on the right in Figure 1, the extended APC can be created in additional forms, although the configuration at one degree is the same.
The past research areas in alliance portfolio configuration (APC) and various pictures at more than one degree

Previous studies indicate that a focal firm is not affected solely by one degree. If this is accurate, defining the range and intensity of the extended APC and its effect on a focal firm can be challenging. Given that alliances that are removed by a number of degrees from a focal firm would have less impact, it follows that alliances that are indefinitely far from a focal firm would essentially have no effect. The Three Degrees of Influence rule from sociology (Christakis & Fowler, Reference Christakis and Fowler2009) addresses these concerns. For example, on an individual level, a friend can have influence over someone from up to three degrees removed, which means that a person’s friends’ friends’ friends affect them. After that, the influence is negligible. In terms of this research scope, which is consistent with the study of Ahuja (Reference Ahuja2000a), this concept is worth applying to the extended APC research, and it will help to disprove the common theory that only direct partners affect a focal firm. If alliances that are up to three degrees removed can influence a focal firm, we can predict that the strengths of the influence on alliances at one, two, and three degrees would be different, as the influence becomes weaker as the distance increases. Christakis and Fowler (Reference Christakis and Fowler2009) called this phenomenon the ‘intrinsic-decay explanation,’ which can be compared to the waves made on a pond by a falling water drop. An influence such as this interacts among firms within three degrees and will diminish as the degree increases. Surprisingly, Christakis and Fowler (Reference Christakis and Fowler2009) point out that the Three Degrees of Influence rule applies to most areas of life and is therefore a valuable rule that can be applied to APC research.
THEORY AND HYPOTHESES
Structure of the extended APC
An extended APC is an extensive egocentric network in which a focal firm plays a central role in terms of information control. In such a large structure, a focal firm could be positively influenced by innovation resulting from the recombination of information (Nelson & Winter, Reference Nelson and Winter2009). To play such a central role – where information flows along the network with each member firm acting as both a recipient and transmitter (Ahuja, Reference Ahuja2000a) – it is important for a focal firm to be positioned at the center of the structure where it can control the information. However, in an extended APC with many connections between partners, a focal firm is less likely to be in the structural center, due to firms that have multiple alliances or partners in comparison to their alliance with the focal firm. As such, a focal firm has a sparse APC that can be structurally centralized, or a structure with a small NOA between partners.
Previous studies state that this sparse APC provides many advantages to a focal firm. The most emphasized advantage is the novelty of knowledge that comes from the sparse APC. Gilsing, Nooteboom, Vanhaverbeke, Duysters, and van den Oord (Reference Gilsing, Nooteboom, Vanhaverbeke, Duysters and van den Oord2008) pointed out that knowledge flowing in a dense APC is an ‘everyone knows what everyone knows’ type of knowledge, due to the spread of knowledge. Consequently, this type of knowledge novelty problem could cause a decrease of innovation in a focal firm with a dense APC. In a dense APC, a focal firm often needs to share knowledge they do not want to share, and is therefore forced to act collectively (Kraatz, Reference Kraatz1998). This hinders a focal firm from maintaining its novelty (Gilsing & Nooteboom, Reference Gilsing and Nooteboom2005). According to Andrevski, Brass, and Ferrier (Reference Andrevski, Brass and Ferrier2016), the resources of a sparse APC are related to a firm’s opportunity recognition capacity, which could force the executive power of a focal firm. In the past, a sparse APC was considered as more advantageous than a dense APC. Furthermore, in knowledge-based industries such as the pharmaceutical industry, novel and nonredundant information plays a critical role in R&D for open innovation (Chesbrough, Reference Chesbrough2003). In this regard, partners who are by degree further removed from a focal firm in an extended APC’s highly linked configurations to other partners are likely to weaken the positive impact on innovation performance by reducing innovation in terms of resource diversity. Therefore, the sparsely extended APC would positively affect firm innovation in terms of information control, knowledge novelty, and characteristics of knowledge-based industries. Accordingly, we present the following hypothesis:
Hypothesis 1: The sparseness of the extended APC will positively affect firm innovation.
Size of the extended APC
As stated previously, perhaps the most important argument in APC literature is that APC size affects innovation performance (Wassmer, Reference Wassmer2010). Many previous studies have concluded that the greater the size, the better, and that APC size is important in explaining innovation performance and differentiation among firms. Differentiation refers to innovation output rates (Shan, Walker, & Kogut, Reference Shan, Walker and Kogut1994), new product development (Deeds & Hill, Reference Deeds and Hill1996), competitive action frequency (Andrevski, Brass, & Ferrier, Reference Andrevski, Brass and Ferrier2016), and innovation performance (Lahiri & Narayanan, Reference Lahiri and Narayanan2013). This empirical research on the relationships between the larger-sized APC and innovation performance focused on the directly connected alliances affecting a focal firm’s innovation performance. A recent study found that the larger-sized alliances could be beneficial for developing opportunities (Andrevski, Brass, & Ferrier, Reference Andrevski, Brass and Ferrier2016).
Ahuja (Reference Ahuja2000a) explored the independent effect on innovation performance of alliances at one degree (direct ties) and alliances at two or three degrees (indirect ties), including the moderating effect on innovation between the direct ties and the indirect ties. The results showed that innovation performance improved with more ties – direct or indirect – and that an APC with a small NOA at one degree accessing a large NOA at more than two degrees can be effective. This is likely due to firms benefiting from the effect of the larger-sized alliances at second or third degrees without bearing the cost of maintaining the large NOA at one degree. We have been unable to find additional studies regarding alliances at two or three degrees.
Despite Ahuja’s (Reference Ahuja2000a) claim, it is more reasonable for the extended APC to be viewed in an integrated way, as it is difficult to distinguish whether the benefits come from direct or indirect ties. It could nonetheless also be easy to distinguish between them. Ahuja (Reference Ahuja2000a) additionally argued that the benefits from direct and indirect ties are similar in terms of it being beneficial for creating knowledge in the focal firm. His article states that knowledge sharing, complementarity skills, and scale economies are from direct ties, and knowledge spillover is from indirect ties. However, these benefits are essentially the same when it comes to social capital. Pertaining to these observations, we require an integrated perspective to accurately understand direct and indirect ties concerning the extended APC. Considering all these statements, it seems that larger-sized alliances in the extended APC would positively affect firm innovation. Accordingly, we present our next hypothesis:
Hypothesis 2: The integrated NOA in the extended APC will positively affect firm innovation.
APC size – referring to NOP – has been largely overlooked in the past (Wassmer, Reference Wassmer2010). The majority of studies examining APC size have been focused on one aspect of size, which is NOA, while ignoring a second important dimension, which is NOP. Therefore, this study addresses the size of APC with NOP included, since it is theoretically different from NOA (Kim & Choi, Reference Kim and Choi2014a). In the extended APC, it is necessary for the integrated size (NOA and NOP) to positively affect innovation performance for up to three degrees. Therefore, the larger-sized partners in the extended APC would positively affect innovation performance. Accordingly, we propose our next hypothesis:
Hypothesis 3: The integrated NOP in the extended APC will positively affect firm innovation.
The joint effect of structure and size of the extended APC
While many studies have focused on the size issue in particular, several scholars have tried to fully understand the effect of the APC size on innovation performance in conjunction with other APC attributes such as breadth, efficiency, and innovation of partner firms (Gulati, Reference Gulati1999; Stuart, Hoang, & Hybels, Reference Stuart, Hoang and Hybels1999; Ahuja, Reference Ahuja2000a; Baum, Calabrese, & Silverman, Reference Baum, Calabrese and Silverman2000; Stuart, Reference Stuart2000; Lahiri & Narayanan, Reference Lahiri and Narayanan2013). These studies contributed a deeper understanding of APC size by explaining moderating effects that could be beneficial for innovation performance. If the APC is small but highly broad, efficient, and innovative, it could be more beneficial for a focal firm than just having many partners. This is due to the redundancy of information or resources. In a review study by Phelps, Heidl, and Wadhwa (Reference Phelps, Heidl and Wadhwa2012), the existing literature focused on independent dimensions including size, structure, relationships, and partners, rather than on interdependent dimensions. In line with Wassmer’s (Reference Wassmer2010) recommendations for future research, combining the two dimensions would be a promising research opportunity to better understand the effects of APC size. Therefore, considering prior studies, it is important to discover the moderating effects of the APC size.
Introducing a structural dimension as an element that affects APC size has theoretical significance in understanding APC size. Moreover, the scope of the APC is extended when compared with previous studies. More generalized results are presented to discover the moderating effects of APC size. Additionally, since past APC research focused on how size effects innovation performance – especially NOA (Wassmer, Reference Wassmer2010) – introducing NOP broadens our knowledge of this field.
In practical terms – as explained in the hypotheses above – the sparsely extended APC structure is related to opportunity recognizing capacity, and the size is related to the firm ‘s capacity for potential knowledge development. Therefore, if the opportunity recognizing capacity is larger, it is closely related to innovation in the larger-sized alliances and partners, because the integrated potential for recognizing and developing opportunities could lead to actual innovation performance. In accordance with this view, which highlights the positive aspects of sparseness regarding the size of the extended APC and innovation performance, we hypothesize the following:
Hypothesis 4: An increased sparseness of the extended APC will strengthen the positive relationship between size and firm innovation.
METHOD
Data collection and setting
The technological alliances of 31 leading Korean bio-pharmaceutical firms which are listed on the Korea Securities Dealers Automated Quotation and the Korea Composite Stock Price Index were used as a data source. The bio-pharmaceutical industry is characterized by high innovation openness and shows high alliance tendencies (Hagedoorn, Reference Hagedoorn1993, Reference Hagedoorn2002). Therefore, the bio-pharmaceutical industry is a suitable example for studying APC, and one that has been chosen as the focus in many prior studies (Wassmer, Reference Wassmer2010).
Co-patenting was used as an indicator of technological alliances based on the coapplication of firms (Sebestyén & Varga, Reference Sebestyén and Varga2013; Zhang, Guan, & Liu, Reference Zhang, Guan and Liu2014). The technological alliance data were obtained from an online patent search of the Korea Institute of Patent Information. The year of the formation of the technological alliance is the date of the patent application and is consistent with recent empirical work (Baum, Calabrese, & Silverman, Reference Baum, Calabrese and Silverman2000). For example, if firms A, B, and C jointly applied for a co-patent, they were considered to have a one-time technical alliance with each other based on the date of the patent application (Baum, Calabrese, & Silverman, Reference Baum, Calabrese and Silverman2000; Kim & Choi, Reference Kim and Choi2014a, Reference Kim and Choi2014b).
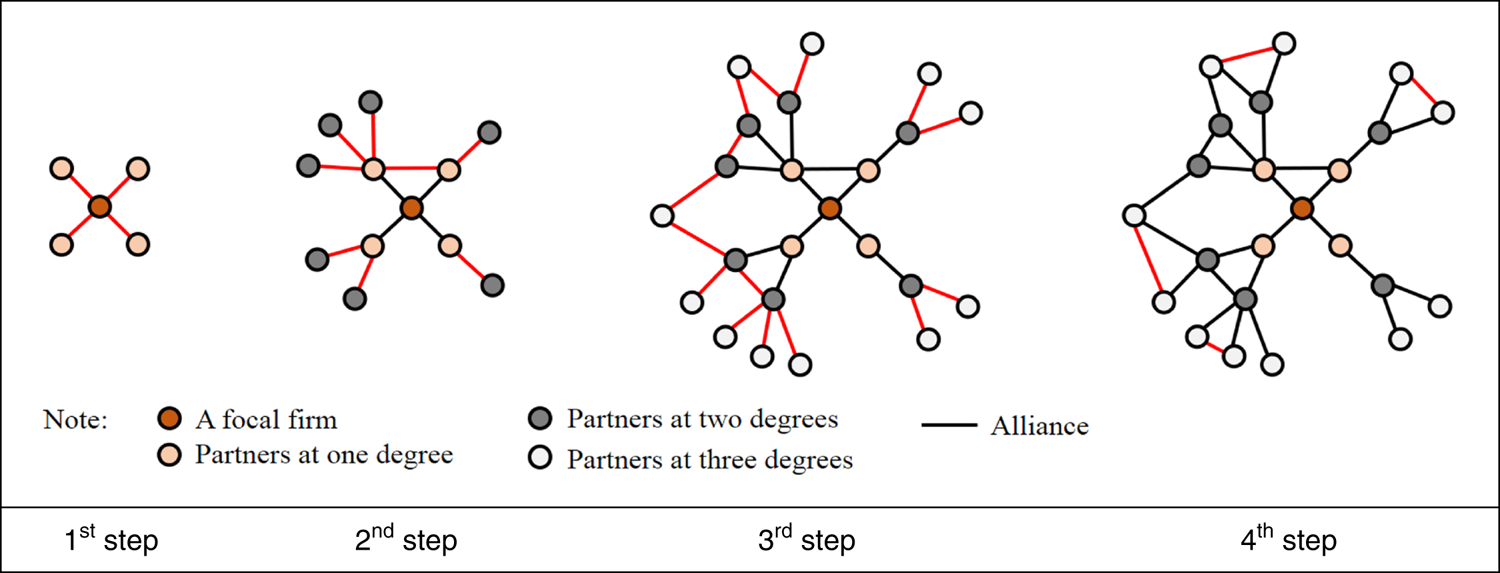
To investigate the extended APC of these 31 firms, a four-step method was required (see Figure 2) as there is no single database that provides such data for the extended APC. The first step examined alliances that were directly connected to a focal firm, and partners at one degree were identified. The second step examined alliances that were directly connected to partners at one degree, and partners at two degrees were identified. The relationships among partners at one degree were also investigated. The third step examined alliances that were directly connected to partners at two degrees, and partners at three degrees were identified. The relationships among partners at two degrees were also investigated. Finally, the fourth step examined relationships among partners at three degrees. By examining these complicated networks from 2007 to 2014 to see how the recent extended APCs impact on innovation performance, all of the extended APCs of a focal firm were configured from 119,994 alliances.
Four-step method for collecting data on extended alliance portfolio configurations

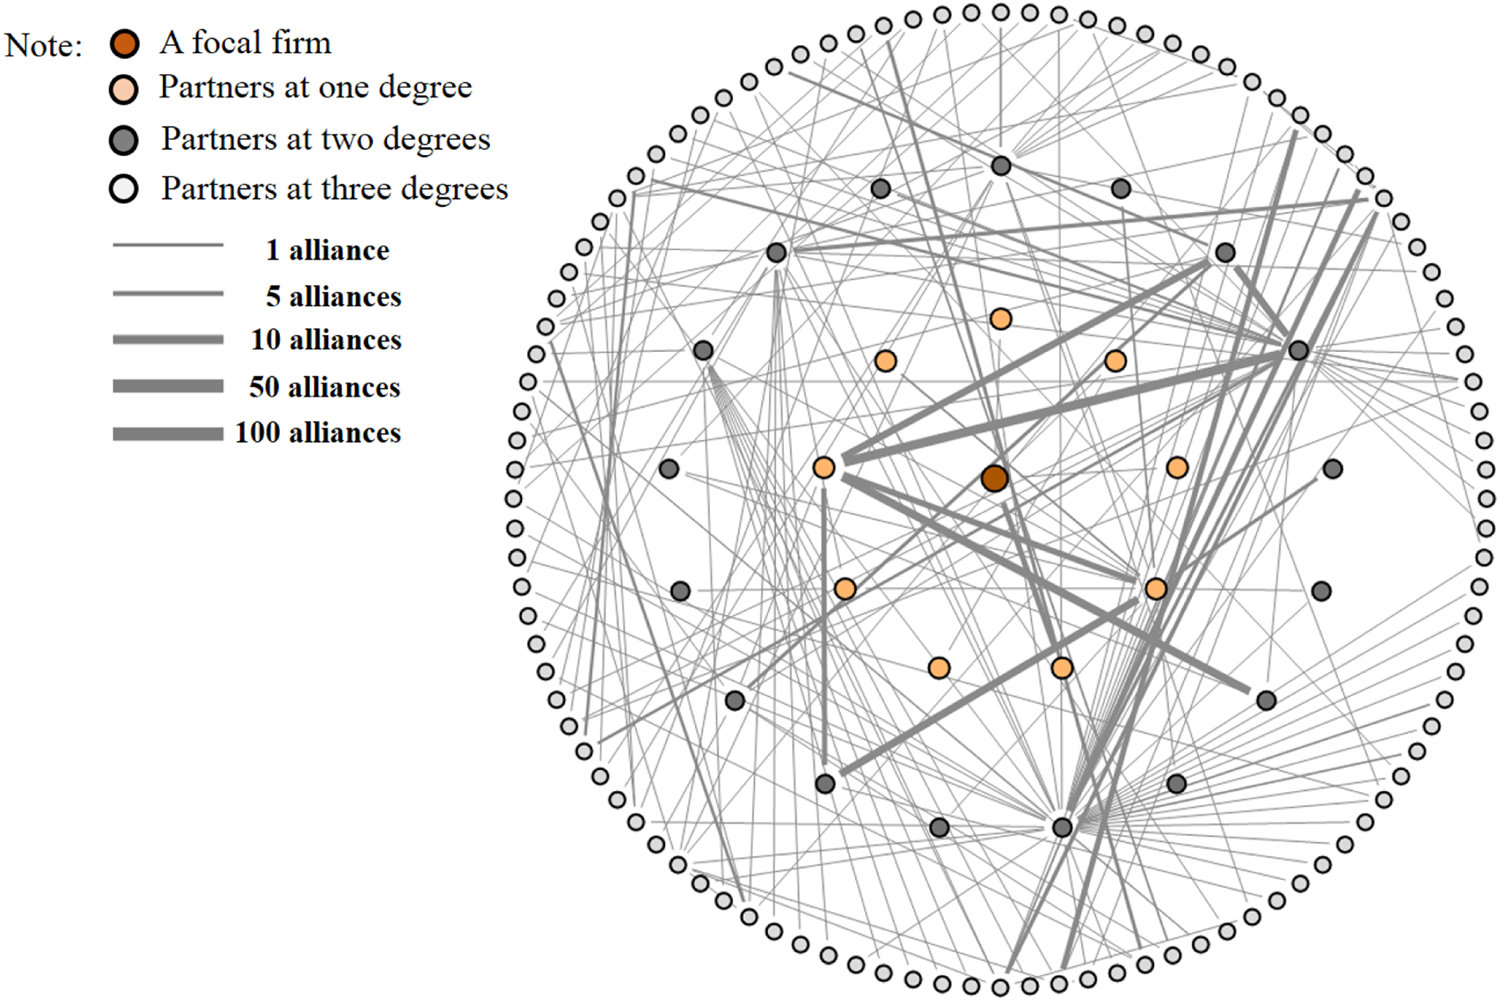
It is difficult to state exactly how long an alliance effect lasts, because they are rarely reported. Therefore, it is necessary to assume the duration of an alliance effect (Schilling & Phelps, Reference Schilling and Phelps2007). For the purposes of the study, alliance relationships were assumed to last for 3 years (Phelps, Reference Phelps2003), and extended APCs based on 3-year windows (i.e., 2007–2009, 2008–2010, and so forth to 2012–2014) were created. The result was six snapshots of 31 firms’ extended APCs, totaling 186 extended APC snapshots. Each extended APC snapshot was constructed as an undirected binary adjacency matrix. Figure 3 is an example snapshot of a firm drawn by NetMiner, a commercial social network analysis program, for the 3-year window of 2007–2009.
An example snapshot of the extended alliance portfolio configuration of a focal firm over 3 years

Measures
Dependent variables
In the bio-pharmaceutical industry, introducing a new drug can lead to a monopoly profit to the firm of 10–15 years, thus it is extremely important to secure patents. The number of patents has been shown to have a high correlation with new product introductions and invention counts (Basberg, Reference Basberg1987). The number of patents is widely used to evaluate firm innovation performance in academic literature (Wassmer, Reference Wassmer2010), and is indicative of innovation achievement from opportunity recognizing and developing capacities. To measure innovation performance, the number of patent applications for each year from 2010 to 2015 was used, focusing on the quantity of technological outputs. A 1-year time lag was used with respect to influences of the independent and control variables, similar to previous literature (Lahiri & Narayanan, Reference Lahiri and Narayanan2013; Zhang, Guan, & Liu, Reference Zhang, Guan and Liu2014), and the innovation performance variable was log-transformed to reduce positive skewness (Andrevski, Brass, & Ferrier, Reference Andrevski, Brass and Ferrier2016).
Independent variables
Structure of the extended APC
To measure the structure of an extended APC, the concept of network density was adapted. The approach used by Rowley, Behrens, and Krackhardt (Reference Rowley, Behrens and Krackhardt2000) was used, in which the number of existing ties were divided by the total possible number of ties among partners at one, two, and three degrees in each of the 186 snapshots. If this variable decreased, the sparseness of an extended APC becomes larger. The network density calculation for an extended APC of a firm i affecting innovation performance is as follows:
 $$(Network\,Density)_{i} {\equals}{{2t} \over {n(n{\minus}1)}}$$
where t is the number of connections between nodes and n the number of nodes.
APC size
As described above, two variables (NOA and NOP) were used. The NOA is based on degree centrality as proposed by Freeman (Reference Freeman1978), which measures the number of ties of a node. Ties can be defined as the weighted value between a set of two nodes that represent the firm. A single tie strength increases from 1 to as many times as they have repeatedly made alliances. Here, the concept of the weight of alliance was added, as the strength of alliances of a focal firm would be weaker the further they are from a focal firm. The weight of alliance was set to 1:0.67:0.4, depending on the distance from the focal firm (one degree, two degrees, or three degrees) in each alliance. This concept is based on the spread of happiness at the individual level (Christakis & Fowler, Reference Christakis and Fowler2009). According to this principle, the total number of ties of a focal firm in an extended APC was added without duplication. The NOP of a focal firm is represented by the number of nodes to which a node is adjacent, regardless of the strength of the ties. Like NOA, all focal firms in an extended APC were added with the same weighting rule to calculate NOP.
Controls
Six control variables were considered that may directly affect the dependent variable or have some characteristics that describe the focal firms. First, previous innovation performance was controlled. Firms that performed well in the past are also likely to do so in the future (Tsai, Reference Tsai2001). Thus, the performance measures were included for previous years (2009–2014). Second, annual R&D expenditures are a significant determinant of innovation performance (Bae & Insead, Reference Bae and Insead2004; Phelps, Reference Phelps2010), and positively affects firm innovation through increased expenditures. These were log-transformed to reduce positive skewness during the same time period (Andrevski, Brass, & Ferrier, Reference Andrevski, Brass and Ferrier2016). Third, the firm’s age was considered as a control variable (Zaheer & Bell, Reference Zaheer and Bell2005). Older firms are more likely to perform better as they possess numerous advantages, including established reputations, brand value and recognition, and developed social networks (Zaheer & Bell, Reference Zaheer and Bell2005). Firm age was measured by using the number of years since the date of incorporation. Fourth, the number of employees was included to control firm size, since larger firms could have a greater number of patents (Koka & Prescott, Reference Koka and Prescott2008). Fifth, many prior studies have concluded that the APC size at one degree positively effects innovation performance (Deeds & Hill, Reference Deeds and Hill1996; Baum, Calabrese, & Silverman, Reference Baum, Calabrese and Silverman2000; Oliver, Reference Oliver2001; Owen-Smith & Powell, Reference Owen-Smith and Powell2004). In this case, both NOA and NOP were controlled. Finally, year dummies were used in the models to control for economy-wide shocks (Uotila, Maula, Keil, & Zahra, Reference Uotila, Maula, Keil and Zahra2009). All of these variables were included in order to increase the reliability of the test results while examining the effects of the size and sparseness of extended APCs on innovation performance.
ANALYSIS AND RESULTS
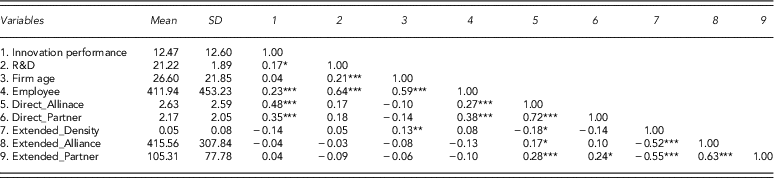
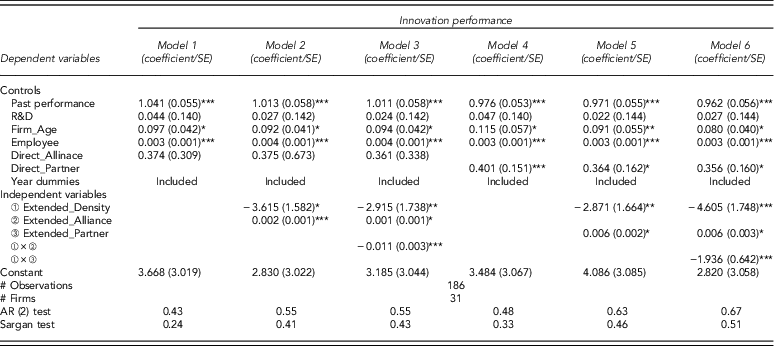
The data included balanced longitudinal data sets and the models were estimated using the two-step generalized method of moments of Arellano and Bond (Reference Arellano and Bond1991), which involved transforming the equation into first differences. This method also used the lagged values of the endogenous variables as instruments. This procedure was used to obtain estimates for the dynamic longitudinal model using version 11.0 of STATA statistical software. This methodology should satisfy two tests: the Sargan test and the autoregressive (AR) (2) test. The Sargan test – where the null hypothesis is that the over-identifying restrictions are valid – was suitable for using instrumental variables. The AR (2) test for second-order serial correlation – where the null hypothesis is that there is no second-order autocorrelation in the differenced residuals – was used to determine whether there were autocorrelations in the original models. To reduce the potential of multicollinearity, the variables related to the NOA (Direct_Allinace, Extended_Alliance) and NOP (Direct_Partner, Extended_Partner), including the interaction terms, were separated (Mazzola, Perrone, & Kamuriwo, Reference Mazzola, Perrone and Kamuriwo2016). First, the baseline models were introduced in Models 1 and 4. In Models 2 and 5, three variables were incorporated to test Hypotheses 1, 2, and 3. Next, the interactions were added in Models 3 and 6 to test Hypothesis 4. To check for possible multicollinearity, an additional variance inflation factor analysis was conducted in these models, specifically between the independent and moderating variables. The results were well below the threshold value of 10. Table 1 presents the correlation matrix and the descriptive statistics for the data set, and Table 2 shows the standardized coefficients for the explanatory variables. None of the models in Table 2 encountered problems regarding the over-identification of restrictions and second-order serial correlations when controlled with the two-step generalized method of moments method. Therefore, it was concluded that all of the models were suitable for the two-step generalized method of moments. Additionally, several robustness checks were carried out. First, the dependent variable was replicated with other financial variables – for example, Return On Investment and Return On Assets – based on the research of Faems, De Visser, Andries, and Van Looy (Reference Faems, De Visser, Andries and Van Looy2010) which connects innovation and financial performance. Second, the fixed and random effect models were also used to regress innovation performance. Third, a 5-year window was created to check robustness. It was concluded that these results were largely consistent with those presented in Table 2.
Means, SD, and correlations

Note. Year dummies are included, but not shown.
*p<.05; **p<.1; ***p<.01.
Two-step generalized method of moment estimates for innovation performance

Note. AR=autoregressive.
*p<.05; **p<.1; ***p<.01.
Hypothesis 1, which states that the sparseness of the extended APC will positively affect firm innovation, is supported in Models 2, 3, 5, and 6. Hypotheses 2 and 3, which state that the integrated NOA and partners in the extended APC will positively affect firm innovation, is supported in Models 2, 3, 5, and 6. Finally, Hypothesis 4, which states that an increased sparseness of the extended APC will strengthen the positive relationship between size and firm innovation, is supported in Models 3 and 6.
Discussion
Competitiveness in business is the norm, and all modern firms are faced with it. Firms that fail to perform in a competitive environment, stands the chance of having to close. In order for firms to survive and thrive, they must have a competitive advantage. This is achieved by continuous innovation. Innovation is not created solely by internal resources, but requires external partners, like SpaceX needed NASA. Firms form unique collaboration networks with these external partners, and these networks are thought of as inimitable and nonsubstitutable assets that facilitates access to unique resources and capabilities (Gulati, Reference Gulati1999).
This study adheres to the existing definition of an APC – a focal firm’s egocentric network – and focuses on the extension of the APC research on focal firms. It emphasizes the importance of external capability for improved innovation performance and has recently received significant attention in strategic alliance literature (Kim & Choi, Reference Kim and Choi2014a; Wassmer, Li, & Madhok, Reference Wassmer, Li and Madhok2016). Although there is significant prior literature on the positive effects of external networks on focal firms (Ahuja, Reference Ahuja2000a; Gulati, Nohria, & Zaheer, Reference Gulati, Nohria and Zaheer2000; Zaheer & Bell, Reference Zaheer and Bell2005; Andrevski, Brass, & Ferrier, Reference Andrevski, Brass and Ferrier2016), this study was motivated by three new goals.
First, the scope of prior APC research rarely exceeded the first degree of alliances to the focal firm. In this respect, the initial question was whether the scope affecting a focal firm ends at one degree. In sociology, it is generally accepted that the extent of the influence on other people reaches up to three degrees. However, it is yet to be accepted that the extent of the influence could be more than one degree in APC research in management, although the reasons for this are not clear. It may be due to the impact of indirectly connected partners being relatively negligible or to the lack of computing ability described in second section. Therefore, this study first intended to expand the APC research, as external alliances that affect a focal firm’s resources do not end at one degree. As explained in Figure 1, it is a reasonable statement that even though there are focal firms with the same APC at one degree, the compositions of partners at two or three degrees could differ. These differences mean that focal firms have different resource accessibilities, although thus far, these APCs were thought to the same. In this study, four hypotheses were introduced and supported. In real practice, one can observe partners, partners’ partners, or partners’ partners’ partners of a firm that a focal firm would have alliances with. Therefore, the effort to understand a focal firm’s extended APC is both important and meaningful. Ahuja (Reference Ahuja2000a) only studied direct and indirect alliances. His study differs from this study in that he did not examine the extended APC from an integrated network perspective, but rather focused on separating direct and indirect ties and understanding the NOA. Additionally, he did not consider other dimensional attributes of the extended APC, such as density. Accordingly, this study can provide unique insights into the extended APC, where strategic action and social structure are closely intertwined.
Second, and in line with Wassmer’s (Reference Wassmer2010) recommendations for future research, prior studies may have missed the key point of distinguishing between NOA and NOP:
Most studies examining alliance portfolio size have taken a one-dimensional view in the sense that they focus mainly on one aspect of size, namely the number of alliances, but neglect a second important dimension, namely the number of partners a focal firm has in its alliance portfolio (Wassmer, Reference Wassmer2010: 153).
Therefore, this study adopted two size variables (NOA and NOP) and showed not only that these two variables vary significantly as the degree increases from a focal firm (where the correlations between the NOA and the NOP at one degree and at the extended APC are 0.72 and 0.63, respectively), but also that they have a different effect on firm innovation. This difference is due to the repeated partnerships of the two firms’ alliances (Kim & Choi, Reference Kim and Choi2014a). Network theory states that the NOA in a focal firm’s APC represents the number of ties, while the NOP represents the number of nodes. Theoretically, a focal node can have one to five partners when it has five ties. This is because the NOP could vary depending on how many ties the focal node has with the same partner. For example, a focal firm could have one partner in five alliances, while another firm could have up to five partners in five different alliances. Finding prior studies that strictly distinguish between the concepts of NOA and NOP has been problematic, as Wassmer (Reference Wassmer2010) pointed out. In this study, we found that the two are distinguished at one degree in the extended APC, and that both NOA and NOP in the extended APC have positive effects on firm innovation. This new discovery is motivation for further research.
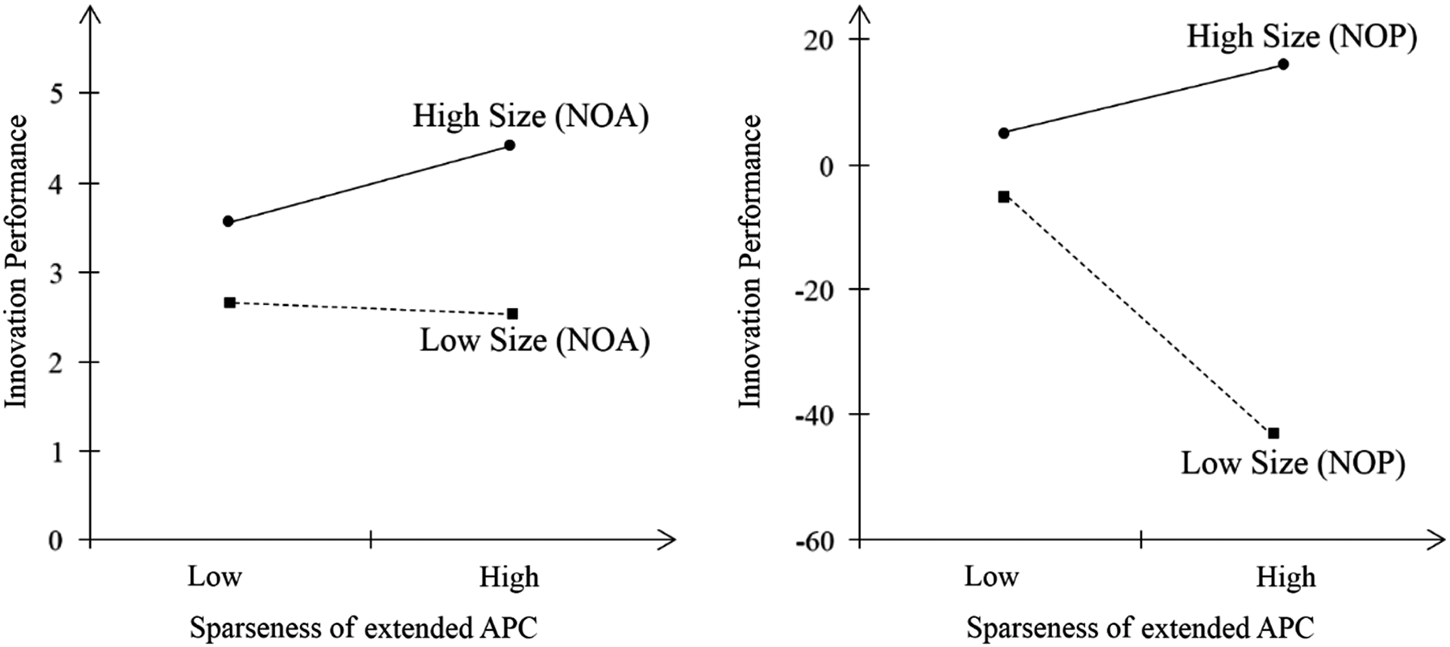
Third, this study contributes to the existing APC literature by addressing the recent call for further research on the interrelationships between size and structural dimensions. According to the review articles of Wassmer (Reference Wassmer2010) and Phelps, Heidl, and Wadhwa (Reference Phelps, Heidl and Wadhwa2012), the existing literature tends to focus on independent dimensions including size, structure, relationships, and partners, rather than the simultaneous study of interdependent dimensions. By emphasizing the importance of interrelationship research on these dimensions, a few scholars have started research from this perspective (Kim & Choi, Reference Kim and Choi2014b; Andrevski, Brass, & Ferrier, Reference Andrevski, Brass and Ferrier2016). From this perspective, the interaction between the extended APC’s structure and size (Hypothesis 4) has great significance. In this study, it is not only shown that the size of the extended APC is important, but also that its effect is increased as the number of nonoverlapping partners is structurally increased. This interpretation is reinforced by plotting the effect of the interaction on innovation performance. For ease of presentation and interpretation, the dependent variables, independent variables, and constants in Models 3 and 6 (Table 2) are used to form equations that calculate these effects. Figure 4 presents the interaction plot of sparseness and size variables of an extended APC to illustrate the magnitude of the interaction effects. The ‘Low Size’ line shows the slope of the effect of sparseness on innovation performance when the size value variables (Extended_Alliance, Extended_Partner) are set to 1 SD below its mean. The end points of the line are calculated at 1 SD below and above the means of the size variables. The ‘High Size’ line represents the effect of sparseness on innovation performance when the value of size variables are set to 1 SD above its mean.
Graph of interactions based on Models 3 and 6 of Table 2. APC=alliance portfolio configuration; NOA=number of alliances; NOP=number of partners

Based on these findings, it can be suggested that alliance managers increase the quantity of their partners to have more partners and partners’ partners, but not be connected to each other at two and three degrees. To be more realistic, it would take combining a firm’s opportunity recognizing and developing capacities. This has important implications given that thus far, the theoretical aspect has been overemphasized and neglected regarding the practical significance it provides (Andrevski, Brass, & Ferrier, Reference Andrevski, Brass and Ferrier2016).
CONCLUSION
Thus far, this study has explained a firm’s capability in terms of both internal and external capabilities (Zaheer & Bell, Reference Zaheer and Bell2005). Resource-based view scholars concentrated on internal capability, while network scholars focused on external capability. This study examined extended technological APC and firm innovation among Korean bio-pharmaceutical firms, focusing on the effects of the latter. Not all combinations of APC attributes lead to advantages. Therefore, it is important to understand how certain attributes can affect innovation performance. In this study, it was found that the extended APC characteristics affect innovation performance. The study presented interesting views on what effects the extended APC has on innovation performance, while presenting a new perspective that can assist in making a more concise and conclusive study of prior research. By understanding the network through comparison with competitors in practice, it is also possible for firms to judge which firm to form a strategic alliance with in the future. However, this study may not necessarily be applicable to all industries. Therefore, additional research in other industries is required to determine their ideal APC. Fundamentally, our empirical study may guide researchers and managers in an attempt to expand this research. This can provide a new perspective that introduces the extended concept of APC to other industries and develop new APC variables that may produce many additional and interesting research themes.