Introduction
Gunshot residue (GSR) evidence is used forensically to determine if a firearm was discharged. The most common gunpowder is smokeless powder which consists of organic and inorganic components that make up the energetics, stabilizers, plasticizers, flash suppressants, deterrents, opacifiers, and dyes.[1] According to ASTM 1588-10,[2] GSR is exclusively identified by its morphology and the presence of lead, barium, and antimony measured by scanning electron microscopy with energy-dispersive x-ray spectroscopy (SEM-EDX). Recently, manufacturers have started producing lead-free ammunition, so analysis has shifted to the SEM-EDX detection of gadolinium, titanium, zinc, gallium, copper, tin, titanium, and strontium found in the GSR. A combination of the above, or just one of these elements, is considered consistent with GSR identification.[Reference Maitre, Kirkbride, Horder, Roux and Beavis3] The issue with this approach is that some of these elements can also be found in the environment, in fireworks, and in some paints, thus creating the increased potential for false positives.[Reference Taudte, Beavis, Blanes, Cole, Doble and Roux4] Recently, Raman spectroscopy has been used for the identification of GSR due to its ability to detect both the organic and inorganic components. Advances in Raman analysis of GSR are summarized by Doty and Lednev[Reference Doty and Lednev5] as well as Suzuki and Buzzini,[Reference Suzuki and Buzzini6] in addition to the recent reviews by Maitre et al.[Reference Maitre, Kirkbride, Horder, Roux and Beavis3] and Brozek-Mucha[Reference Brożek-Mucha7]. One drawback with Raman spectroscopy is its low sensitivity. Surface-enhanced Raman spectroscopy (SERS) overcomes this by using metal nanoparticles, typically gold, silver, or copper, to enhance the analyte's signal via chemical or electromagnetic enhancement.[Reference Haynes, McFarland and Van Duyne8] SERS applications to GSR have also been summarized by Suzuki and Buzzini.[Reference Suzuki and Buzzini6]
The most recent work involving GSR SERS uses a gold substrate to identify organic components of low explosives. These investigators used a Raman microscope and a 633-nm helium–neon laser to analyze mixtures of DPA, DPA—nitrated derivatives, ethyl centralite (EC), and 2,4-dinitrotoluene deposited on films. They showed that most bands that occur in the Raman spectra of different smokeless gunpowders are attributed to DPA and its derivatives. They further showed that discriminant analysis (DA) using Raman spectra showed better differentiation potential than DA using FTIR spectra when the presence of DPA or dinitrotoluene is considered.[Reference Lopez-Lopez, Merk, Garcia-Ruiz and Kneipp9]
SERS has also been extended to portable Raman spectrometers in the analysis of forensic samples. The use of a portable Raman spectrometer allows for low-cost analysis directly at the crime scene, in addition to minimal analysis time due to the simplicity of operation. Izake[Reference Izake10] presents the applications of SERS and portable Raman spectroscopy to forensics and homeland security applications. More recently, Liszewska et al.[Reference Liszewska, Bartosewicz, Budner, Nasiłowska, Szala, Weyher, Dzięcielewski, Mierczyk and Jankiewicz11] evaluated five SERS substrates for the trace detection of explosive materials using portable [i-Raman® Plus (B&W Tek)] and handheld [IDRaman mini 2.0 (Ocean Optics)] spectrometers and showed the detection of concentrations from single to hundreds of μg/cm2 depending on the explosive material and the Raman spectrometer used.
Kondo et al.[Reference Kondo, Hashimoto, Ohrui, Sekioka, Nogami, Muta and Seto12] analyzed 22 chemical warfare agents (CWAs) in the liquid or solid state using a portable Rigaku–Xantus-2 Raman spectrometer without SERS. Using a 785 nm excitation, they identified all 20/22 CWAs and obtained greater peak resolution and higher relative peak intensities compared to using a 1064 nm excitation in the spectral region below 1000 cm−1. Use of the 1064 nm excitation resulted in the identification of all 22 CWAs. Spectral regions greater than 1000 cm−1 showed similar peak intensities and resolution when using 1064 nm compared to 785 nm excitation.
Hager et al.[Reference Hager, Farber and Kurouski13] report on the use of the Rigaku Progeny handheld Raman spectrometer (without SERS) with 1064 nm excitation for the identification of urine on cotton and polyester fabric for forensic application. Coupling to partial least squares-discriminant analysis (PLS-DA) allowed for high-accuracy predictions of urine presence on all studied types of fabrics.[Reference Hager, Farber and Kurouski13] Wiktelius et al.[Reference Wiktelius, Ahlinder, Larsson, Höjer Holmgren, Norlin and Andersson14] used spectra from a handheld First Defender RMX at 785 nm excitation and a handheld Rigaku Progeny™ Analyzer (1064 nm excitation) (both without SERS) and ATR-IR instruments in synthesis route attribution of liquid CWAs by multivariate modeling. They obtained 83% correct classification.
The above illustrates that portable Raman spectroscopy, with and without SERS, has been successfully applied to the analyses of forensic samples. The goal of this work is to show the capabilities of a Rigaku Progeny X2 portable Raman spectrometer in the solution detection of two major gunpowder stabilizers, DPA and EC, in acetone, acetonitrile, ethanol, and methanol. Solution analysis allows for minimal preparation time and eliminates the issue of non-homogeneity in a solid sample. In addition, it avoids potential pyrolysis or ignition of the gunpowder.[Reference Harvey, Peters and Wright15,Reference McNesby, Wolfe, Morris and Pesce-Rodriguez16] This study presents the signal detection limit (SDL), limit of detection (LOD), and limit of quantitation (LOQ) of DPA and EC in acetone, acetonitrile, ethanol, and methanol. We further report on the effect that gold nanoparticles have on the peak area, peak position, peak width, and SDL of DPA bands at 995, 1028, 1220, and 1604 cm−1. To the best of our knowledge, this is the first work involving the application of portable Raman spectroscopy to the analysis of GSR components with and without SERS detection.
Materials and methods
Materials for nanoparticle synthesis
Cercis canadensis flowers were collected by hand on the campus of Towson University. After freezing with liquid nitrogen, the flowers were stored at −50 °C until use. Materials for synthesis include acetonitrile (Fisher Chemical, 99%), polyvinylpyrrolidone (Sigma-Aldrich, average MW ~25,000), hydrogen peroxide (Fisher Chemical, 30% v/v), potassium bromide (99%, Fisher Chemical), sodium borohydride (Fisher Chemical), and chloroauric acid trihydrate (Sigma Aldrich).
Materials for Raman analysis
EC (Supplementary Fig. S1) was obtained from Sigma-Aldrich. DPA (Supplementary Fig. S2) and reagent grade acetone, acetonitrile, ethanol, and methanol were purchased from Fisher Chemical. All chemicals were used without purification.
Solution preparations
Calibration standards were prepared for DPA at concentrations from 195.6 to 985.5 mM and for EC at concentrations from 123.3 to 622.7 mM. Three solutions containing AuNPs were prepared by adding 0.5 mL AuNP solution to 4.5 mL, 195.6 mM DPA in acetone or acetonitrile (0.5 mL AuNP:4.5 mL DPA), 1.0 mL AuNP:4.0 mL DPA, and 1.5 mL AuNP:3.5 mL DPA. Solutions were vortexed for 20 s. Solubility issues occurred when we added 2.0 mL AuNP to 3.0 mL DPA solution, thus limiting the volume ratio of AuNP:DPA to 2:3 at this DPA concentration of 195. 6 mM.
Detection limits
The SDL, LOD, and LOQ were calculated using Eqs. (1)–(3), where y blank is the mean signal from seven blanks and σ is the standard deviation measured for each peak of the analyte solution (n = 7) at the lowest standard concentration (197.8 mM for DPA and 123.6 mM for EC). The slope of the calibration curve is m.


Apparatus
A Progeny X2 handheld Raman spectrometer measuring 138 mm width × 274 mm depth, 98 mm height, and weighing 3.7 kg was used in this study. This instrument was graciously donated to Towson University by Rigaku Corporation. The spectral range is 200–2000 cm−1 with laser output 30–490 mW. This instrument has two sources, 785 nm laser (with 7–10 cm−1 spectral resolution, 20 ms–10 s analysis speed, and thermos electrically (TE)-cooled CCD detector) and 1064 nm laser (with 15–18 cm−1, 20 ms–10 s analysis speed, and TE-cooled InGaAs detector). The sample holder accommodates powders, liquids, and solids, and we used it by adding solutions to a 4 mL glass vial which was then capped. We operated in an AC mode, but it has 1 h battery capability. On the backside panel, there is a USB port for internal PC file access and another for external PC control compatible with Micro 2020, Windows XP/Vista/Win 7 software.
Raman spectroscopic analysis
Raman spectra were acquired using the 785 and 1064 nm laser wavelengths at 300 and 150 mW with 1000 ms integration time and by averaging 16 spectra. The instrument was calibrated before each use with a benzonitrile standard (Rigaku) followed by the acquisition of the solvent blank. Solvent blanks were subtracted. All sample spectra were measured in triplicate.
Preparation of Cercis canadensis (Eastern redbud) extracts
Cercis canadensis (Eastern redbud, ERB) flowers were taken from the freezer, thawed, dried, and weighed. The flowers were submerged in flasks containing the organic solvent acetonitrile in a 1 g flower: 3 mL solvent ratio. After incubating in a refrigerator for 24 h, the solution was filtered using 0.22-µm disposable filters into scintillation vials and stored in a refrigerator for later use.
Synthesis of monometallic gold nanoparticles
Monometallic gold nanoparticles were synthesized using the ERB extracts as a mild reducing agent, then fully reduced using a solution of 5 mM NaBH4. Scintillation vials were cleaned with aqua regia and rinsed with Milli-Q water before synthesis. To a 125-mL Erlenmeyer flask was added 19.65 mL, 0.35 mM HAuCl4, 0.786 mL, 1 M PVP, 19.65 mL, 5 mM H2O2, 78.6 µL, 1 mM KBr, and 257.179 µL ERB extract, followed by the rapid injection of 9.825 mL, 5 mM NaBH4. After the addition of NaBH4, the batch was heated at a gentle boil (~95 °C) for 2 h to improve yield.
Nanoparticle characterization
The gold nanoparticles that were synthesized were characterized using UV–Vis, fluorescence spectroscopy, and scanning electron microscopy. Supplementary Fig. S3a proves the formation of nanoparticles. The shoulder at 530 nm, the quenching of fluorescence, the bright spots in the scanning electron microscope are characteristic of metallic nanoparticle formation. Supplementary Fig. S3d shows the average size distribution and Supplementary Fig. S3e shows the energy-dispersive x-ray spectrum (EDS) to prove that the particles are indeed made up of 100% gold.
Data analysis
The background consisted of either the cuvette or the cuvette with solvent. All solution spectra were normalized to the acetone peak at 786 cm−1 or acetonitrile peak at 918 cm−1 using Microsoft Excel. Excel was used to calculate relative standard deviation (RSD) and to carry out a two-tailed, unpaired, unequal variance t-test. Results were considered statistically significant for P < 0.05. Origin (Version 6.0) was used to determine peak widths, peaks areas, and peak positions.
Results
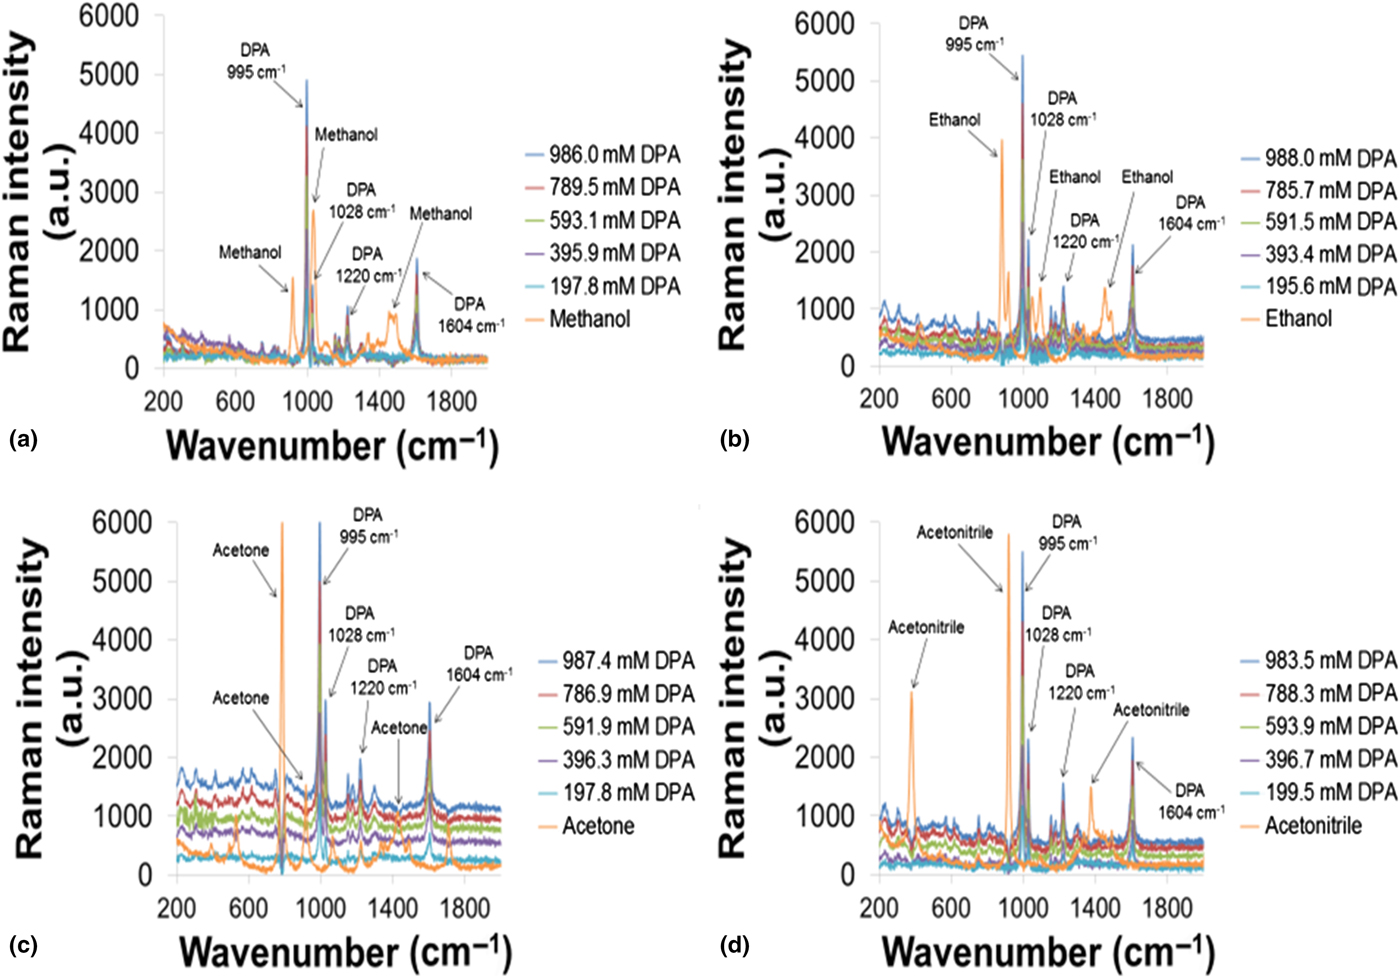
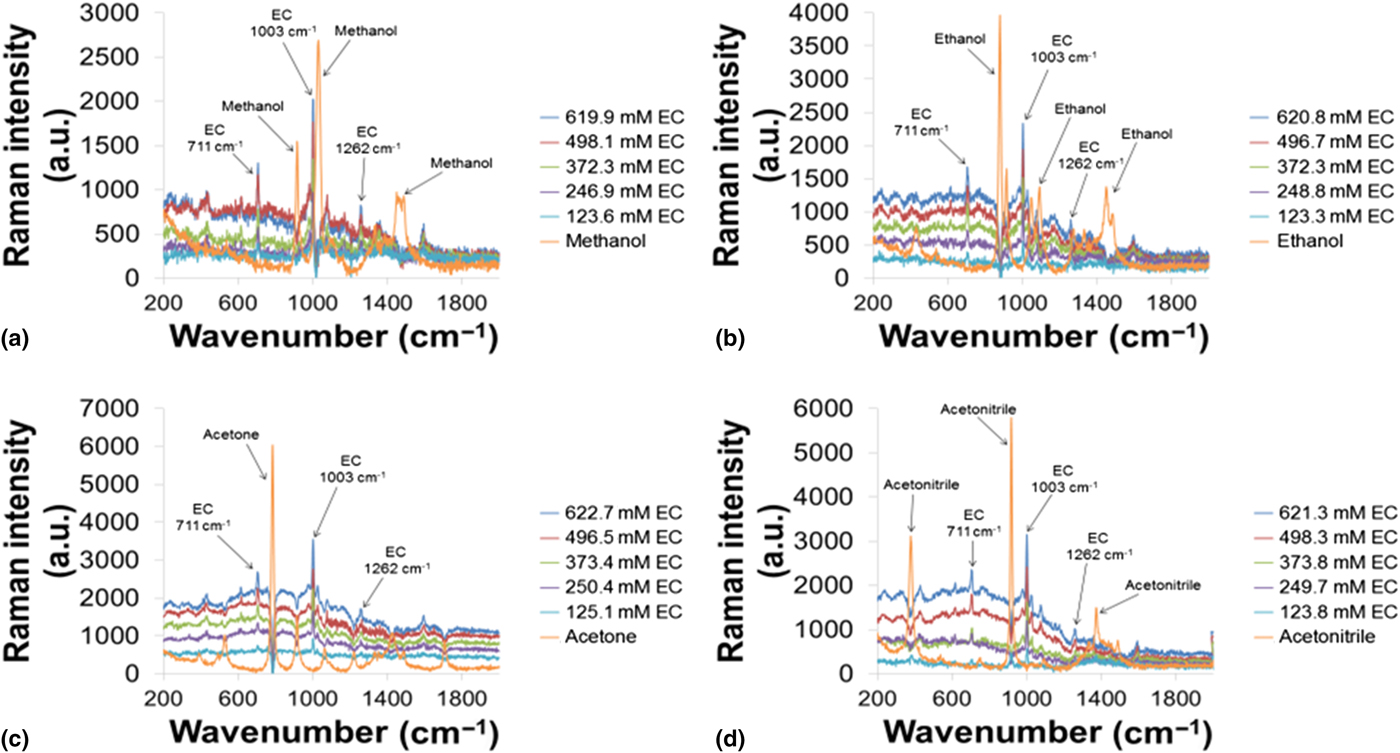
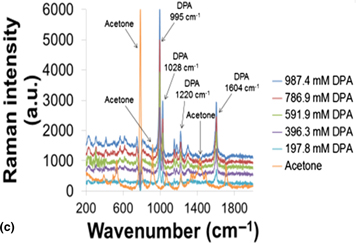
Raman spectra were obtained at 785 and 1064 nm at 300 and 150 mW. Signal intensity increased up to a factor of two when using 785 nm at 300 mW compared to 150 mW. Spectra obtained using 785 versus 1064 nm produced better peak resolution, lower fluorescence, and greater peak intensities. Therefore, all spectra were acquired using 785 nm and 300 mW (Supplementary Fig. S4). The Raman spectra of DPA and EC in acetone, acetonitrile, ethanol, and methanol are shown in Figs. 1 and 2 at concentrations from 197 to 988 mM for DPA and 123 to 622 mM for EC. They show bands at 995, 1028, 1220, and 1604 cm−1 for DPA and three bands at 711, 1003, and 1262 cm−1 for EC in acetone and acetonitrile. Solvent peaks are also labeled. The DPA signal at 995 cm−1 likely represents the simultaneous stretching of C–C bonds in one of the ring systems, a phenomenon known as “ring breathing”.[Reference Sett, De, Chattopadhyay and Mallick17] The signal at 1028 cm−1 likely represents C–H in-plane outer ring angle bending.[Reference Sett, De, Chattopadhyay and Mallick17] The signal at 1220 cm−1 likely represents N–H bending.[Reference Sett, De, Chattopadhyay and Mallick17] The signal at 1604 cm−1 likely represents C–C bending.[Reference Sett, De, Chattopadhyay and Mallick17] The EC signal at 711 cm−1 likely represents ring out-of-plane bending.[Reference Zeng, Qi, Bai, Chung Yu and Shih18] The signal at 1003 cm−1 likely represents C–C–C symmetrical stretching, also indicative of the ring breathing phenomenon.[Reference Zeng, Qi, Bai, Chung Yu and Shih18] The signal at 1262 cm−1 likely represents C–N stretching or H–C–H twisting.[Reference Zeng, Qi, Bai, Chung Yu and Shih18]
Calibration curves for DPA in (a) methanol, (b) ethanol, (c) acetone, and (d) acetonitrile.
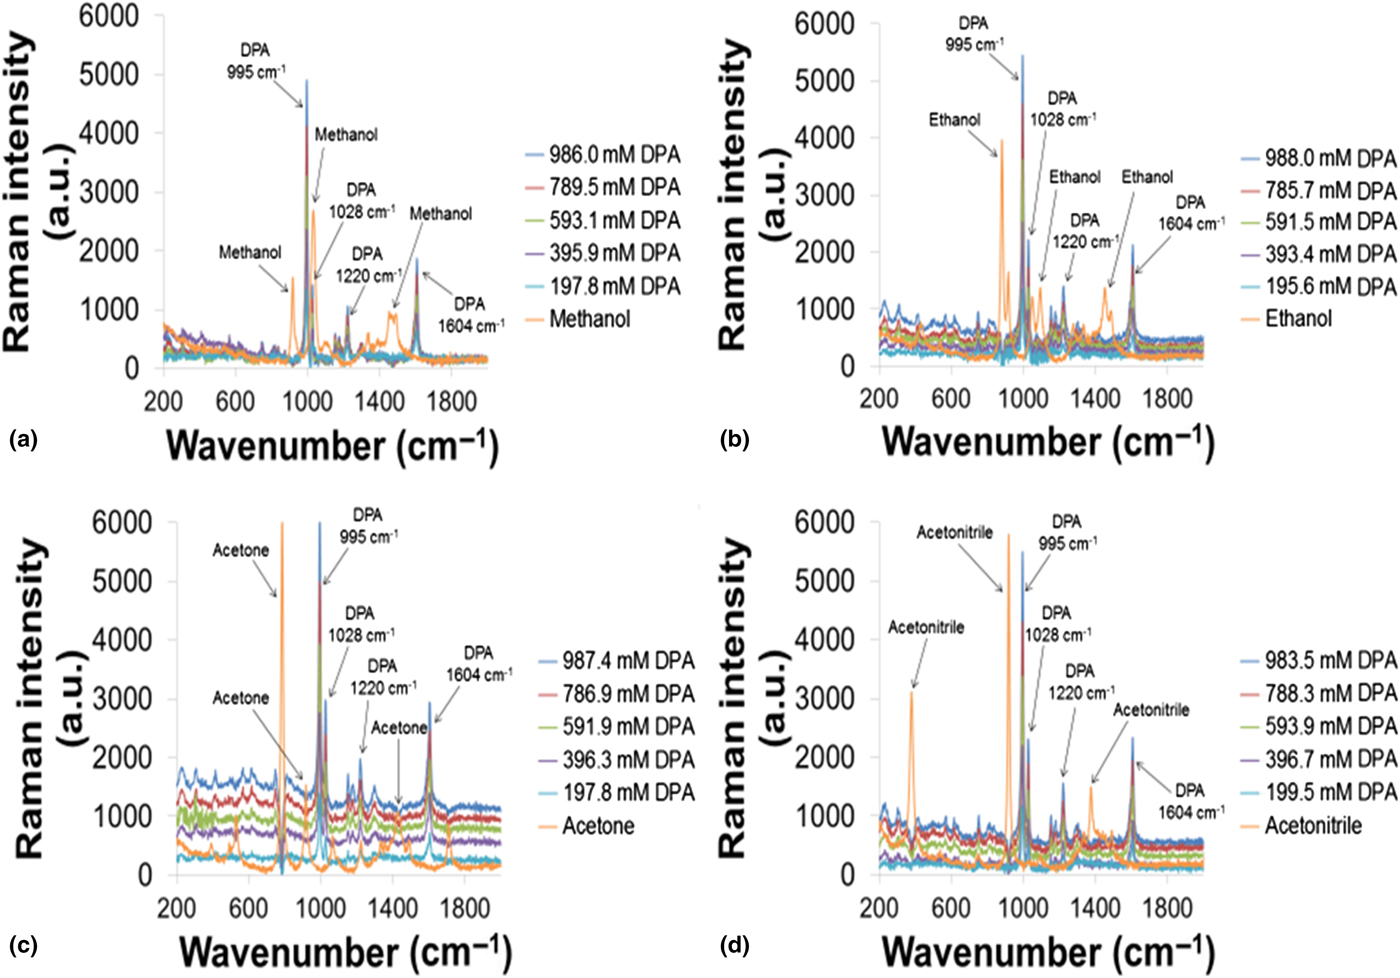
Calibration curves for EC in (a) methanol, (b) ethanol, (c) acetone, and (d) acetonitrile.

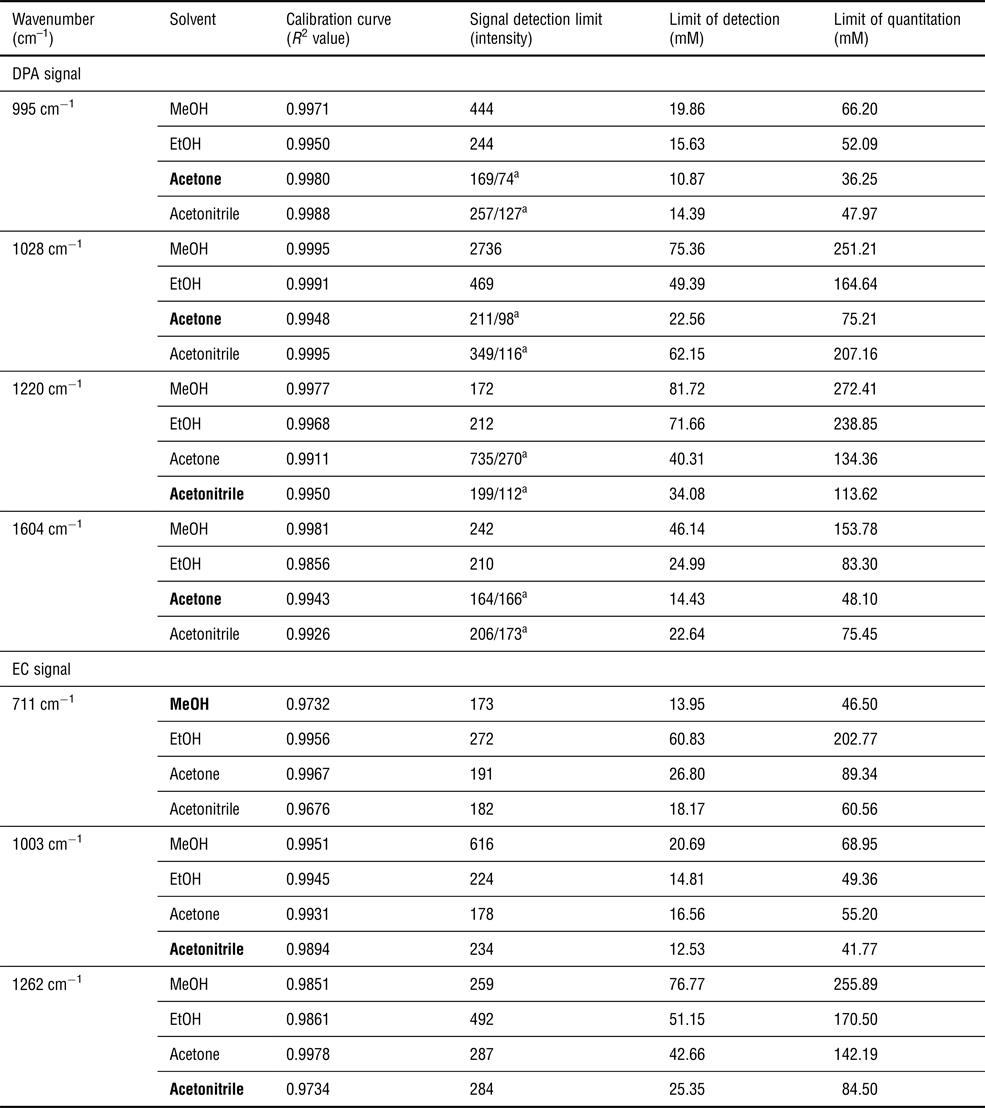
Figures 1 and 2 show the DPA and EC band intensities increase linearly with increasing DPA and EC concentrations. Calibration curves (Supplementary Figs. S5–S8 show DPA as an example) produced R 2 values that ranged from 0.9732 for the EC 711 cm−1 peak in MeOH to 0.9995 for the DPA 1028 cm−1 peak in MeOH. Acetone yielded the lowest SDL (as well as LOD and LOQ) for DPA at 995, 1028, and 1604 cm−1. Acetonitrile yielded the lowest SDL, LOD, and LOQ for DPA at 1220 cm−1 and for EC at 1003 and 1262 cm−1. Methanol yielded the lowest SDL, LOD, and LOQ for EC at 711 cm−1 (Table I).
SDL, LOD, and LOQ for DPA and EC in each solvent.

SDL for DPA in acetone and acetonitrile. Bolded solvents show lowest LOD.
a Signal detection limit measured for DPA with AuNP solution for acetone and acetonitrile.
Based on the above results, we continued our analysis using acetone and acetonitrile. Figure 1 shows the intensities of the DPA bands at 995, 1028, and 1604 cm−1 are significantly greater than all but one of the EC bands (1003 cm−1) offering greater potential for a larger signal-to-noise ratio (S/N) when using DPA. In addition, the R 2 values are slightly greater for DPA than EC. We therefore focused our AuNP study using DPA.
To our lowest DPA standard, at 197.8 mM in acetone and 199.5 mM in acetonitrile, we next added either 0.50 mL AuNP, 1.0 or 1.5 mL AuNP solution. Each solution was run in triplicate and the peak area, peak position, full width at half maximum (FWHM), and SDL calculated. These parameters were compared to the same parameters for the same peaks in the solution containing only DPA. Adding the AuNP solution to DPA resulted in an increase for all DPA peak areas in acetone. In acetonitrile, there is a decrease in all DPA peak areas (Supplementary Table S1).
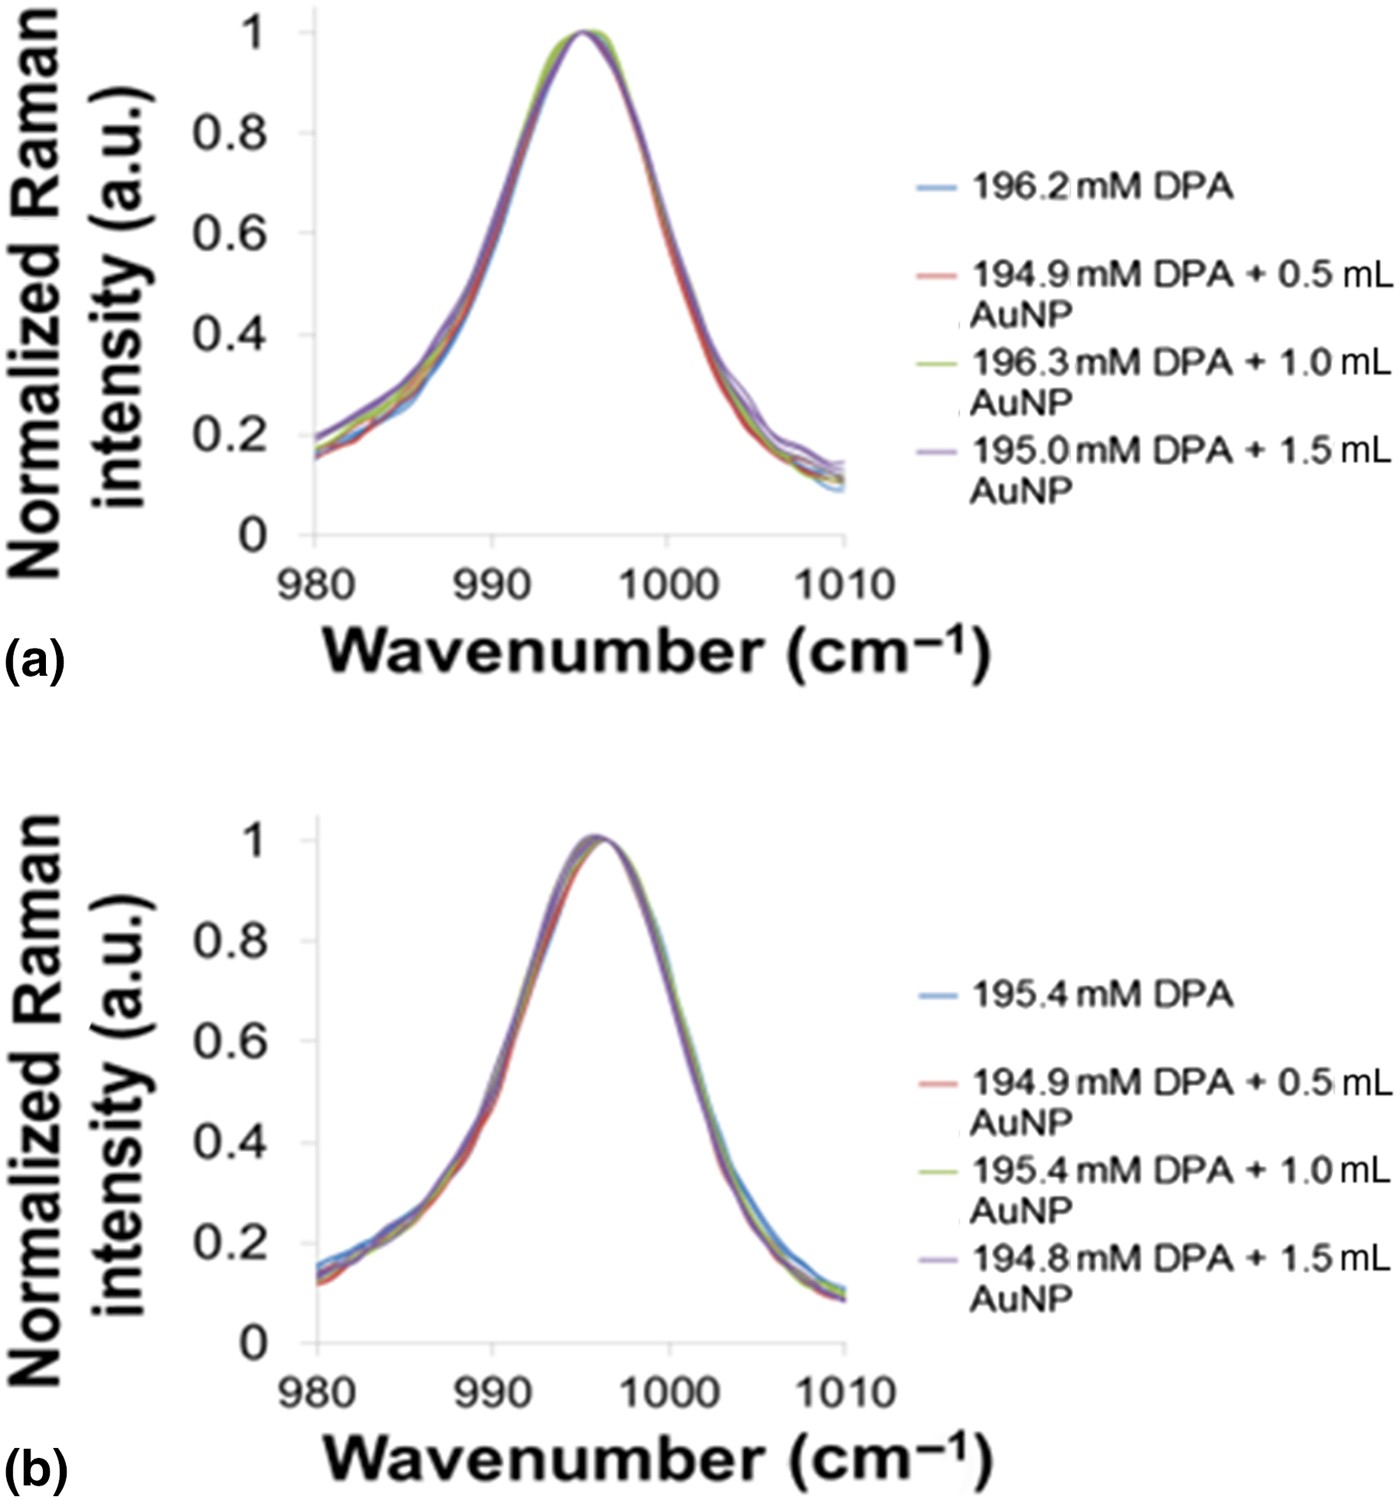
Peak position and FWHM were next compared for the solution containing DPA alone to that containing DPA with 1.5 mL AuNP (Supplementary Table S2). In acetone, statistical differences were observed in the peak maximum for the 995 cm−1 (995.06 ± 0.20–994.90 ± 0.22 cm−1) [Fig. 3(a)] and 1220 cm−1 (1221 ± 0.66–1219.73 ± 0.78 cm−1) peaks between. Statistical differences were observed in FWHM for 995 cm−1 (6.70 ± 0.33–6.93 ± 0.0.36 cm−1) and 1028 cm−1 (6.21 ± 0.45–6.65 ± 0.48 cm−1).
Peak maximum shift for 995 cm−1 peak in (a) acetone and (b) acetonitrile.

In acetonitrile, statistical differences were observed in the peak maximum for the 995 cm−1 (996.00 ± 0.21–995.68 ± 0.20) [Fig. 3(b)] and 1604 cm−1 (1605.8 ± 0.49–1605.17 ± 0.49 cm−1) peaks. There were no statistical differences in FWHM for any of the DPA bands in acetonitrile.
We calculated the repeatability for each DPA peak with respect to area, peak position, and FWHM in acetone and acetonitrile (Supplementary Tables S3 and S4). In both solvents, the 995 cm−1 peak showed the lowest RSD, followed by 1604, 1028, and 1220 cm−1. In both solvents, peak position showed lowest RSD, followed by peak area, then FWHM.
We also looked at the repeatability and reproducibility for all DPA peak intensities. Supplementary Table S5 shows that the RSD for repeatability is slightly lower in acetone for all peaks. Looking at the average RSDs for both solvents shows the lowest RSD for 995 cm−1 (1.90%), followed by 1604 cm−1 (3.06%), 1220 cm−1 (3.88%), and 1028 cm−1 (6.58%). We next calculated reproducibility of the DPA bands in both solvents by repeating the above measurements two more times over a period of 3 months (Supplementary Table S6). We found that reproducibility was lower in acetone for all peaks. The value 995 cm−1 gave the lowest average RSD (1.56%) in both solvents, followed by 1604 cm−1 (3.34%), 1220 cm−1 (4.87%), and 1028 cm−1 (5.06%)
Discussion and outlook
Raman spectra of DPA and EC were readily measured in acetone, acetonitrile, ethanol, and methanol, and produced peaks that increased proportionally with concentration. All analyte systems produced linear calibration curves with acceptable R 2 values. Acetone and acetonitrile produced more bands with lower SDLs. Methanol, on the other hand, produced some of the highest SDLs compared to the other three solvents. The LOD was lowest for DPA in acetone and acetonitrile for 995 cm−1 peak, followed by 1604 cm−1, then 1028 and 1220 cm−1 bands. This may be explained by the significantly greater S/N for the 995 and 1604 cm−1 peaks compared to the 1220 and 1028 cm−1 peaks. In addition, the smaller 1028 cm−1 peak appears very close to the 995 cm−1 peak. The 1220 cm−1 peak is present at an even lower intensity than the 1028 cm−1 peak, and a peak appears to grow in at ~1210 cm−1, possibly skewing the baseline of the 1220 cm−1 peak in both solvents. In addition, acetone has a peak at 1220 cm−1 which limits the LOD of the 1220 cm−1 DPA peak in acetone (40.3 mM LOD for DPA 1220 cm−1 in acetone compared to 34.08 mM LOD) for the DPA 1220 cm−1 peak in acetonitrile (see Table I). Both the 1028 and 1228 cm−1 show greater RSDs relative to the DPA peaks at 995 and 1604 cm−1 (Supplementary Tables S5 and S6). Methanol has a solvent peak centered at 1032 cm−1, which limits the LOD of the DPA peak at 1028 cm−1 and potentially interferes with the LOD of the EC peak at 1003 cm−1. Methanol also has peaks around 1500 cm−1 which could potentially interfere with the LOD of the DPA 1604 cm−1 peak.
Ethanol has a solvent peak at 1275 cm−1, which could limit the LOD of the EC peak at 1262 cm−1.
We compared our data to the smokeless powder Raman spectra obtained by Lopez-Lopez et al.[Reference López-López, Merk, García-Ruiz and Kneipp19] They were able to identify the DPA and EC bands around 995 and 1003 cm−1 for DPA and EC, respectively, whereas there is a significant signal from other smokeless powder constituents that likely limit the LOD of the 1220 and 1604 cm−1 DPA peaks. These investigators calculated the concentration of DPA and EC in a smokeless powder extract to be ~10−4 M for both, or even less for DPA, taking into account degradation.[Reference López-López, Merk, García-Ruiz and Kneipp19] The lowest LOD we calculated in the absence of AuNPs was 10.87 and 14.39 mM in acetone and acetonitrile, respectively, for 995 cm−1 which is still tenfold higher than that calculated in smokeless powders. The results we obtained with AuNPs, however, show promise, since lower SDLs were obtained for DPA in acetone and acetonitrile in the presence of the AuNPs (74 and 127 for the DPA 995 cm−1 peak, in acetone and acetonitrile, respectively), compared to the SDL obtained in the absence of AuNPs (169 and 257 for the DPA 995 cm−1 peak, in acetone and acetonitrile, respectively) (Table 1).
This increase in Raman intensity in the presence of AuNP can be attributed to electromagnetic field enhancement (EF) or chemical interaction. Typically, the signal increase is ~>103 if it is EF enhancement. In this case, we do not observe a large enhancement due to our measurements being done in solution. This decreases the local concentration of the AuNP, diminishing the probability of creation of localized plasmonic hotspots. Low signal enhancements have been exhibited in nanoparticles that were tested against human serum when the nanoparticles were coated with a protein corona.[Reference Kim, Lee, Kim, Ahn, Kim, Yu and Choi20–Reference Matricardi, Hanske, Garcia-Pomar, Langer, Mihi and Liz-Marzán21] Similarly, the limited signal enhancement is due to the following reasons: (i) the large surface ligands (the polyphenolic compounds in the plant extracts as opposed to citrate ligands used typically) increasing the interparticle distance. (ii) We believe that rather than EF enhancement, we are observing an electrostatic chemical field interaction due to dipole–dipole interaction created by changes in the refractive index of the media, (iii) an averaging effect due to the Brownian motion of the colloid and the dispersity of the sample, and (iv) the inability to increase the local concentration of the AuNP due to solvent compatibility. Near-field coupling between neighboring AuNPs can give rise to hybridized modes in clusters which could result in a further increase in signal as seen in some cases such as presented above for the 1604 cm−1 peak in acetonitrile. These resonances are usually red-shifted and broadened. Additional enhancement could be achieved via a change in pH, but this decreases reproducibility and stability of the nanoparticle system.[Reference Foti, D'Andrea, Villari, Micali, Donato, Fazio, Maragò, Gillibert, Lamy de la Chapelle and Gucciardi22]
It is further worth noting that while DPA is a common stabilizer in propellant formulations, it may also be found in the environment as a result of its use in rubber and plastic products, as an insecticide, and as a stabilizer for perfumes. EC, however, is restricted to propellant manufacturing and thus its presence with DPA is the most characteristic of gunpowder.[Reference Maitre, Kirkbride, Horder, Roux and Beavis3] The SDLs and LODs we obtained for EC in acetone and acetonitrile are on the same order of magnitude for those observed with DPA in the same solvents. In particular, there are no acetone or acetonitrile solvent peaks at the most intense EC peak at 1003 cm−1, indicating the usefulness of this peak in the dual measurement of DPA and EC in acetone and acetonitrile. There are also no acetone or acetonitrile peaks at 711 cm−1. While this peak is significantly less intense than the 1003 cm−1 peak, it is still detectable and is worth investigating with SERS.
We could not find figures of merit calculated for GSR using portable Raman spectroscopy. We did, however, note that Navin et al.[Reference Navin, Tondepu, Toth, Lawson and Rodriguez23] were able to detect ciprofloxacin down to 272 mM with RSDs from 0.69% up to 5.7% using an Enwave EZ-Raman H portable spectrometer with 785 nm excitation (without SERS). Deng et al. used a portable Raman spectrometer (Metage, UK) with silver nanoparticles to measure acyclovir down to 5× 10⁻⁷ M. They report overall RSDs ranging from 9.65% to 11.89%. Muehlethaler et al.[Reference Muehlethaler, Leona and Lombardi24] reported RSDs for crystal violet, TNT, and methamphetamine with silver colloids at 5–16%, 2–6%, and 5–19%, respectively. They found that spectra measured in the same laboratory and the instrument even a few days apart are comparable and stable. Reproducibility between different laboratories and different instruments introduced the largest source of variability (10–70%), but qualitative identification is always successful. They carried out their SERS study using drops on glass slides using 1 µL of solution and 1 µL of Ag-NPs. The repeatability we observed for the AuNP solutions (Supplementary Tables S3 and S4) were between 0.02% and 13.13%.
Liszewska et al.[Reference Liszewska, Bartosewicz, Budner, Nasiłowska, Szala, Weyher, Dzięcielewski, Mierczyk and Jankiewicz11] evaluated five SERS substrates using portable Raman spectroscopy for the trace detection of explosive materials and showed that SERS enhancement of RDX, TNT, AN is a function of the SERS substrate. We are currently extending our study to include the LOD for DPA in the presence of the AuNPs as well as other water-soluble and organic NPs.
Conclusion
The SDL, LOD, and LOQ of the Rigaku–Xantus-2 portable Raman spectrometer were measured for EC and DPA in acetone, acetonitrile, ethanol, and methanol over 200–2000 cm−1. The 995 and 1604 cm−1 DPA peaks in acetone and acetonitrile gave the lowest SDLs, LODs, LOQs and lowest RSDs for repeatability and reproducibility. The addition of AuNP to the DPA solution resulted in lower SDLs for all DPA bands in both solvents and statistically significant differences in peak maximum and FWHM for the 995 cm−1 peak in acetone and for the peak maximum for the 995 and 1604 cm−1 peaks in acetonitrile supporting their use in the SERS detection of GSR.
Supplementary material
The supplementary material for this article can be found at https://doi.org/10.1557/mrc.2019.100.
Acknowledgments
We are grateful to Rigaku Corporation for the donation of the instrument. This work was supported by NSFMRI-1626326, and Towson University Fisher Chair, Fisher Endowment, Faculty Development Research Committee, and Graduate Student Association Grants. We are also grateful to Amanda Belunis and Orianna Thomas for help with solution preparation and Raman analysis.
Conflict of interest
The authors declare no conflicts of interest.