Introduction
Schizophrenia (SCZ) and bipolar disorder (BD) are common and highly heritable psychiatric disorders. Both disorders display a lifetime prevalence of approximately 1% (Merikangas et al., Reference Merikangas, Jin, He, Kessler, Lee, Sampson and Zarkov2011; Pedersen et al., Reference Pedersen, Mors, Bertelsen, Waltoft, Agerbo, McGrath and Eaton2014) and an estimated heritability of approximately 1% (Smoller & Finn, Reference Smoller and Finn2003; Sullivan, Kendler, & Neale, Reference Sullivan, Kendler and Neale2003). The possible causes of SCZ and BD are complex, and both genetic and environmental factors contribute to the pathogenesis of these disorders. To date, large-scale genome-wide association studies (GWASs) of SCZ (Ripke et al., Reference Ripke, Neale, Corvin, Walters, Farh, Holmans and O'Donovan2014; Trubetskoy et al., Reference Trubetskoy, Pardiñas, Qi, Panagiotaropoulou, Awasthi, Bigdeli and O'Donovan2022) and BD (Mullins et al., Reference Mullins, Forstner, O'Connell, Coombes, Coleman, Qiao and Andreassen2021; Stahl et al., Reference Stahl, Breen, Forstner, McQuillin, Ripke, Trubetskoy and Sklar2019) by the Psychiatric Genomics Consortium (PGC) have successfully identified multiple genetic loci implicated in these disorders. The latest GWAS of SCZ by the SCZ working group in PGC wave 3 (PGC3) identified 270 distinct genomic loci for SCZ in 69 369 patients with SCZ and 236 642 controls (Trubetskoy et al., Reference Trubetskoy, Pardiñas, Qi, Panagiotaropoulou, Awasthi, Bigdeli and O'Donovan2022). In contrast, the BD working group in PGC3 performed a GWAS of 41 917 patients with BD and 371 549 controls and identified 64 independent genomic loci associated with BD (Mullins et al., Reference Mullins, Forstner, O'Connell, Coombes, Coleman, Qiao and Andreassen2021). There is increasing evidence for a shared genetic variation and a high degree of polygenicity between SCZ and BD of approximately 70–80%, which is the highest among all pairs of psychiatric disorders (Lee et al., Reference Lee, Ripke, Neale, Faraone, Purcell, Perlis and Wray2013; Ohi et al., Reference Ohi, Shimada, Kataoka, Yasuyama, Kawasaki, Shioiri and Thompson2020; Stahl et al., Reference Stahl, Breen, Forstner, McQuillin, Ripke, Trubetskoy and Sklar2019). Furthermore, SCZ and BD risk genetic variants were commonly enriched in genes, particularly brain-expressed genes, and in synaptic signaling pathways (Mullins et al., Reference Mullins, Forstner, O'Connell, Coombes, Coleman, Qiao and Andreassen2021; Trubetskoy et al., Reference Trubetskoy, Pardiñas, Qi, Panagiotaropoulou, Awasthi, Bigdeli and O'Donovan2022).
Despite these genetic commonalities, the SCZ and BD working groups in the PGC have identified two distinct genetic loci differentiating SCZ from BD (SCZ v. BD), i.e. SCZ-specific genetic loci (Ruderfer et al., Reference Ruderfer, Ripke, McQuillin, Boocock, Stahl, Pavlides and Kendler2018). Cognitive impairments resulting in poor functional outcomes are a core feature of SCZ and BD (Hochberger et al., Reference Hochberger, Combs, Reilly, Bishop, Keefe, Clementz and Sweeney2018; Ohi et al., Reference Ohi, Shimada, Kataoka, Koide, Yasuyama, Uehara and Kawasaki2019; Schaefer, Giangrande, Weinberger, & Dickinson, Reference Schaefer, Giangrande, Weinberger and Dickinson2013; Solé et al., Reference Solé, Jiménez, Torrent, Del Mar Bonnin, Torres, Reinares and Martínez-Arán2016; Trotta, Murray, & MacCabe, Reference Trotta, Murray and MacCabe2015), and cognitive impairments are, to a lesser degree, found in unaffected first-degree relatives (FRs) of SCZ and BD patients (de Zwarte et al., Reference de Zwarte, Brouwer, Agartz, Alda, Alonso-Lana, Bearden and van Haren2022; Glahn et al., Reference Glahn, Almasy, Barguil, Hare, Peralta, Kent and Escamilla2010; Hochberger et al., Reference Hochberger, Combs, Reilly, Bishop, Keefe, Clementz and Sweeney2018; Kataoka et al., Reference Kataoka, Shimada, Koide, Okubo, Uehara, Shioiri and Ohi2020; Ohi et al., Reference Ohi, Shimada, Kataoka, Koide, Yasuyama, Uehara and Kawasaki2019). In contrast, cognitive impairments are more prominent in SCZ patients than in BD patients (Hill et al., Reference Hill, Reilly, Keefe, Gold, Bishop, Gershon and Sweeney2013; Ohi et al., Reference Ohi, Takai, Sugiyama, Kitagawa, Kataoka, Soda and Shioiri2021d), supported by the genetic correlation between impaired cognitive performance and the risk of SCZ (r g = 0.2) but not the risk of BD (Ohi et al., Reference Ohi, Sumiyoshi, Fujino, Yasuda, Yamamori, Fujimoto and Hashimoto2018; Toulopoulou et al., Reference Toulopoulou, Zhang, Cherny, Dickinson, Berman, Straub and Weinberger2019). By investigating causality using summary-data-based Mendelian randomization, we recently demonstrated that low cognitive performance was bidirectionally associated with a high risk of SCZ and that cognitive impairment unidirectionally affected SCZ-specific genetic factors (Ohi et al., Reference Ohi, Takai, Kuramitsu, Sugiyama, Soda, Kitaichi and Shioiri2021c). Furthermore, we have recently investigated whether polygenetic risk scores (PRSs) differentiating SCZ from BD were associated with the risk of SCZ and intelligence (Ohi et al., Reference Ohi, Nishizawa, Shimada, Kataoka, Hasegawa, Shioiri and Ikeda2020b, Reference Ohi, Nishizawa, Sugiyama, Takai, Kuramitsu, Hasegawa and Shioiri2021a). The PRS analysis quantifies the combined effects of single-nucleotide polymorphisms (SNPs) across the whole genome on a given clinical outcome, computed as a weighted summation of effect sizes (odds ratios; ORs) of multiple independent SNPs. We have revealed that the PRSs differentiating SCZ from BD were associated with case–control status in SCZ patients and healthy controls (HCs) (Ohi et al., Reference Ohi, Nishizawa, Shimada, Kataoka, Hasegawa, Shioiri and Ikeda2020b), and the PRSs for the SCZ-specific risk were associated with lower premorbid intelligence in SCZ patients and HCs (Ohi et al., Reference Ohi, Nishizawa, Sugiyama, Takai, Kuramitsu, Hasegawa and Shioiri2021a). In contrast, although several researchers have investigated whether PRSs for SCZ or BD are associated with cognitive functions (Comes et al., Reference Comes, Senner, Budde, Adorjan, Anderson-Schmidt, Andlauer and Papiol2020; Engen et al., Reference Engen, Lyngstad, Ueland, Simonsen, Vaskinn, Smeland and Melle2020; Kępińska et al., Reference Kępińska, MacCabe, Cadar, Steptoe, Murray and Ajnakina2020; Nakahara et al., Reference Nakahara, Medland, Turner, Calhoun, Lim, Mueller and van Erp2018; Richards et al., Reference Richards, Pardiñas, Frizzati, Tansey, Lynham, Holmans and Walters2020; Shafee et al., Reference Shafee, Nanda, Padmanabhan, Tandon, Alliey-Rodriguez, Kalapurakkel and Robinson2018; Xavier, Dungan, Keefe, & Vorderstrasse, Reference Xavier, Dungan, Keefe and Vorderstrasse2018), the findings were inconsistent among studies.
SCZ and BD are often difficult to distinguish clinically, particularly during acute episodes of illness, because of overlapping psychotic symptoms, such as delusions and hallucinations, as well as behavioral disturbances, such as anger or irritability (Pearlson, Reference Pearlson2015). Although SCZ patients display more severe cognitive impairments than BD patients, there is substantial interindividual variation between patients who do and who do not display cognitive impairments. More than half of patients with SCZ show cognitive declines, while approximately 30% of SCZ patients do not show cognitive declines (Ohi et al., Reference Ohi, Shimada, Kataoka, Koide, Yasuyama, Uehara and Kawasaki2019, Reference Ohi, Sumiyoshi, Fujino, Yasuda, Yamamori, Fujimoto and Hashimoto2017c). Early detection of and interventions for SCZ are associated with improved outcomes (Albert et al., Reference Albert, Melau, Jensen, Hastrup, Hjorthøj and Nordentoft2017). Although each individual SNP has a very low predictive power, their combination into a PRS represents a stronger predictor of disorder (Fullerton et al., Reference Fullerton, Koller, Edenberg, Foroud, Liu, Glowinski and Nurnberger2015). On the other hand, the PRSs between case and control groups are highly overlapped (Fullerton et al., Reference Fullerton, Koller, Edenberg, Foroud, Liu, Glowinski and Nurnberger2015; Ohi et al., Reference Ohi, Nishizawa, Shimada, Kataoka, Hasegawa, Shioiri and Ikeda2020b). Notably, the converting PRS into decile category method can identify subpopulations with ORs of 3–5 for having illness from the study sample (Calafato et al., Reference Calafato, Thygesen, Ranlund, Zartaloudi, Cahn, Crespo-Facorro and Bramon2018; Fullerton & Nurnberger, Reference Fullerton and Nurnberger2019; Zheutlin et al., Reference Zheutlin, Dennis, Karlsson Linnér, Moscati, Restrepo, Straub and Smoller2019). This is comparable to the predictive ability of many monogenic mutations in Mendelian diseases. Thus, it is expected that the conversion of PRS into decile will have substantial clinical utility in early screening for disorder risk, clinical diagnosis, and the determination of treatment response and prognosis in these common diseases (Zheutlin & Ross, Reference Zheutlin and Ross2018). Given the high heritability of SCZ and BD and their polygenic architecture, individuals at high risk for SCZ or BD may benefit from early intervention for cognitive impairments, as well as risk stratification based on PRS genetic profiling, particularly SCZ patients. Therefore, among psychiatric disorders, SCZ and BD would be the best candidates for future clinical integration of PRS profiling.
Since understanding the level of cognitive dysfunction could be beneficial in guiding treatment, we sought to evaluate the aggregated outcome of genome-wide SNPs for SCZ, BD, and SCZ v. BD on cognitive impairments in patients with SCZ using a combined PRS approach based on the latest GWASs of SCZ, BD, and SCZ v. BD. Increased genetic loading specifically for SCZ but not for BD in patients with SCZ may be expected to be associated with more severe cognitive impairments. In this study, we investigated whether PRSs for PGC3 SCZ, PGC3 BD, and SCZ v. BD were associated with case–control and relative–control statuses in SCZ patients, their FRs and HCs and whether cognitive performances differed among the diagnostic groups. Furthermore, we aimed to investigate whether individuals who had a high genetic susceptibility for SCZ or BD, stratified by combinations of PRSs for SCZ, BD, and SCZ v. BD, would display better or worse cognitive performances than those who had a low genetic susceptibility for SCZ and BD.
Methods
Sample description
The study sample (n = 444) was composed of 175 patients with SCZ, 71 of their unaffected FRs, and 198 HCs. All participants were of Japanese descent and had no biological first- or second-degree relatives within their own diagnostic groups. The participants were recruited from the Schizophrenia Non-Affected Relative Project (SNARP) (Kataoka et al., Reference Kataoka, Shimada, Koide, Okubo, Uehara, Shioiri and Ohi2020; Ohi et al., Reference Ohi, Nishizawa, Muto, Sugiyama, Hasegawa, Soda and Ikeda2020a, Reference Ohi, Nishizawa, Shimada, Kataoka, Hasegawa, Shioiri and Ikeda2020b, Reference Ohi, Nishizawa, Sugiyama, Takai, Kuramitsu, Hasegawa and Shioiri2021a, Reference Ohi, Shimada, Kataoka, Koide, Yasuyama, Uehara and Kawasaki2019, Reference Ohi, Shimada, Nemoto, Kataoka, Yasuyama, Kimura and Kawasaki2017a). The patients and their unaffected FRs were recruited from Kanazawa Medical University Hospital. All patients with SCZ (n = 131), FRs (n = 57), and HCs (n = 147) who participated in a previous study that used PGC2 GWASs of SCZ and BD as discovery samples (Ohi et al., Reference Ohi, Nishizawa, Shimada, Kataoka, Hasegawa, Shioiri and Ikeda2020b) were included in the current study. A detailed description of participant recruitment and diagnosis has been provided previously (Ohi et al., Reference Ohi, Nishizawa, Muto, Sugiyama, Hasegawa, Soda and Ikeda2020a, Reference Ohi, Nishizawa, Shimada, Kataoka, Hasegawa, Shioiri and Ikeda2020b, Reference Ohi, Shimada, Kataoka, Koide, Yasuyama, Uehara and Kawasaki2019). Briefly, each patient was diagnosed based on unstructured clinical interviews, medical records, and clinical conferences according to the criteria in the fifth edition of the Diagnostic and Statistical Manual of Mental Disorders (DSM-5). FRs and HCs were evaluated using the Structured Clinical Interview for DSM-IV-Non-Patient version (SCID-NP) to exclude individuals who had current or past contact with psychiatric services or had received psychiatric medication. In addition, HCs were evaluated using the SCID-NP, excluding individuals who had any family history of neuropsychiatric disease among their first- or second-degree relatives. Written informed consent was obtained from all participants after the procedures had been thoroughly explained. This study was performed in accordance with the World Medical Association's Declaration of Helsinki and was approved by the Research Ethics Committees of Gifu University and Kanazawa Medical University.
Genotyping and imputation
A detailed description of the genotyping, quality control (QC), and imputation procedures applied in the study sample has been provided previously (Ohi et al., Reference Ohi, Nishizawa, Muto, Sugiyama, Hasegawa, Soda and Ikeda2020a, Reference Ohi, Nishizawa, Shimada, Kataoka, Hasegawa, Shioiri and Ikeda2020b, Reference Ohi, Nishizawa, Sugiyama, Takai, Kuramitsu, Hasegawa and Shioiri2021a). Briefly, venous blood was collected from the participants, and genomic DNA was extracted from whole-blood samples. Genotyping was performed using Infinium OmniExpressExome-8 v1.4 or v1.6 BeadChips (Illumina, San Diego, CA, USA). In the first QC process, one sample with a poor genotype call rate of <0.95 (HC, n = 1) and SNPs with a low genotype call frequency of <0.95 or a ‘cluster sep’ (an index of genotype cluster separation) of <0.1 were excluded. We then applied the following QC criteria to exclude samples: (i) sex chromosome anomalies (SCZ, n = 2) and (ii) sample relatedness in each diagnostic group ($\hat{\pi }$ > 0.2) (HC, n = 1; FR, n = 1) using PLINK v1.9. Finally, 439 individuals, including 173 patients with SCZ [77 males/96 females, mean age ± standard deviation (s.d.): 45.1 ± 13.9 years], 70 of their unaffected FRs (51 parents/12 siblings/7 offspring, 25 males/45 females, 60.1 ± 14.3 years), and 196 HCs (128 males/68 females, 35.7 ± 13.8 years), were included in the subsequent analyses. After the exclusion of SNPs that (i) were duplicated or ambiguous, (ii) were localized on the sex chromosomes or mitochondria, (iii) deviated from Hardy–Weinberg equilibrium (p < 1.0 × 10⁻⁵), or (iv) had a low minor allele frequency <0.001, 615 835 SNPs were retained. To check for population stratification, we performed a principal component (PC) analysis. As shown in online Supplementary Fig. S1, the PCs in our study samples (SCZ patients, FRs and HCs) were located on those in Japanese in Tokyo, Japan, indicating that there was no population stratification. Genotype imputation was performed using the 1000 Genomes Project Phase 3 dataset [https://mathgen.stats.ox.ac.uk/impute/1000GP_Phase3.html (Auton et al., Reference Auton, Brooks, Durbin, Garrison, Kang, Korbel and Abecasis2015)] as a reference panel. For PRS analysis, to obtain a highly informative SNP set, insertion-deletion polymorphisms were excluded, and SNPs with high imputation quality (>0.9) were retained. Ultimately, 8 741 088 SNPs were retained.
PRS calculations
We calculated three PRSs for PGC3 SCZ, PGC3 BD, and SCZ v. BD in our study sample as in the following method. To identify risk variants for SCZ, BD, and SCZ v. BD and their p values and ORs, three publicly available GWAS datasets [PGC3 for SCZ (Trubetskoy et al., Reference Trubetskoy, Pardiñas, Qi, Panagiotaropoulou, Awasthi, Bigdeli and O'Donovan2022), PGC3 for BD (Mullins et al., Reference Mullins, Forstner, O'Connell, Coombes, Coleman, Qiao and Andreassen2021), and SCZ v. BD (Ruderfer et al., Reference Ruderfer, Ripke, McQuillin, Boocock, Stahl, Pavlides and Kendler2018); https://www.med.unc.edu/pgc/results-and-downloads] were used as discovery samples. To remove SNPs that were in linkage disequilibrium in our study sample, the SNPs were pruned based on a pairwise r 2 threshold of 0.25 and a window size of 200 SNPs using PLINK. After pruning, 1 633 205 independent SNPs remained in our study sample. We calculated PRSs constructed from alleles showing a nominal association with each disorder in discovery GWASs under the following liberal significance threshold (PT cutoff): PT ⩽ 0.01, PT ⩽ 0.05, PT ⩽ 0.1, PT ⩽ 0.2, PT ⩽ 0.5, and PT ⩽ 1. For each participant included in our study sample, a PRS was calculated by weighting the scores for the ‘risk SNPs’ by the logarithm of the OR (logOR) observed for each discovery GWAS. The score, consisting of the number of risk alleles (0, 1, or 2) multiplied by the logOR, was summed over all the SNPs in the P T-SNP sets for each participant in the study sample. To divide participants into decile categories, z-standardized PRSs for SCZ, BD, and SCZ v. BD were calculated.
Cognitive functions
To assess cognitive functions, we administered the Japanese version of the Brief Assessment of Cognition in Schizophrenia (BACS) battery (Kaneda et al., Reference Kaneda, Sumiyoshi, Keefe, Ishimoto, Numata and Ohmori2007) to 81.3% of our participants (n = 357). The BACS is a reliable and efficient test (30 min) of global neuropsychological functions (Hill et al., Reference Hill, Reilly, Keefe, Gold, Bishop, Gershon and Sweeney2013; Keefe et al., Reference Keefe, Goldberg, Harvey, Gold, Poe and Coughenour2004, Reference Keefe, Harvey, Goldberg, Gold, Walker, Kennel and Hawkins2008). The BACS battery assesses six cognitive subtests: (i) verbal memory (verbal memory), (ii) digit sequencing (working memory), (iii) token motor (motor speed), (iv) verbal fluency (verbal fluency), (v) symbol coding (attention), and (vi) tower of London (executive function). The raw scores were standardized to create a composite score that represented the average score for the six cognitive subtests. All tests were scored by trained psychologists. Although factor analytic studies of the BACS have indicated a unitary construct underlies the six subtests (Hochberger et al., Reference Hochberger, Hill, Nelson, Reilly, Keefe, Pearlson and Sweeney2016; Lam et al., Reference Lam, Wang, Huang, Eng, Rapisarda, Kraus and Lee2017), and the BACS was designed as a brief assessment of general cognitive ability and not separate cognitive processes or domains, the current study focused on six cognitive subtests as well as the composite scores.
Statistical analyses
All statistical analyses were performed using IBM SPSS Statistics 28.0 software (IBM Japan, Tokyo, Japan). Differences in continuous variables, such as age and years of education, among diagnostic groups or genetic groups were analyzed using an analysis of variance. Differences in categorical variables, such as sex, were analyzed using Pearson's χ2 test. To examine whether the PRSs based on each PT cutoff were associated with case–control or relative–control statuses in our study sample, we performed logistic regression with diagnostic status (HCs v. SCZ or HCs v. FRs) as the dependent variable and each PRS based on GWASs of PGC3 SCZ, PGC3 BD, and SCZ v. BD as the independent variables. The variance in the risk of SCZ and FR status explained by the PRS is indicated by Nagelkerke's pseudo-R 2.
Based on the PRSs for SCZ, participants were allocated to deciles (1st decile, the lowest PRSs for SCZ; 10th decile, the highest PRSs for SCZ). ORs and 95% confidence intervals (CIs) for (i) risks of SCZ or FRs, (ii) the PRS for BD, and (iii) the PRS for SCZ v. BD stratified by the decile of the PRS for SCZ were estimated using logistic regression with SCZ PRS deciles as the dependent variables, and (i) diagnostic status (HCs v. SCZ or HCs v. FRs), (ii) the BD PRS, or (iii) the SCZ v. BD PRS as the independent variables. The first decile was used as reference for the others.
Furthermore, based on the PRSs for BD and for SCZ v. BD, participants were allocated to deciles. We extracted individuals in the low genetic risk, genetic BD risk, and genetic SCZ risk groups based on combinations of PRS deciles for SCZ, BD, and SCZ v. BD in patients with SCZ, their FRs and HCs. To keep a moderate number of samples in each group, the 1st–3rd or 8th–10th deciles were combined to extract the genetic groups. The remaining participants were defined as individuals at no genetic risk for SCZ or BD (no genetic risk group). The effects of the diagnostic status (SCZ, FR, and HC) or genetic risk groups based on the combinations of three PRS deciles on cognitive functions were analyzed using an analysis of covariance with the BACS scales as dependent variables, diagnostic status or genetic risk groups as independent variables, and age and sex as covariates. Post hoc tests with Fisher's least significant difference were used to evaluate significant differences among groups. Since sample sizes of genetic risk groups are limited, statistically significant differences in cognitive functions across genetic risk groups, particularly in SCZ patients, were not obtained. Therefore, to compare the degrees of cognitive differences among the groups, standardized effect sizes of age- and sex-corrected composite scores and cognitive subtests were calculated using Cohen's d method (https://www.uccs.edu/lbecker/). The nominal two-tailed significance level for all statistical tests was set at p < 0.05. The PRSs at each PT cutoff were highly correlated with each other and were not independent. Therefore, the p values based on different PT cutoff values were not corrected. A Bonferroni-corrected p value threshold of p < 5.56 × 10⁻³ (α = 0.05/3 PRSs for SCZ, BD, and SCZ v. BD and six cognitive subtests) was used to avoid type I error.
Results
Effects of PRSs for PGC3 SCZ, PGC3 BD, and SCZ v. BD on case–control or relative–control statuses
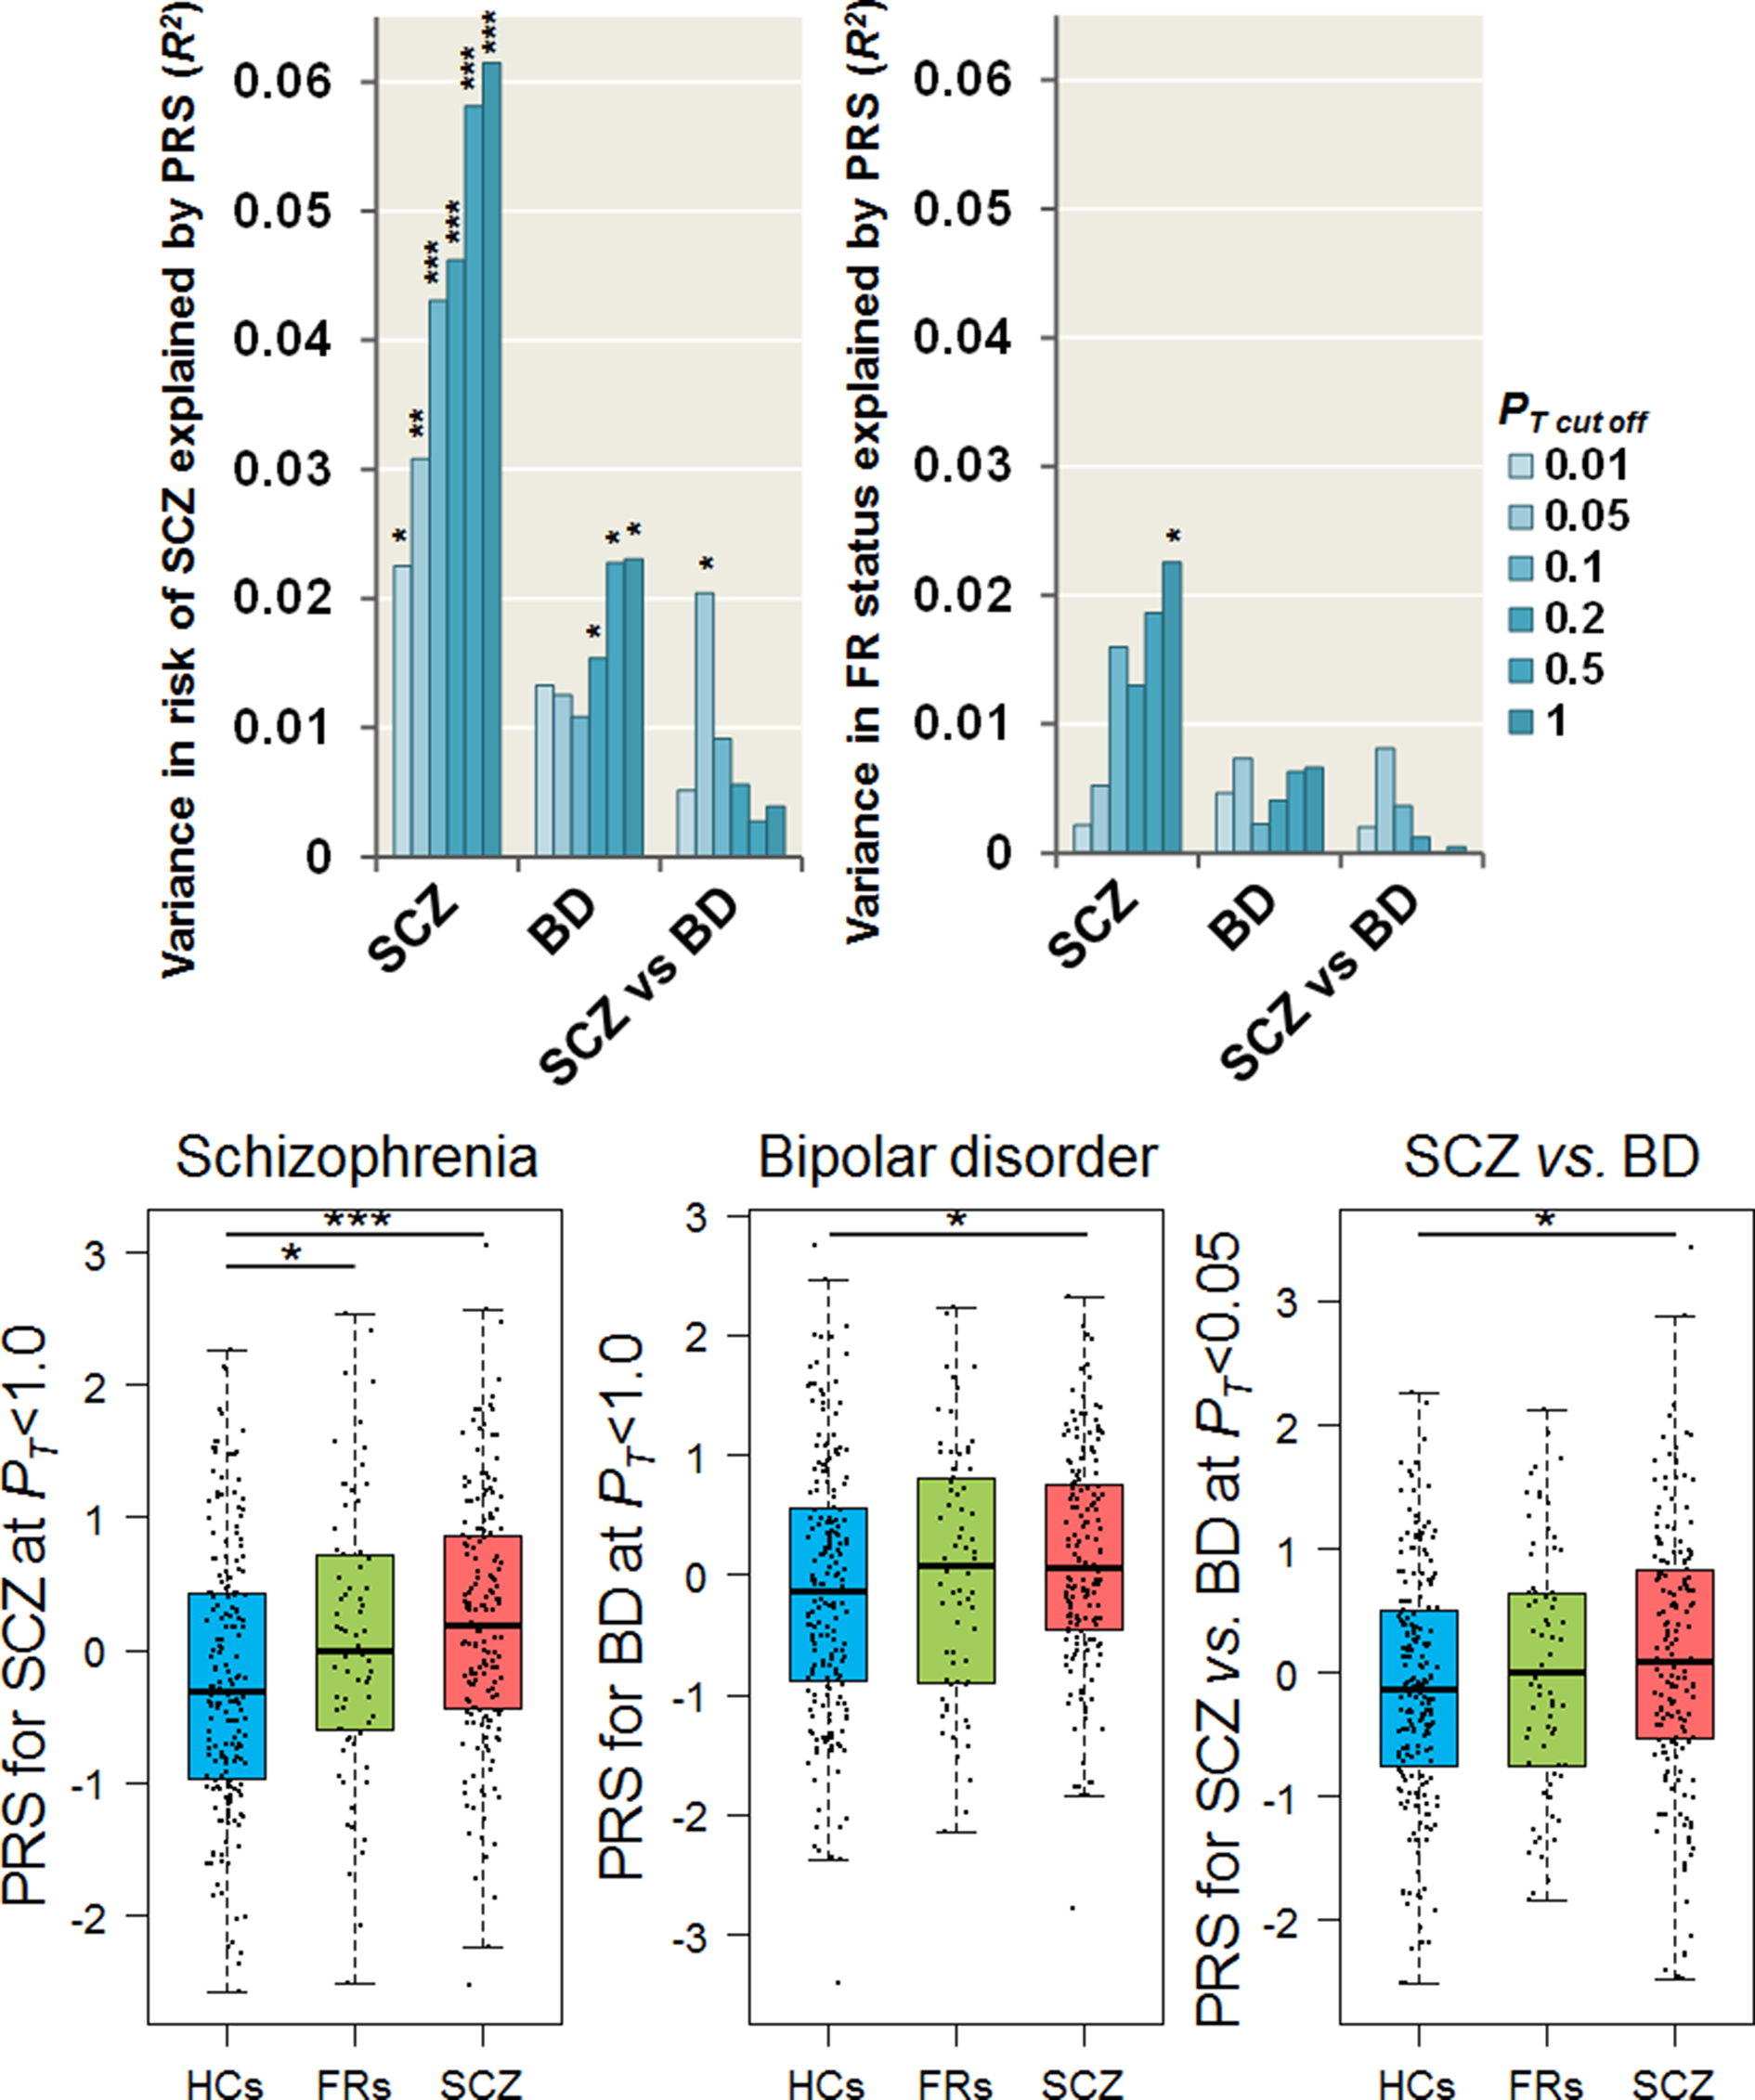
We first investigated whether the PRSs based on GWASs of PGC3 SCZ, PGC3 BD, and SCZ v. BD were associated with risk of SCZ (SCZ v. HCs) and FR status (FRs v. HCs) at different PT cutoff levels (Fig. 1). The PRSs related to SCZ and BD were significantly higher in our patients with SCZ than in HCs (Fig. 1, SCZ, a maximum at PT ⩽ 1.0: Nagelkerke's R 2 = 0.061, p = 5.36 × 10⁻⁵; BD, a maximum at PT ⩽ 1.0: R 2 = 0.023, p = 0.012), and the PRS for SCZ v. BD (differentiating SCZ from BD) was nominally higher in the patients with SCZ than in HCs (a maximum at PT ⩽ 0.05: R 2 = 0.020, p = 0.018). In addition, the PRS for SCZ was nominally higher in FRs than in HCs (Fig. 1, a maximum at PT ⩽ 1.0: R 2 = 0.023, p = 0.043). In contrast, there were no significant differences in the PRSs for BD or SCZ v. BD between FRs and HCs (Fig. 1, p > 0.05).
Effects of PRSs for PGC3 SCZ, PGC3 BD, and SCZ v. BD based on each threshold (PT cutoff) on the risk of SCZ (SCZ v. HCs) and FR status (FRs v. HCs). The variance in the risk of SCZ and FR status explained by the PRS is indicated by Nagelkerke's pseudo-R 2. ***p < 0.001, **p < 0.01, *p < 0.05. Box plots among each diagnostic group show the individual PRSs related to SCZ, BD, or SCZ v. BD at PT cutoff with the most significantly differentiating SCZ patients from HCs. *p < 0.05, ***p < 0.001. SCZ, schizophrenia; BD, bipolar disorder; FRs, first-degree relatives of SCZ; HCs, healthy controls.

Risks of SCZ and FR status and increases in the PRSs for BD and SCZ v. BD stratified by SCZ PRS deciles
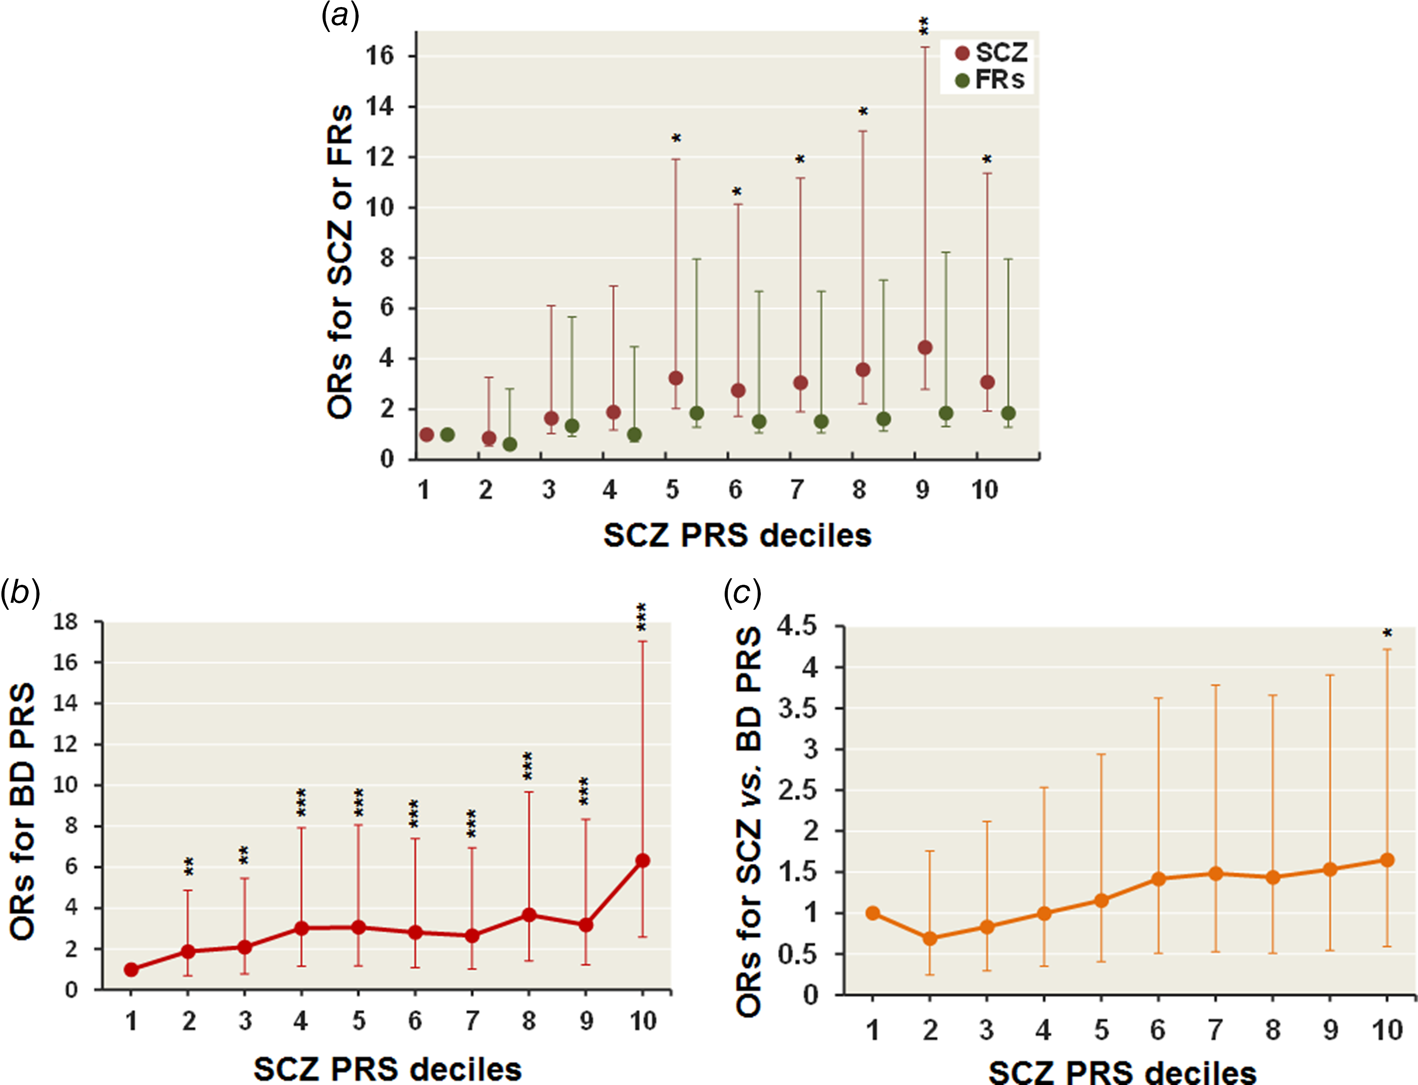
Based on stratification by SCZ PRS deciles at PT < 1.0, we next investigated the risks of SCZ and FR status and changes in the BD PRS at PT < 1.0 and in the SCZ v. BD PRS at PT < 0.05 across the SCZ PRS deciles (Fig. 2). Compared with individuals in the 1st decile (the lowest PRS for SCZ), those in the 5th–10th deciles (higher PRSs for SCZ) had up to a 4.46-fold significantly higher risk of SCZ (Fig. 2a, a maximum at the 9th decile: OR = 4.46, 95% CI = 1.67–11.91, p = 2.88 × 10⁻³). Similarly, individuals in higher deciles had up to 1.86-fold higher odds of FR status than those in the 1st decile, although the difference did not reach the statistical significance level (a maximum at the 10th decile: OR = 1.86, 95% CI = 0.56–6.11, p = 0.31). Furthermore, individuals in the highest decile for SCZ PRS had significantly elevated BD PRSs compared to those in the lowest (1st) decile for all participants (Fig. 2b, a maximum at the 10th decile: OR = 6.33, 95% CI = 3.74–10.72, p = 6.43 × 10⁻¹²). Among all participants, individuals in the highest (10th) decile for SCZ PRSs displayed nominally higher SCZ v. BD PRSs than those in the lowest (1st) decile (Fig. 2c, OR = 1.65, 95% CI = 1.06–2.57, p = 0.027).
Risks of SCZ or FR status (a) and increases in BD PRS (b) and SCZ v. BD PRSs (c) stratified by SCZ PRS deciles. Based on SCZ PRSs at the most significant PT < 1.0, participants were allocated to deciles (1st decile, the lowest PRSs for SCZ; 10th decile, the highest PRSs for SCZ). ORs and 95% CIs were estimated using logistic regression. The first decile was used as reference for the others. The points represent the ORs, and the error bars represent the lower and upper CIs of the ORs. *p < 0.05, **p < 0.01, ***p < 0.001.

Extraction of the low genetic risk, genetic BD risk, and genetic SCZ risk groups
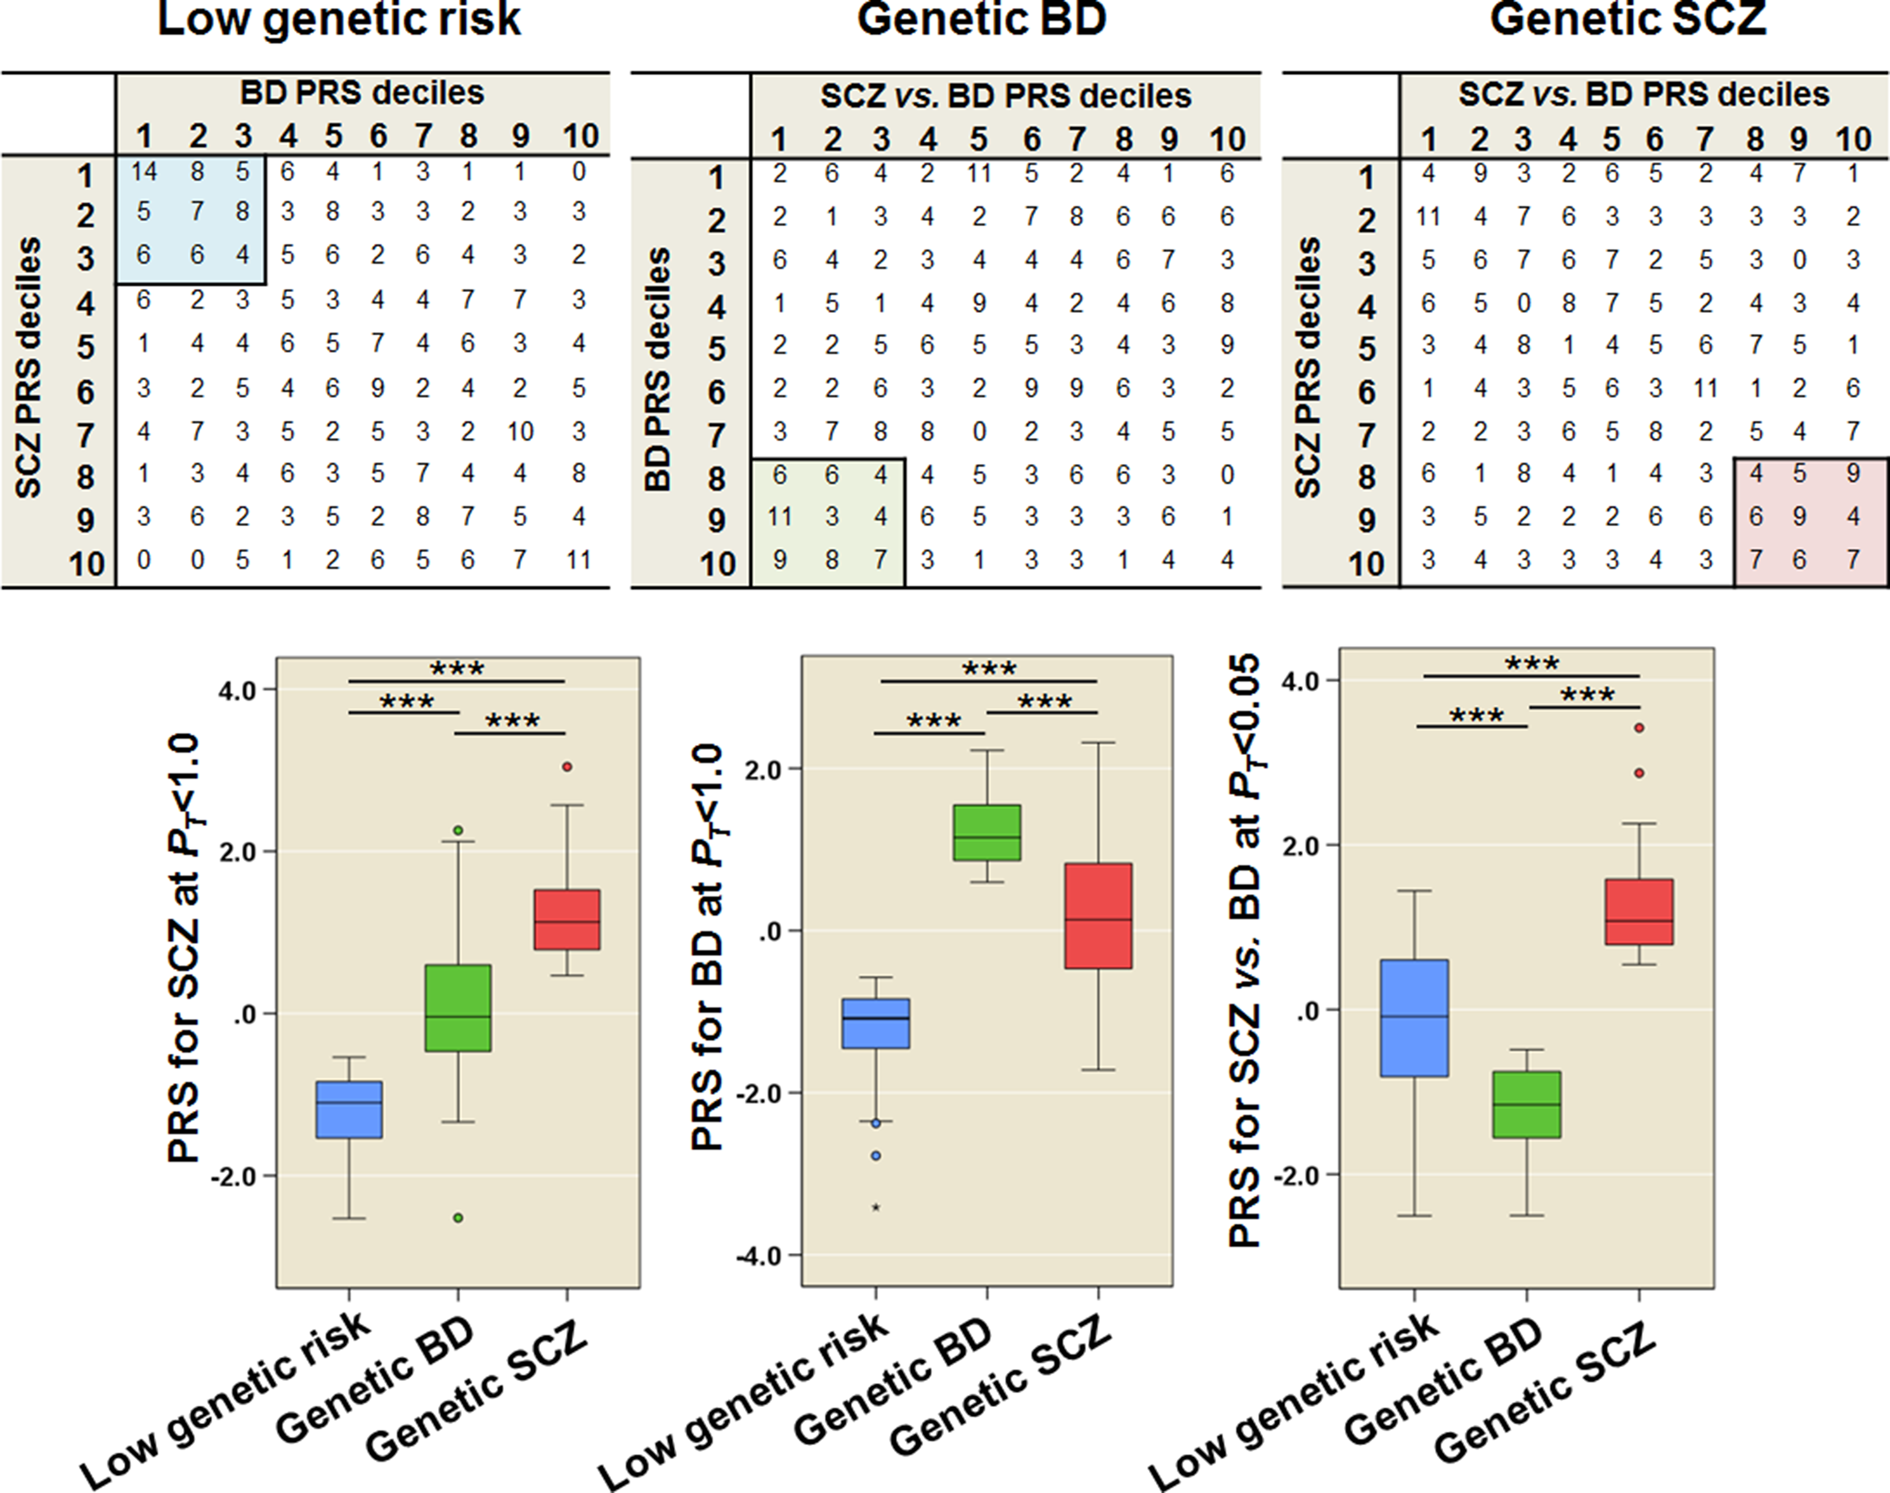
Participants were allocated to PRS deciles (for SCZ PRS and BD PRS deciles, the 1st decile included the lowest PRSs for SCZ or BD, and the 10th decile included the highest PRSs for SCZ or BD; for SCZ v. BD PRS deciles, the 1st decile included the lowest genetic risks for SCZ, and the 10th decile included the highest genetic risks for SCZ). Based on combinations of three PRS deciles for SCZ, BD, and SCZ v. BD, we extracted individuals at the lowest genetic risks for SCZ and BD (low genetic risk group; blue), those at the highest genetic risk for BD (genetic BD risk group; green), and those at the highest genetic risk for SCZ (genetic SCZ risk group; red) from among patients with SCZ, their FRs and HCs (Fig. 3). Each PRS significantly differed among the genetic groups (p < 0.001). The proportions of SCZ patients, BD patients, FRs, and HCs among the low genetic risk, genetic BD risk, and genetic SCZ risk groups are indicated in online Supplementary Table S1, indicating that the low genetic risk group contained more HCs (HCs, 20.9%; FRs, 15.7%; SCZ, 6.4%), whereas the genetic BD and SCZ groups contained more SCZ patients (genetic BD: HCs, 10.7%; FRs, 17.1%; SCZ, 14.5%, genetic SCZ: HCs, 8.2%; FRs, 15.7%; SCZ, 17.3%) (χ2 = 21.5, p = 2.54 × 10⁻⁴).
Extraction of individuals at the lowest genetic risks for SCZ and BD (low genetic risk group; blue), those at the highest genetic risk for BD (genetic BD group; green) and those at the highest genetic risk for SCZ (genetic SCZ group; red) based on combinations of PRS deciles for SCZ, BD, and SCZ v. BD in patients with SCZ, their FRs and HCs. Participants were allocated to deciles (for SCZ PRS and BD PRS deciles, the 1st decile included the lowest PRSs for SCZ or BD, and the 10th decile included the highest PRSs for SCZ or BD; for SCZ v. BD PRS deciles, the 1st decile included the lowest genetic risks for SCZ, and the 10th decile included the highest genetic risks for SCZ). The number of participants is indicated based on combinations of three PRS deciles in each table. ***p < 0.001.

Differences in cognitive scores among SCZ patients, FRs, and HCs
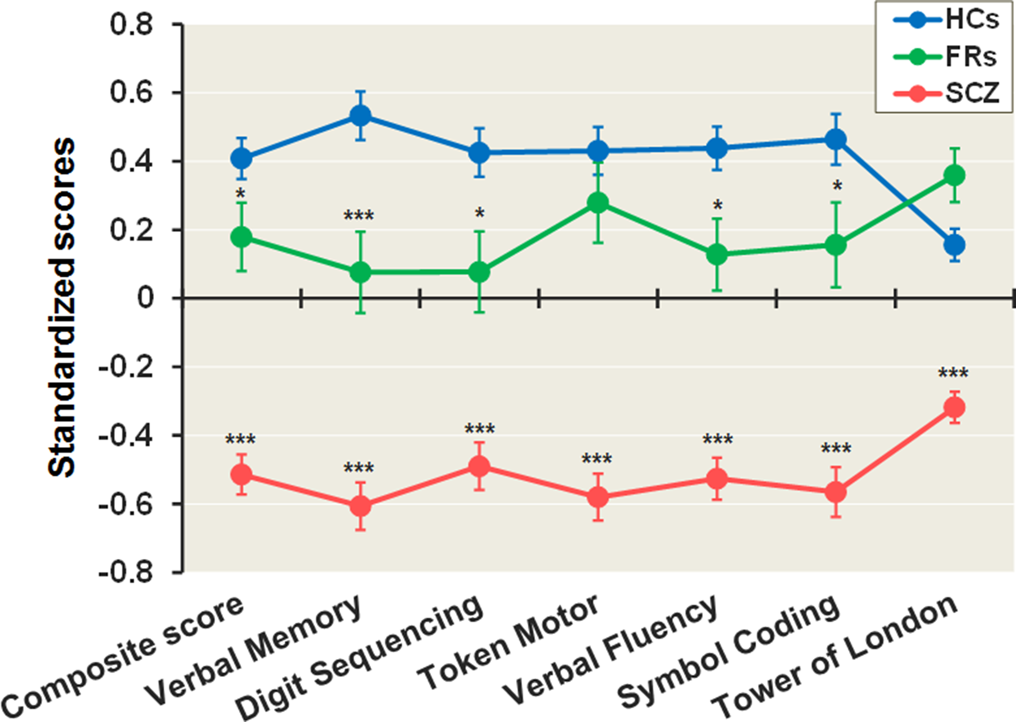
The demographic information of the three diagnostic groups is summarized in online Supplementary Table S2. Diagnostic differences in the composite scores and six cognitive subscale scores among SCZ patients, FRs, and HCs were investigated. We found significant differences in composite scores and all cognitive subscale scores among SCZ patients, FRs, and HCs (Fig. 4 and online Supplementary Table S3, composite score, F 2,352 = 106.6, p = 6.53 × 10−37; verbal memory, F 2,352 = 94.0, p = 1.91 × 10⁻³³; digit sequencing, F 2,352 = 43.4, p = 1.40 × 10⁻¹⁷; token motor, F 2,352 = 58.6, p = 1.05 × 10⁻²²; verbal fluency, F 2,352 = 50.5, p = 5.40 × 10⁻²⁰, symbol coding, F 2,352 = 71.8, p = 6.83 × 10⁻²⁷; and tower of London, F 2,352 = 17.2, p = 7.79 × 10⁻⁸). Except for token motor and tower of London scores, most cognitive subscale scores were significantly different across the three diagnostic groups (p < 0.05). These findings demonstrated that SCZ patients had a wide range of cognitive impairments compared with those observed in FRs and HCs, and FRs had cognitive impairments that were between those of SCZ patients and HCs.
Cognitive scores assessed by the BACS among patients with SCZ, their FRs and HCs. Means of age- and sex-corrected scores ± standard errors (s.e.) are shown. ***p < 0.001, **p < 0.01, *p < 0.05 (compared with HCs).

Differences in cognitive scores among the low genetic risk, genetic BD risk, and genetic SCZ risk groups
The main purpose of this study was to compare the degrees of differences in the composite scores and six cognitive subscale scores among the low genetic risk, genetic BD risk, and genetic SCZ risk groups. We focused on three genetic groups, HCs in the low genetic risk group (n = 29), SCZ patients in the genetic BD risk group (n = 16), and SCZ patients in the genetic SCZ risk group (n = 26), to extract groups with a moderate sample size in typical cases. Demographic characteristics among the three genetic groups are summarized in online Supplementary Table S4. We found significant differences in composite scores and cognitive subscale scores among the three genetic groups (online Supplementary Table S5, composite score, F 2,66 = 27.2, p = 2.46 × 10⁻⁹; verbal memory, F 2,66 = 16.2, p = 1.95 × 10⁻⁶; digit sequencing, F 2,66 = 13.8, p = 1.01 × 10⁻⁵; token motor, F 2,66 = 18.2, p = 4.91 × 10⁻⁷; verbal fluency, F 2,66 = 21.4, p = 6.94 × 10⁻⁸; and symbol coding, F 2,66 = 19.0, p = 3.12 × 10⁻⁷), except for tower of London (F 2,66 = 4.5, p = 0.015). Compared with the low genetic risk group in HCs, the genetic BD risk and genetic SCZ risk groups in SCZ patients had impaired cognitive scores (p < 0.05), while there were no statistically significant differences between the genetic BD risk and genetic SCZ risk groups in SCZ patients (p > 0.05), as initially expected owing to the small sample sizes. We further investigated the differences in cognitive scores between HCs in the no genetic risk group (n = 97) and SCZ patients in the no genetic risk group (n = 91) (online Supplementary Table S6). As expected, the SCZ patients in the no genetic risk group had significantly impaired cognitive scores compared with HCs in the no genetic risk group (online Supplementary Table S7, all p < 0.05).
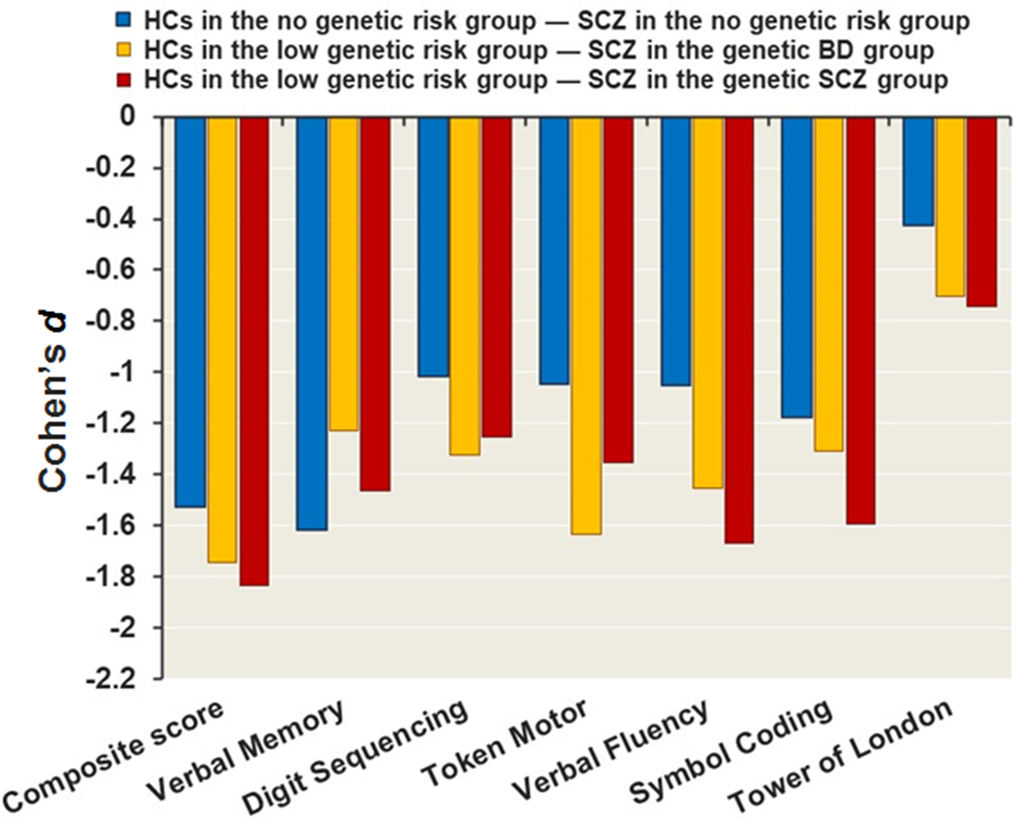
We compared the degrees of cognitive differences among genetic groups using effect sizes (Cohen's d) (Fig. 5). Compared with the cognitive differences, except for verbal memory scores, between HCs in the no genetic risk group and SCZ patients in the no genetic risk group (blue), the differences in composite scores and cognitive subtests between HCs in the low genetic risk group and SCZ patients in the genetic BD risk group (yellow) and between HCs in the low genetic risk group and SCZ patients in the genetic SCZ risk group (red) were more prominent (d > −0.20). SCZ diagnosis along with high BD or SCZ risk exacerbated cognitive dysfunction assessed by composite score (d > −0.20). Furthermore, SCZ patients in the genetic SCZ risk group displayed lower scores in verbal memory, verbal fluency, and symbol coding than SCZ patients in the genetic BD risk group (d > −0.20), whereas the genetic BD risk group displayed more severely impaired token motor function scores than the genetic SCZ risk group (d = −0.28). SCZ patients in the genetic SCZ risk group showed a trend toward lower cognitive performance scores than SCZ patients in the genetic BD risk group and SCZ patients in the no genetic risk group (online Supplementary Fig. S2).
Cognitive differences in composite scores and cognitive subtests between HCs with no genetic risk for SCZ or BD and SCZ patients with no genetic risk for SCZ or BD (blue), between HCs in the low genetic risk group and SCZ patients in the genetic BD group (yellow), and between HCs in the low genetic risk group and SCZ patients in the genetic SCZ group (red). The effect sizes (Cohen's d) indicate the degree of the impairment in scores in the patient groups (SCZ patients in the no genetic risk group, SCZ patients in the genetic BD group and SCZ patients in the genetic SCZ group) compared to HCs in the no genetic risk group and HCs in the low genetic risk group.

Most cognitive subtests were impaired in SCZ patients in the genetic SCZ risk group compared with those in genetic BD risk group (d < −0.20), whereas SCZ patients in the genetic SCZ risk group exhibited better motor speed than SCZ patients in the genetic BD risk group (d = 0.28). The reason may be due to a significant difference in biperiden equivalents of total antiparkinsonian drugs (BPD-eq) that induce poor cognitive performances between SCZ patients in the genetic SCZ risk group and SCZ patient in the genetic BD risk group. The SCZ patients in the genetic BD risk group took a higher dose of BPD-eq than SCZ patient in the genetic SCZ risk group (online Supplementary Table S4, p = 0.033), affecting the outcome. Indeed, the difference in motor speed between SCZ patient in the genetic BD risk group and SCZ patients in the genetic SCZ risk group was reduced to less than half after adjusting for BPD-eq as a covariate (d = 0.10). On the other hand, the differences in other cognitive subtest scores, including composite scores and executive function scores, between the groups were increased after adjusting for BPD-eq (d < −0.20). These findings suggest that although the dosage of antiparkinsonian drugs negatively affected some cognitive functions (Eum et al., Reference Eum, Hill, Rubin, Carnahan, Reilly, Ivleva and Bishop2017), the genetic SCZ risk group had impaired cognitive performance compared with the genetic BD risk group even after correcting the dosage.
Discussion
The present study investigated whether PRSs and PRS deciles for SCZ, BD, and SCZ v. BD based on the latest GWASs from the PGC influence the risk level of SCZ patients or their unaffected FRs and whether cognitive performances differed among diagnostic groups as well as genetic groups based on combinations of the PRSs for SCZ, BD, and SCZ v. BD. As expected, the PRSs related to SCZ, BD, and SCZ v. BD were higher in SCZ patients than in HCs, and the PRS related to SCZ was higher in FRs than in HCs. Furthermore, individuals in higher deciles for SCZ PRSs had up to 6.33-fold and 1.86-fold higher PRSs for BD and SCZ v. BD, respectively, than those in lower deciles for SCZ PRSs. SCZ patients showed a wide range of cognitive impairments compared with FRs and HCs, and the FRs had cognitive performance impairments that were between those of SCZ patients and HCs. Of the three genetic groups, the genetic SCZ risk, genetic BD risk, and low genetic risks for SCZ and BD groups, the genetic SCZ risk and genetic BD risk groups contained more SCZ patients, while the low genetic risk group contained more HCs. Differences in cognitive performance scores between SCZ patients in the genetic SCZ or BD risk groups and HCs in the low genetic risk group were stronger than those between SCZ patients and HCs in the no genetic risk group. Moreover, the genetic SCZ risk group displayed lower scores in verbal memory, verbal fluency, and attention than the genetic BD risk group.
In this study, we utilized GWASs of PGC3 SCZ (Trubetskoy et al., Reference Trubetskoy, Pardiñas, Qi, Panagiotaropoulou, Awasthi, Bigdeli and O'Donovan2022) and PGC3 BD (Mullins et al., Reference Mullins, Forstner, O'Connell, Coombes, Coleman, Qiao and Andreassen2021) as discovery samples to calculate PRSs for SCZ and BD, respectively. The PRSs for PGC3 SCZ and PGC3 BD were associated with the risk of SCZ (SCZ, R 2 = 0.061; BD, R 2 = 0.023) and the status of FRs (SCZ, R 2 = 0.023; BD, R 2 = 0.007). The PRSs for PGC3 SCZ and PGC3 BD explained 6.1% and 2.3% of the variance in the risk for SCZ and 2.3% and 0.7% of the variance in the risk for FR status, respectively. We have previously reported genetic associations of SCZ and FR status with PRSs based on GWASs of PGC2 SCZ (Ripke et al., Reference Ripke, Neale, Corvin, Walters, Farh, Holmans and O'Donovan2014) and PGC2 BD (Stahl et al., Reference Stahl, Breen, Forstner, McQuillin, Ripke, Trubetskoy and Sklar2019) as discovery samples in a smaller sample of 130 SCZ patients, 56 FRs, and 146 HCs (Ohi et al., Reference Ohi, Nishizawa, Shimada, Kataoka, Hasegawa, Shioiri and Ikeda2020b). The PRSs for PGC2 SCZ and PGC2 BD were associated with the risk of SCZ (SCZ, R 2 = 0.049; BD, R 2 = 0.029) and the status of FRs (SCZ, R 2 = 0.012; BD, R 2 = 0.010). The total sample sizes of GWASs of PGC3 SCZ and PGC3 BD were approximately 3.7-fold and 8.0-fold larger than those of PGC2 SCZ and PGC2 BD, respectively. As PRSs derived from larger-scale GWASs increase the reliability of predictions of the genetic risk of target phenotypes (Ohi et al., Reference Ohi, Otowa, Shimada, Sugiyama, Tanahashi, Kaiya and Shioiri2021b), PRSs based on PGC3 more so than PGC2 could increase the reliability. Actually, the proportion of the variance in the risk for SCZ explained by the PRSs based on PGC3 SCZ was increased, while that explained by the PRSs based on PGC3 BD was not changed compared with those based on PGC2 BD. These findings suggest that PGC3 GWASs improved the disorder specificity for the prediction of genetic risk.
Of the six cognitive subtest scores and composite scores assessed by the BACS, most cognitive subtest scores except for token motor and tower of London scores differed among SCZ patients, FRs, and HCs. We have previously indicated that only symbol coding scores differed among the diagnostic groups (Ohi et al., Reference Ohi, Shimada, Nemoto, Kataoka, Yasuyama, Kimura and Kawasaki2017a). The sample size in the current study (n = 357) was approximately three times larger than that in the previous study (n = 126), which improved the statistical power to detect differences. Compared with HCs, all cognitive subtests in SCZ patients were severely impaired (from d = −0.53 for tower of London to d = −1.64 for composite score). Furthermore, except for token motor and tower of London scores, cognitive impairments were found to a lesser degree in FRs than in HCs (d = −0.35 for verbal fluency; d = −0.60 for verbal memory). Our findings support that cognitive impairments are continuous among these diagnostic groups.
We have previously demonstrated that the PRS differentiating SCZ from BD is correlated with low premorbid intelligence in SCZ patients and HCs (Ohi et al., Reference Ohi, Nishizawa, Sugiyama, Takai, Kuramitsu, Hasegawa and Shioiri2021a). Thus, premorbid intelligence might affect the cognitive differences between genetic groups. In addition to BPD-eq, premorbid intelligence was further adjusted for as covariates (online Supplementary Fig. S3). Even after the corrections, impairments in verbal fluency and attention were still more prominent in SCZ patients in the genetic SCZ risk group than in SCZ patients in the genetic BD risk group and those in the no genetic risk group (d < −0.20). In contrast, those in the genetic BD risk group had better verbal memory scores than those in the genetic SCZ risk group and those in the no genetic risk group (d > 0.20), supporting evidence that BD patients scored higher on the verbal memory subscale than SCZ patients (Cholet et al., Reference Cholet, Sauvaget, Vanelle, Hommet, Mondon, Mamet and Camus2014). We have indicated a significant genetic correlation between SCZ and cognitive function and a lack of genetic correlation between BD and cognitive function (Ohi et al., Reference Ohi, Sumiyoshi, Fujino, Yasuda, Yamamori, Fujimoto and Hashimoto2018, Reference Ohi, Takai, Kuramitsu, Sugiyama, Soda, Kitaichi and Shioiri2021c). Thus, we further explored whether PRSs for general cognitive ability (Davies et al., Reference Davies, Lam, Harris, Trampush, Luciano, Hill and Deary2018) or childhood IQ (Benyamin et al., Reference Benyamin, Pourcain, Davis, Davies, Hansell, Brion and Visscher2014) may affect the differences in cognitive performance between the genetic SCZ, genetic BD, and low genetic risk groups. Even after adjusting for the PRSs for general cognitive ability or childhood IQ, our findings were not changed. Our results suggest that genetic factors found in the genetic SCZ risk group contribute to impairments in verbal fluency and attention, while genetic factors found in the genetic BD risk group contribute to protection against impairment in verbal memory although further studies are needed to replicate these findings with larger sample sizes.
It is unclear how the genetic factors in the genetic SCZ risk group are involved in cognitive impairments. These genetic factors may be related to cognitive impairments via changes in gene expression, epigenetics, and/or brain structures/functions. We found that the cognitive continuum is correlated with anterior cingulate cortex volumes (Ohi et al., Reference Ohi, Shimada, Nemoto, Kataoka, Yasuyama, Kimura and Kawasaki2017a). The correlation might be mediated by these genetic factors. Further studies are needed to clarify the mechanisms.
There are some limitations to the interpretations of our findings. The discovery GWASs have different sample sizes and account for different amounts of variance in overall genetic risk. We combined the PRSs based on these GWASs equally. By weighting the sample sizes and amounts of variance, it might be increased accuracy for the combination method. Our findings were not changed even after adding the first four PCs of the genotyping data as covariates to control for population stratification. However, any admixture of PRSs related to European ancestry in Japanese population could be confounding because the genetic architecture of SCZ differs between populations in the reference GWAS compared to populations of Asian ancestry (Lam et al., Reference Lam, Chen, Li, Martin, Bryois, Ma and Huang2019; Ohi, Shimada, Yasuyama, Uehara, & Kawasaki, Reference Ohi, Shimada, Yasuyama, Uehara and Kawasaki2017b). We could not completely exclude the admixture effect even if the PCs were treated as covariates. As the sample sizes of genetic SCZ, genetic BD, and low genetic risk groups were limited, we did not statistically examine direct cognitive differences among the genetic groups. As preliminarily expected, power analysis showed that our analysis of the genetic groups had insufficient power (>0.80) to detect small effect sizes (d = 0.20) for the cognitive differences. A sample size of at least 400 participants for each genetic group is needed to detect such a small contribution to cognitive impairments in groups stratified by genetic risk (d = 0.20). Furthermore, the number of SCZ patients in the low genetic risk group with BACS data was limited (n = 10). The small number of SCZ patients in the low genetic risk group did not permit statistically meaningful comparisons. Cognitive impairments are relatively independent of psychotic (positive and negative) symptoms (Green, Reference Green1996); however, the clinical symptoms and psychiatric medications might affect our outcomes despite no significant differences among patient groups.
In conclusion, this study evaluated the effects of SCZ, BD, and SCZ v. BD PRSs generated from summary statistics published by the PGC on the risks of SCZ and FR status using SNARP data from 444 participants: SCZ patients, their FRs, and HCs. The PRSs for SCZ, BD, and SCZ v. BD were associated with the risk of SCZ, and the PRS for SCZ was associated with FR status. We further assessed the cognitive differences among individuals at the highest level of genetic risk for SCZ or BD and the lowest level of genetic risk for SCZ and BD stratified by combinations of three PRSs. Among SCZ patients, the genetic SCZ risk group showed more severely impaired cognitive scores than the genetic BD risk group. Our findings suggest that the cognitive differences between SCZ and BD patients might be mediated by genetic factors and the assessment of polygenic loads for SCZ and BD, and differentiating SCZ from BD risk variants for patients with SCZ may assist in determining whether psychiatrists could assess and/or treat their cognitive impairments. Moreover, our results provide an indication of the opportunities and limitations that may arise with the future application of a PRS approach in personalized clinical diagnosis and treatment.
Supplementary material
The supplementary material for this article can be found at https://doi.org/10.1017/S0033291722001271.
Acknowledgements
This work was supported by Grants-in-Aid for Scientific Research (C) (19K08081), Scientific Research (C) (21K07497), Scientific Research (C) (22K07614), Young Scientists (B) (16K19784), Young Scientists (20K16624) and KAKENHI Advanced Animal Model Support (AdAMS) (16H06276) from the Japan Society for the Promotion of Science (JSPS); a grant from the SENSHIN Medical Research Foundation; a grant from the Uehara Memorial Foundation; a grant from the Takeda Science Foundation; a grant from the YOKOYAMA Foundation for Clinical Pharmacology (YRY-1807); and a grant from the Smoking Research Foundation. We would like to thank all individuals who participated in this study.
Conflict of interest
None.