


The notion of Glycaemic Index (GI) was introduced two decades ago by Jenkins and co-workers (Jenkins et al. Reference Jenkins, Wolever, Taylor, Barger, Fielden, Baldwin, Bowling, Newman, Jenkins and Goff1981) in order to help patients with diabetes to make optimal food choices in terms of glycaemic control. The GI is a value that refers to the rise in blood glucose that follows the intake of a carbohydrate (CHO)-containing food. CHO foods can thus be classified as a function of their GI. The FAO and WHO have endorsed the use of the GI as a useful method of categorizing CHO foods, as this provides information on the likely metabolic effects of the CHO (Food and Agriculture Organization, 1998). Over the last 20 years, numerous studies have demonstrated that selection of low GI foods, as opposed to high GI foods, induces multiple benefits, not only in patients with diabetes but also in other categories of consumers, among which obese people are one (Ludwig, Reference Ludwig2000).
Low GI diets may benefit weight control in at least two different ways. First, it has been demonstrated that, all else being equal, the ingestion of low GI foods induces stronger, longer satiety than the intake of high GI foods and that subsequent intake is significantly lower (Holt et al. Reference Holt, Brand, Soveny and Hansky1992; Ludwig et al. Reference Ludwig, Majzoub, Al-Zahrani, Dallan, Blanco and Roberts1999; Agus et al. Reference Agus, Swain, Larson, Eckert and Ludwig2000). Second, the metabolic and hormonal consequences of ingesting low GI foods promote fat oxidation, thereby limiting fat storage. High GI foods produce high postprandial hyperglycaemia and hyperinsulinaemia, promoting CHO oxidation at the expense of fat oxidation in a way that theoretically may enhance body fat gain (Brand-Miller et al. Reference Brand-Miller, Holt, Pawlak and McMillan2002). A few studies carried out in children or adults (Slabber et al. Reference Slabber, Barnard, Kuyl, Dannhauser and Schall1994; Toeller et al. Reference Toeller, Buyken, Heitkamp, Cathelineau, Ferriss and Michel2001) indeed suggested that weight loss could be improved by low-fat, low-GI diets. Both metabolic (post-ingestive effects) and motivational (decreased hunger – improved satiety) factors can contribute to such a potential beneficial effect.
Numerous parameters may be improved by low GI diets: the regional distribution of body adipose tissue (decreased android, centralized fat accumulation) (Toeller et al. Reference Toeller, Buyken, Heitkamp, Cathelineau, Ferriss and Michel2001; Bouché et al. Reference Bouché, Rizkalla, Lui, Vidal, Veronese, Pacher, Fouquet, Lang and Slama2002); the structure and function of adipose tissue (Bouché et al. Reference Bouché, Rizkalla, Lui, Vidal, Veronese, Pacher, Fouquet, Lang and Slama2002); leptinaemia and insulin sensitivity (Frost et al. Reference Frost, Keogh, Smith, Akinsanya and Leeds1996, Reference Frost, Leeds, Trew, Margara and Dornhorst1998); blood lipids (Frost et al. Reference Frost, Wilding and Beecham1994, Reference Frost, Leeds, Trew, Margara and Dornhorst1998, Reference Frost, Leeds, Dore, Madeiros, Brading and Dornhorst1999; Jarvi et al. Reference Jarvi, Karlstrom, Granfeldt, Bjorck, Asp and Vessby1999); blood pressure (Sciarrone et al. Reference Sciarrone, Strahan, Beilin, Burke, Rogers and Rouse1993). These parameters are significant biomarkers associated with risk of disease (CHD, type 2 diabetes, metabolic syndrome, etc.).
The present protocol investigated whether encouraging the selection of low GI foods could improve the benefits of the Weight Watchers POINTS® Weight-Loss System as it is now presented to consumers in France. Weight Watchers provides a lifestyle-based, weight-loss programme in thirty countries around the world. The Weight Watchers POINTS® Weight-Loss System includes a food plan that advocates a moderately restrictive diet based on generally accepted nutritional recommendations. It encourages a varied diet with a generous intake of fruits and vegetables and a limited consumption of dietary fats. Within the POINTS Food System, a points value is assigned to a portion of any food and dieters are ascribed a daily points allowance that is designed to induce a weight loss of up to an average of 1 kg per week. Group support is an important part of Weight Watchers and dieters should attend at least one weekly Weight Watchers class. Physical activity is also part of the weight-loss programme. The Weight Watchers POINTS® Weight-Loss System has been proposed to consumers since 1997 and its benefits in terms of short- and long-term weight loss have been confirmed in prospective studies (Heshka et al. Reference Heshka, Anderson, Atkinson, Greenway, Hill, Phinney, Kilotkin, Miller-Kovach and Pi-Sunyer2003). While the basic principles and tenets of the Weight Watchers POINTS Weight-Loss System are universal, the programme is adapted to local recommendations and dietary habits.
Methods
Participants
Participants were recruited among first-time applicants (n 370) to the Weight Watchers programme in January–March 2004 in pre-selected classes in the area of Paris (France). Inclusion criteria were: female; BMI >25 kg/m2; minimum age 18 years; absence of chronic disease (diabetes mellitus, eating disorders, psychiatric disorders) and pharmacological treatment. All women meeting the inclusion criteria were invited to participate in the study, which required two visits to the Hotel-Dieu hospital (once at the beginning and once at the end of the programme) for the assessment of various anthropometric and biochemical parameters. Among eligible women identified in sixteen classes, ninety-six (26 % of all new applications) agreed to participate in the present study. Acceptance or refusal to take part in the study did not change anything in the diet and advice that were provided during the course of the programme in a particular class. It was explained to the participants that Weight Watchers wanted to test whether providing additional nutritional information might improve the existing programme. They were also informed that their participation would involve two physical examinations in a hospital setting, during which blood samples would be drawn. All costs associated with participants' visits to the hospital were covered. As an incentive, the participants were offered three coupons for one free weekly attendance at Weight Watchers classes. The participants signed an informed consent form before the start of the study.
Dietary intervention
Participants attended a weekly Weight Watchers class for 12 weeks. Two groups were formed (GI v. control). Due to Weight Watchers class organization constraints, the subjects were not ascribed randomly to one of the two groups, but rather started the version of the programme that was proposed in the particular class where they applied. Whole classes were randomly ascribed to either the GI (eight classes; n 51; four to sixteen participants per class) or the standard (eight classes; n 45; two to nine participants per class) programme. The GI group received the standard Weight Watchers POINTS® Weight-Loss System, plus additional information about the GI of foods based on the International Table of Glycaemic Index and Glycaemic Load Values 2002 (Foster-Powell et al. Reference Foster-Powell, Holt and Brand-Miller2002). This information was included in the various documents distributed to Weight Watchers members at weekly classes. Weight Watchers' booklets listing foods and their associated points values were modified to emphasize foods with low GI so as to facilitate low GI food choices. The written information provided to participants made it clear what foods of a given type (bread, rice, pasta, potatoes, etc.) had a high or a low GI. Participants in the GI group were encouraged to include at least one low GI food (GI lower than 55 in reference to white bread, according to the International Table of Glycaemic Index Values (Foster-Powell et al. Reference Foster-Powell, Holt and Brand-Miller2002)) at each meal. This definition of ‘low GI foods’ is more stringent than that used by Frost et al. (Reference Frost, Keogh, Smith, Akinsanya and Leeds1996), who showed significant health benefits (increased insulin sensitivity) in CHD patients including at least one low GI food ( < 85 in reference to bread) per meal. In addition to the ‘one-per-meal’ recommendation, the frequent selection of many low GI foods was encouraged, among pasta, wholegrain foods, fruits, beans, pulses and vegetables. Such dietary advice has been used in previous intervention studies, leading to a decrease in the GI of the overall diet of about 20 % (Frost et al. Reference Frost, Keogh, Smith, Akinsanya and Leeds1996).
The control group followed the standard Weight Watchers POINTS® Weight-Loss System. In order to control for the extra nutritional information given to the GI group, participants in the control group received additional information about the French National Nutrition and Health Program (PNNS). This public health programme emphasizes the role of sensible nutrition in the maintenance of health. It advocates a low-fat diet with a high content of fruits and vegetables (at least five per d). It does not deal with the GI concept. This national programme was launched at the end of 2001. A booklet (National Nutrition Guide), designed for the general public, provides various examples of optimal food selection in an everyday life context (French Ministry of Health, 2002). The advice provided by the PNNS Guide is very similar to the Weight Watchers programme, except that it does not explicitly deal with food portions. The participants in the control group received a free copy of the PNNS Guide booklet. Specific aspects of the PNNS recommendations, coinciding with the Weight Watchers diet (increased consumption of fruits and vegetables; increased consumption of Ca; reduced total fat intake; increased consumption of CHO; increased daily physical activity) were discussed in weekly classes.
The standard Weight Watchers POINTS® Weight-Loss System includes the daily selection of various CHO-rich foods, some of which do not have a particularly low GI (e.g. potatoes, white bread, most varieties of rice). As these foods are very popular in the French diet, they were expected to be ingested often by the control group participants, thereby drawing the control diet towards higher GI values than the low GI diet.
Leader training
Before the start of the experiment, leaders of the experimental and control classes received special training, including information about the GI and how to use it in everyday circumstances, and about the PNNS and its relevant nutritional content. Such training was performed in collaboration with the staff of the Diabetes Department of the Hotel-Dieu Hospital. The physicians and dietitians of this department routinely use the GI concept in their clinical practice and explain it to patients with diabetes. The PNNS was also discussed between the medical team and the group leaders. In total, five leaders and sixteen Weight Watchers classes were included.
Food choice check list
In the present investigation, it was important to assess whether the dietary intervention actually led to different diets in the experimental and control groups. In order to obtain dietary data, a food check list was used. This instrument listed 129 popular foods, representing thirteen food categories (dairy products and eggs; meats and poultry; fish; processed meats; bakery products; starch and cereals; vegetables; fruits; nuts and crisps; fats; sweet foods; drinks; ready-to-eat dishes and convenience foods). These foods are discussed both in Weight Watchers and PNNS documents. Each participant reported her food intake for 3 d (two week days and one weekend day), during a randomly selected week during the 12-week programme, by indicating how many times a portion of each of these foods was ingested. Over the whole population, the random distribution of selected weeks allowed the total 12-week weight-loss programme to be covered in both groups (two to three participants reported intake each week).
The food check lists were distributed to the participants at the weekly class before the reporting week and recovered 1 week later by the class leaders. The results were expressed as total numbers of high and low GI food choices over 3 d. Since the participants in the GI group were encouraged to include at least one low GI food at each main meal, it was expected that, in this group, the count of low GI foods over 3 d would be at least 9.
The food check list was preferred to other methods of food intake reporting for several reasons. This method was selected in order to create as little interference with the participants' food selection and everyday life in order to keep the study conditions as close as possible to the usual living conditions of people on a Weight Watchers diet. A detailed reporting of all foods ingested, including amounts and modes of preparation and seasoning, etc., was thought to be counter-indicated in the present study. First, such a method requires extensive training of the participants before the study. Second, it is known that such methods are associated with considerable underreporting in overweight and obese persons (Black et al. Reference Black, Prentice, Goldberg, Jebb, Bingham, Livingstone and Coward1993) and can modify food choices and decrease total intake (Wolper et al. Reference Wolper, Heshka, Heymsfield and Allison1995). In the present study, the main objective of the food report was to make sure that the dietary interventions had the expected effects on food choices. As a consequence, it was felt that a food choice check list, although it could also be subject to some underreporting, would be the easiest and most adequate method to obtain reliable data about food choices, while minimizing the impact of the food-reporting procedure on food choice and intake.
Anthropometric and biochemical outcome measures
The participants visited the Department of Nutrition at the Hotel-Dieu Hospital twice; once at the start of the study and once at the end (12-week interval). The subjects were asked to fast for 12 h before each visit, which was scheduled early in the morning. On both occasions several anthropometric and biochemical measurements were performed.
Height of subjects was measured without shoes using a wall-mounted stadiometer (Seca, Germany). Measurements were taken to the nearest cm. Weight of participants was measured in light clothing and without shoes, using a digital scale (Seca, Germany) with 100 g accuracy. BMI was calculated from the measurements of height and weight. Waist, hip and thigh circumferences were measured as per WHO guidelines (World Health Organization, 1995). The waist:hip ratio was computed.
Blood pressure was measured following a standardized protocol by means of a validated electronic device (STBP-780, Colin, France). Participants were lying bare-armed in a bed, their back angulated at approximately 45° from the ground and supported at heart level. Measurements were performed after at least 10 min rest. Three measurements separated by at least 3-min intervals were averaged for each person. Large cuffs, adequate for the measurement of blood pressure in overweight patients, were used. Both systolic blood pressure and diastolic blood pressure were recorded.
Venous blood samples were obtained for the measurement of plasma concentrations of fasting glucose, insulin and blood lipids. After centrifugation, serum was stored at − 20°C. Plasma glucose was measured by the standard glucose-oxidase method with a glucose analyser (Beckman, Fullerton, CA, USA). Plasma insulin was assessed using a standard RIA procedure (Bi-Ins CisBIo, Schering, France; within-assay CV 3·8 % and between-assay CV 8 %). Blood lipids (total cholesterol, HDL-cholesterol) were determined using Labintest kits (Aix-en Provence, France). LDL-cholesterol was calculated according to the Friedewald formula (Friedewald et al. Reference Friedewald, Levy and Fredrickson1972). Plasma TAG were assayed with Biomérieux kits (Marcy-l'Etoile, France).
Insulin sensitivity was assessed using the homeostasis model assessment procedure (Matthews et al. Reference Matthews, Hosker, Rudenski, Naylor, Treacher and Turner1985; Levy et al. Reference Levy, Matthews and Hermans1998) based on three measurements of both plasma glucose and insulin at 5-min intervals. The index of insulin resistance was computed according to standard formula (Matthews et al. Reference Matthews, Hosker, Rudenski, Naylor, Treacher and Turner1985).
Behavioural and motivational questionnaires
On their two visits at the Hotel Dieu Hospital, the participants filled out two food motivation questionnaires: the Three Factor Eating Questionnaire (Stunkard & Messick, Reference Stunkard and Messick1985); the Dutch Eating Behaviour Questionnaire (van Strien et al. Reference van Strien, Frijters, Bergers and Defares1986). These questionnaires assess various aspects of eating motivation and provide scores that can potentially indicate the source of problems in the control of food intake behaviour.
The Three Factor Eating Questionnaire assesses three dimensions: dietary restraint; disinhibition; hunger. The Dutch Eating Behaviour Questionnaire scores three dimensions: restraint (which is not exactly the same parameter as measured by the Three Factor Eating Questionnaire); ‘emotional eating’; ‘external eating’. Both questionnaires have been translated into French and validated for the French population (Lluch, Reference Lluch1995; Lluch et al. Reference Lluch, Kahn, Stricker-Krongrad, Ziegler, Drouin and Méjean1996).
Hunger, desire to eat and participants' evaluation of the programme
The participants reported their sensations of hunger and desire to eat and their satisfaction with the programme on 1 d per week during the intervention (12 d per participant). The participants could decide what day of the week would be recorded, but were encouraged to record different days on successive weeks. In order to report their sensations over 1 d, each week the participants were supplied with a small booklet, the successive pages of which displayed one visual analogue scale (VAS) per page for the rating of the intensity of one sensation at one specific time of day. The following ratings were made by the participants when appropriate: hunger sensation and desire to eat at wake-up; before and after breakfast, lunch and dinner; before and after mid-morning snack, mid-afternoon snack or evening snacks; at 2-h intervals after the end of one meal or snack, if no further eating occurred. The last three pages of the booklets proposed VAS for the rating of satisfaction with the programme, perceived efficacy and easiness of dietary recommendations.
The VAS were 100 mm vertical lines anchored at either end with phrases expressing extremes of the rated sensation (for example, ‘not hungry at all’ and ‘excessively hungry’ for hunger rating; ‘extremely difficult’ and ‘extremely easy’ for rating the easiness of the dietary programme). The participants made a pencil mark along the line to indicate the intensity of their sensations; these marks were then scored in terms of distance in mm from the base of the line. The VAS ratings could thus vary from 0 to 100. The validity and reliability of the VAS method were recently reviewed and confirmed (Stubbs et al. Reference Stubbs, Hughes, Johnstone, Rowley, Reid, Elia, Stratton, Delargy, King and Blundell2000).
Statistical analysis
The present study was designed to detect group differences of 1 kg in weight loss, given an average weight loss of 4 (sd 0·9) kg (as indicated by a pilot test and Weight Watchers POINTS® Weight-Loss System data), with a power of 90 % and a significance level of 0·05. The minimum number of participants in each group should then be eighteen. The power of the proposed protocol was sufficient to reveal significant effects of GI interventions, as confirmed by previously published studies dealing with the different parameters included in the present experiment (e.g. Frost et al. Reference Frost, Wilding and Beecham1994; Slabber et al. Reference Slabber, Barnard, Kuyl, Dannhauser and Schall1994; Ludwig et al. Reference Ludwig, Majzoub, Al-Zahrani, Dallan, Blanco and Roberts1999).
ANOVA, with group (GI v. control) as a between-subject factor, and time (before v. after diet) as a within-subject factor were computed. SPSS 10 software (SPSS Inc., Chicago, IL, USA) was used for these repeated-measures ANOVA computations. Student's t tests were used to assess the significance of between-group differences in food choice frequency data (number of high and low GI food choices). Subjective sensations and appreciations rated in the weekly VAS booklet (hunger, desire to eat, opinions about the diet) were compared in the two groups at different time points (different weeks, different moments of the day) using a multi-level analysis, where subjects were level 1 and their repeated measurements were level 2; maximum likelihood estimation was used; a compound symmetry covariance structure was included to account for personal consistency in repeated measures for each subject.
P values ≤ 0·05 were considered significant. All values are means with their standard errors.
Ethical considerations
The project was approved by the Ethical Committee of the Hotel-Dieu University Hospital.
Results
In total, ninety-six healthy adult women were recruited as they enrolled in a Weight Watchers class from January to March 2004; fifty-one women were included in the low GI programme and forty-five in the control group.
Attrition
Attrition rate was 32·3 % in the GI group (n 16) and 33·3 % in the control group (n 15). Therefore, thirty-five GI participants (67·7 %) and thirty controls (66·7 %) completed the present study. There was no difference between the participants who finished the study and those who did not for all anthropometric and biochemical parameters measured at the beginning of the programme, except for age, which was lower in women who did not complete the study than in those who did (39·8 (se 2·19) v. 45·7 (se 1·6) years; P = 0·03). The reasons given for interrupting the programme were: lack of time to attend the weekly class; pregnancies; illnesses; one death in the family; one car accident.
Compliance with the dietary recommendations
The food choice check list was filled out and returned by thirty-two GI group and twenty-three control group participants who completed the study. The check lists indicated that women in the GI group selected significantly fewer high GI foods than controls (5·8 (se 0·7) v. 10·7 (se 1·5) over 3 d; P = 0·002); they also tended to select low GI foods more often than controls but the difference failed to reach significance (19·6 (se 1·3) v. 17 (se 1·3) food portions over 3 d; P = 0·18). The difference in high GI food choices resulted from the frequent selection, by control group participants, of potatoes (including mashed potatoes) and high GI rice and bread varieties. GI group participants selected these foods less often. They rather selected pasta and low GI rice, according to the recommendations made to this group. All participants in the GI group ingested at least nine low GI foods over 3 d, confirming compliance with the dietary recommendations. In the control group, three participants ingested fewer than nine low GI foods over 3 d of food recording. In other words, the diet of both groups tended to be rich in low GI food choices (fruits and vegetables mainly), while that of the experimental group included fewer high GI choices.
Group comparisons in pre–post diet parameters
Table 1 presents anthropometric, biochemical and blood pressure data recorded at the beginning and at the end of the diet in subjects who finished the present study. A number of significant differences appeared at the end of the 12-week diets (compared with pre-diet data). In contrast, no difference was attributable to the group (GI v. control) and no group × treatment interaction appeared.
Anthropometric and biochemical values before and after a 12-week weight reducing diet(Mean values with their standard errors)
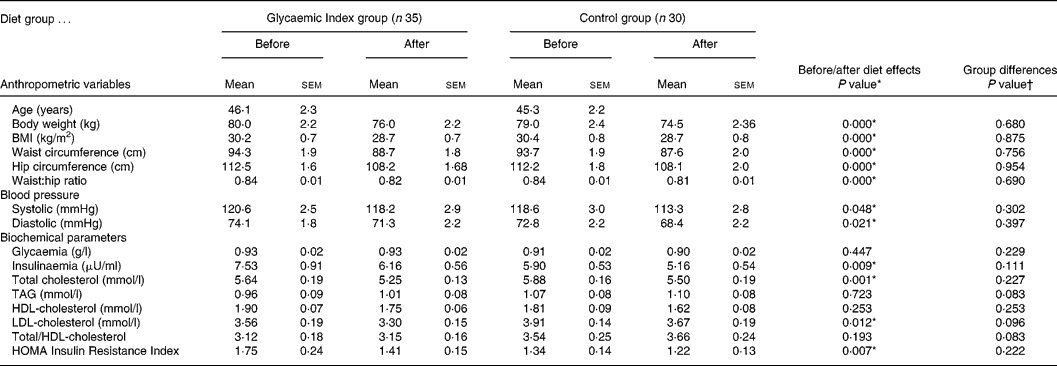
* Significant P values.
† No significant P value for group differences.
HOMA, homeostasis model assessment. For details of subjects and procedures, see Methods section.
Eating questionnaires
Significant changes (P < 0·001) were recorded in all factors of the two eating questionnaires (data not shown). Dietary restraint increased following the diets, while disinhibition, hunger sensations, emotionality and externality decreased significantly. Again, no group effect and no group × time interaction appeared, indicating that the groups were comparable for these variables and that the two diets influenced the outcome in a similar fashion in both groups.
Ratings of subjective sensations and evaluations
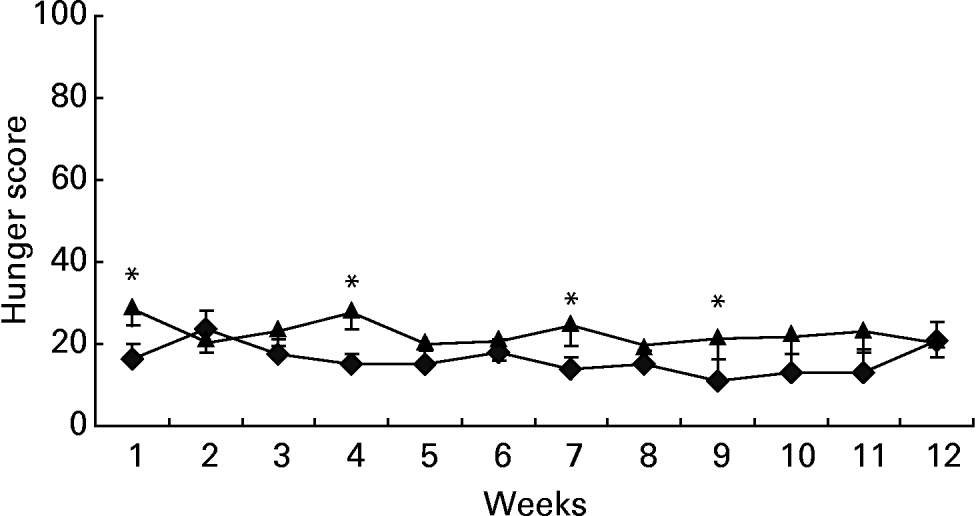
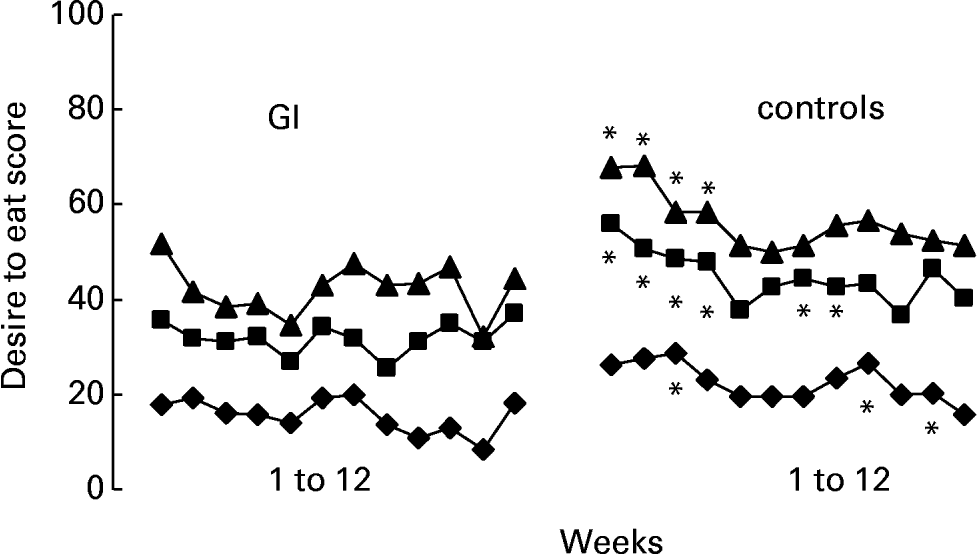
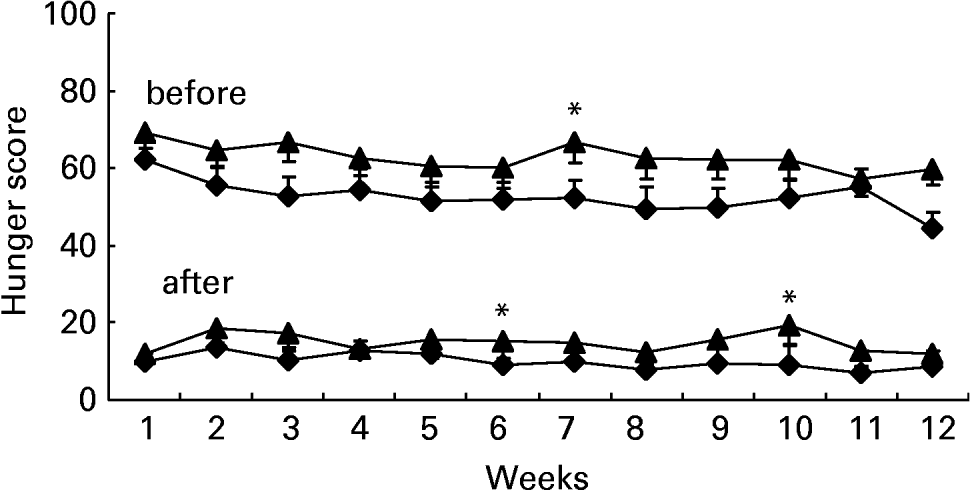
The ratings obtained over 12 weeks at different moments of the day indicated a generally lower intensity of hunger (F 175·07; P < 0·0001) and desire to eat (F 160·09; P < 0·0001) in the GI group participants than in controls (group differences within daytime, controlling for days). This difference is illustrated in Figs. 1–3, showing the levels of either perceived hunger or desire to eat at different moments of the day (2 h after breakfast; 2, 3 and 6 h after lunch; before and after dinner), averaged over the 12 successive weeks. The differences were particularly large in the afternoon, following lunch (Fig. 2).
Ratings of hunger 2 h after breakfast, obtained using visual analogue scales, on 1 d per week for 12 consecutive weeks. ♦, Glycaemic index (GI) group, n 35; ▲, control group, n 30. *Indicates weeks when a significant group difference was found at a particular time of day; P ≤ 0·05. Over 12 weeks, the GI group ratings of hunger were significantly lower than ratings for the control group (P < 0·01). For details of subjects and procedures, see Methods section.
Ratings of desire to eat 2 h (–♦–), 4 h (–■–) and 6 h (–▲–) after lunch, obtained using visual analogue scales, on 1 d per week for 12 consecutive weeks. Glycaemic index (GI) group, n 35; control group, n 30. *Indicates weeks when a significant group difference was found at a particular time of day; P ≤ 0·05. Over 12 weeks, GI group ratings of desire to eat were significantly lower than ratings by the control group (P < 0·01). For details of subjects and procedures, see Methods section.
Ratings of hunger before and after dinner, obtained using visual analogue scales, on 1 d per week for 12 consecutive weeks. –♦–, Glycaemic index (GI) group, n 35; –▲–, control group, n 30. *Indicates weeks when a significant group difference was found: P ≤ 0·05. For details of subjects and procedures, see Methods section.
VAS ratings indicated that participants of both groups were equally satisfied with the dietary programme (VAS 73·2 (se 1·2) v. 69·1 (se 1·2); NS) and that both diets were found equally efficacious (VAS 71·5 (se 1·2) v. 70·4 (se 1); NS). In contrast, the low GI diet was rated significantly easier to follow than the standard diet (VAS 70·2 (se 1·3) v. 65·1 (se 1·3); F 1·97; P = 0·0048).
Discussion
The benefits of weight loss
Earlier reports have established that significant improvements of metabolic status can be obtained in obese individuals after a weight loss representing about 5–10 % of the initial weight (Goldstein, Reference Goldstein1992; Basdevant et al. Reference Basdevant, Laville and Ziegler1998). In the present study, the average body weight loss (about 4·0–4·5 kg) represented about 5 % of initial weight; substantial improvements occurred in a number of physiological as well as behavioural parameters. Most anthropometric measurements decreased as a consequence of the diet, including the waist circumference and the waist:hip ratio, which are established markers for cardiovascular risk (World Health Organization, 2000). Accordingly, both systolic and diastolic blood pressure decreased. Improvements were noted in total and LDL-cholesterol. Insulinaemia significantly decreased as a result of the diets and the homeostasis model assessment tests revealed that the insulin resistance index improved. Several changes in the motivation to eat were substantiated by the eating questionnaires, indicating an increase in the participants' control over eating (increased restraint scores on both the Three Factor Eating Questionnaire and the Dutch Eating Behaviour Questionnaire) and a decreased vulnerability to disinhibition, emotional factors and environmental cues. These observations agree with previous research (Westenhoefer et al. Reference Westenhoefer, Stunkard and Pudel1999).
The benefits of a low Glycaemic Index diet
Previously published studies have documented several beneficial effects of a low GI diet, as compared with a high GI diet, suggesting behavioural and metabolic mechanisms that might crucially help in the management of overweight.
Behavioural benefits
A 2000 review of sixteen studies comparing the effects of ingesting one or many high v. low GI foods concluded that low GI food choices generally increase satiety, decrease hunger and/or decrease voluntary energy intake (Ludwig, Reference Ludwig2000). For example, Ludwig et al. (Reference Ludwig, Majzoub, Al-Zahrani, Dallan, Blanco and Roberts1999) observed a 53 % higher lunch intake following a high GI breakfast than after a low GI breakfast. Since 2000, studies have confirmed Ludwig's conclusions. In obese adolescents, satiety was longer after the ingestion of a low GI meal replacement, in contrast with a high GI meal replacement (Ball et al. Reference Ball, Keller, Moyer-Mileur, Ding, Donaldson and Jackson2003). In another recent study (Warren et al. Reference Warren, Henry and Simonite2003), the effects of three breakfasts (low GI; low GI+sucrose; high GI) were investigated in children using a cross-over design. The GI was 55 in the low GI conditions and varied between 75 and 100 in the high GI condition. Lunch intake was lower after the low GI breakfasts compared with lunch intake after the high GI breakfast.
Weight loss and metabolic benefits
Low GI, high-CHO foods may maintain insulin sensitivity and increase the weight-loss potential of ad libitum low-fat diets (Ludwig, Reference Ludwig2000). Slabber et al. (Reference Slabber, Barnard, Kuyl, Dannhauser and Schall1994) studied obese women who consumed two energy-restricted diets, with either high or low GI, in two consecutive cross-over 12-week periods. Although no difference in diet outcome could be attributed to the GI of the diet in the earlier part of the study, the low GI diet induced higher weight loss in the latter part of the study and induced a reduction in fasting insulin concentrations. In the management of paediatric obesity, low GI diets were compared with conventional low-fat diets and were found to induce a larger weight loss, even after adjustment for age, sex, ethnicity, baseline BMI and baseline weight (Spieth et al. Reference Spieth, Harnish and Lenders2000). A study by Bouché et al. (Reference Bouché, Rizkalla, Lui, Vidal, Veronese, Pacher, Fouquet, Lang and Slama2002) suggested that a low GI diet might facilitate loss of abdominal fat tissue in obese adults, even when body weight did not change.
In the present study, while diet-induced weight loss was associated with beneficial changes in physiological and behavioural variables, the differences attributable to the GI intervention were comparatively modest. Attrition was the same in both GI and control groups. This attrition rate is comparable with that observed after 16-week weight-loss programmes (Teixeira et al. Reference Teixeira, Going, Houtkooper, Cussler, Metcalfe, Blew, Sardinha and Lohman2004; Honas et al. Reference Honas, Early, Frederickson and O'Brien2005) and much lower than the attrition rates (up to 65 %) reported in a variety of commercial weight-loss programmes currently available in the USA (Tsai et al. Reference Tsai, Gilden Sai and Wadden2005). The many improvements in anthropometric, biochemical or body composition parameters were not different between groups. While at variance with the earlier cited literature, the present results agree with recently published studies of the impact of the GI concept in the context of body weight control programmes. Education on the GI of foods failed to improve weight loss or body fat loss following a behavioural weight loss programme (Carels et al. Reference Carels, Darby, Douglass, Cacciapaglia and Rydin2005). In a 10-week parallel, randomized, intervention trial, either low or high GI foods were provided as replacements for overweight subjects' usual CHO-rich foods (Sloth et al. Reference Sloth, Krog-Millelsen, Fling, Tetens, Bjorck, Vinou, Elmstahl, Astrup, Lang and Raben2004); as a result, food intake, body weight and fat mass decreased over time but no differences were noted between subjects receiving high or low GI foods. It is not clear why some studies report GI-associated differences in weight outcomes while others do not. Perhaps the actual amplitude of the difference in GI between the compared diets can vary in different studies and can affect the likelihood of obtaining significant treatment differences. In the present study, the GI instructions were given in the particular context of the Weight Watchers POINTS diet, which is to say that one group received explicit encouragement to select low GI foods several times per d, while many other aspects of dietary instructions were identical for both groups: number of points allowed per d; instructions for cooking; limitation of fat intake, etc. Within this particular context, the question remains open of whether the recommendation to select low GI foods several times per d created a large enough difference between the two diets to obtain significant differences in objective parameters. The food check list method used in the present study, in order to assess the intake of CHO-rich foods, does not allow the computation of a global GI for the diet of individual subjects. While this is an obvious limitation of the present study, it is unlikely that a valid assessment of the global GI during the diets could have been obtained using other more burdensome, more complex methods. As explained earlier, such methods require extensive training of the participants, are incompatible with the Weight Watchers programme and are associated with under-declaration and modified food choices (Black et al. Reference Black, Prentice, Goldberg, Jebb, Bingham, Livingstone and Coward1993; Wolper et al. Reference Wolper, Heshka, Heymsfield and Allison1995). They would thus be unlikely to yield unquestionable global GI values, in spite of the very demanding food recording procedures.
In contrast with the afore-mentioned parameters, consistent differences were observed between GI and control participants in their ratings of subjectively perceived sensations at various times of day, using VAS. Participants of the GI group reported lower levels of hunger and desire to eat. This observation was very consistent over days (from morning to night) and weeks (from the beginning to the end of the 12-week diets) and agrees with the notion that a lower GI diet decreases hunger. The contrast between the two groups was especially clear in the afternoon hours (Fig. 2), during which the motivation to eat was considerably lower in the GI group. Traditionally in France, there is a long delay between lunch and dinner. Lunch is generally consumed between 12.00 and 13.00 hours, while dinner does not take place before 19.30 or 20.00 hours. Being less hungry during this rather long period of time and experiencing a lower desire to eat should theoretically make the diet more comfortable. The low GI was indeed reported to be easier to follow than the control diet, as assessed by VAS. Satisfaction with the diet and ratings of efficacy, however, were not significantly different. These scores were high for both diets.
The interpretation of the lower hunger and desire to eat in the low GI group is open to question. This may result from the previously reported satiating effects of low GI foods and diets (Ludwig, Reference Ludwig2000; Ball et al. Reference Ball, Keller, Moyer-Mileur, Ding, Donaldson and Jackson2003). An alternative explanation, which cannot be ruled out, could be that the GI group participants actually ate more than the controls during the diet. As a result of this relatively higher energy intake, the low GI group participants would exhibit lower levels of hunger and desire to eat on the one hand, and a somewhat lower (but not significantly so) weight loss than the controls on the other hand. This hypothesis can be examined. Weight loss results from a negative energy balance, in other words, ingesting less energy than one spends. The difference in weight loss between the two groups was 0·5 kg, indicating that in the control group the total deficit in energy was about 14 651 kJ or 3500 kcal (1 kg being equivalent to 29 300 kJ) larger than in the GI group, for the total duration of the diet (12 weeks). This difference, distributed over the 84 d of the diet programme (7 d × 12 weeks), amounts to less than 176 kJ (42 kcal) per d. It is unlikely that such a low difference in daily energy intake could have been sufficient to account for consistently lower ratings of hunger and desire to eat from morning to evening over the whole duration of the programme. The present observations are thus consistent with the notion that a low GI diet, followed for some length of time, tends to buffer hunger sensations and mitigate desire to eat in comparison with a higher GI diet, although the possibility that unequal energy intakes contributed to the effect cannot be ruled out.
Alternative explanations for the consistent differences in hunger and satiety sensations can be proposed. The energy density of foods contributes to their satiating effects; the total weight or volume of food consumed, the nutrient composition of the diet (particularly its protein content) could also affect satiety. All these factors may have played a role in the observed group differences. It is difficult, however, to see how a systematic bias in diet volume, protein content or energy density could have caused consistent robust differences over 12 weeks between two groups of subjects who were essentially prescribed an identical diet (in terms of amounts of food, protein content, etc.), with identical cooking and seasoning recommendations. The possible role of hormones in mediating satiety, especially in short-term weight management programmes, should also be considered; some differences due to particular food choices may have induced group differences in the present study. The low GI conditions likely induced lower postprandial insulin secretion and also possibly lower secretion of counter-regulatory hormones such as glucagon. Whether other satiety hormones, such as cholecystokinin, could also vary according to the GI of a diet remains to be determined by further research.
In conclusion, the present study showed that extra emphasis on the GI of foods did not produce greater biological benefits than those obtained after 12 weeks on the regular Weight Watchers programme. One novel observation is that, over the course of the 12-week programmes, the participants in the low GI group reported lower levels of hunger and desire to eat. In addition, the low GI diet was found to be easier to follow. It could be hypothesized that a low GI diet might help longer-term adherence, which is the critical issue in the management of overweight as a chronic condition. These motivational aspects remain to be demonstrated by further investigation.
It is conceivable that a 12-week study was too short to demonstrate any effects of the low GI diet on weight loss. The beneficial effects of the low GI diet due to lower levels of hunger and desire to eat should be evaluated in long-term studies in which the energy and nutrient intake would be more precisely defined and controlled. Such a diet should yield the same energy deficit in both groups differing in the GI. As such a well-controlled protocol is hardly accessible, the method used in the current study (employing the food check list) was an alternative solution to evaluate food intake in an out-patient setting.
Acknowledgements
This work was supported by a research grant from Weight Watchers International, Inc.



