Introduction
The specific surface mass balance of a snow/ice surface (SSMB, units kg m-2 yr-1) can be written as the annual sum of precipitation (PR), surface sublimation (SU), meltwater runoff (RU) and erosion (ERds) and sublimation of drifting snow particles (SUds):

Although of secondary importance for the area-integrated surface mass balance of the Antarctic ice sheet (Van de Berg et al. Reference van De Berg, van Den Broeke and van Meijgaard2006), sublimation and melting/runoff may exert a large influence on the local mass balance (Frezzotti et al. Reference Frezzotti, Pourchet, Flora, Gandolfi, Gay, Urbini, Vincent, Becagli, Gragnani, Proposito, Severi, Traversi, Udisti and Fily2004). The disintegration of ice shelves in the Antarctic Peninsula has been - in part - ascribed to enhanced summer melting (Scambos et al. Reference Scambos, Hulbe and Fahnestock2003, Sergienko & Macayeal Reference Sergienko and Macayeal2005, Van den Broeke Reference van Den Broeke2005), following a rapid regional warming (Morris & Vaughan Reference Morris and Vaughan2003, Vaughan et al. Reference Vaughan, Marshall, Connolley, Parkinson, Mulvaney, Hodgson, King, Pudsey and Turner2003). In combination with snowdrift erosion, sublimation is thought to be responsible for the formation of blue ice areas (Takahashi et al. Reference Takahashi, Naruse, Nakawo and Mae1988, Van den Broeke et al. Reference van Den Broeke, van De Berg, van Meijgaard and Reijmer2006). Moreover, melting and sublimation both influence the isotope signal in ice cores (Masson-Delmotte et al. Reference Masson-Delmotte, Hou, Ekaykin, Jouzel, Aristarain, Bernardo, Bromwich, Cattani, Delmotte, Falourd, Frezzotti, Gallée, Genoni, Isaksson, Landais, Helsen, Hoffmann, Lopez, Morgan, Motoyama, Noone, Oerter, Petit, Royer, Uemura, Schmidt, Schlosser, Simoes, Steig, Stenni, Stievenard, van Den Broeke, van De Wal, van De Berg, Vimeux and White2008). Snowdrift sublimation cools the air and enhances katabatic winds (Gosink Reference Gosink1989) while melt disturbs the passive microwave signal that is used as a proxy for accumulation (Magand et al. Reference Magand, Picard, Fily, Brucker and Genthon2008). Both melt and sublimation are expected to increase in a warming climate, so a good understanding of these processes is required to more accurately predict the future mass balance of the Antarctic ice sheet.
Several techniques exist to quantify melting and sublimation on the Antarctic ice sheet. The presence of liquid water in the snowpack can be detected by passive and active microwave sensors onboard satellites (Zwally & Fiegles Reference Zwally and Fiegles1994, Fahnestock et al. Reference Fahnestock, Abdalati and Shuman2002). Picard & Fily (Reference Picard and Fily2006) and Picard et al. (Reference Picard, Fily and Gallée2007) present 26-year (1981–2006) climatology of Antarctic melting using data from the Scanning Multichannel Microwave Radiometer (SMMR) and three Special Sensor Microwave Imager (SSM/I). The average period during which liquid water is detected in the snowpack shows large interannual variability, but ranges on average from 1–10 days on the Ross and Filchner–Ronne ice shelves, 10–30 days on the ice shelves fringing the more northerly coasts of East Antarctica and Marie Byrd Land in West Antarctica, and 30–90 days for ice shelves in the Antarctic Peninsula.
Alternatively, regional atmospheric climate models can be used to assess the SSMB components. Van den Broeke et al. (Reference van Den Broeke, van De Berg, van Meijgaard and Reijmer2006) used output of the RACMO2/ANT model to calculate annual meltwater production and surface/snowdrift sublimation in Antarctica (kg m-2 yr-1, Fig. 1). The model predicts melting to occur primarily on the low-lying ice shelves, with annual mean meltwater fluxes ranging from 0–20 kg m-2 yr-1 on the Ross and Filchner–Ronne ice shelves, up to 100 kg m-2 yr-1 on the northernmost East Antarctic ice shelves and in excess of 400 kg m-2 yr-1 on ice shelves in the Antarctic Peninsula (Fig. 1a). Melt is predicted to occur up to elevations of 1500–2000 m, in accordance with recent reports (Nghiem et al. Reference Nghiem, Steffen, Neumann and Huff2008). Modelled sublimation (the sum of surface and snowdrift sublimation, Fig. 1b) is largely controlled by temperature, and peaks at lower elevations during summer with values regionally also in excess of 400 kg m-2 yr-1.
a. Annual melt, and b. total (surface and snowdrift) sublimation in kg m-2 yr-1 from a regional atmospheric climate model (RACMO2/ANT). Adapted from Van den Broeke et al. (Reference van Den Broeke, van De Berg, van Meijgaard and Reijmer2006). Arrows indicate the location of Neumayer Station, dashed lines 500 m elevation contours.

Both satellite and model data require validation, but in situ melt rate and sublimation of Antarctic snow are difficult to measure. Meltwater readily penetrates the porous firn to refreeze at some depth, and while surface sublimation can be measured using evaporation pans (Fujii Reference Fujii1979) or eddy correlation sensors, these instruments are not suitable for year-round operation. In this paper we use 13 years of hourly observations from Neumayer station (coastal East Antarctica) to drive a model that calculates the full energy balance, including melt and surface sublimation, and estimates snowdrift sublimation.
Methods
Surface energy balance model
Equation
(2)describes the energy balance for a ‘skin’ surface layer without heat capacity, i.e. all terms are evaluated at the surface and are defined positive when directed towards the surface:

where M is melt energy (M = 0 if the surface temperature T s < 273.15 K), SWin and SWout are incoming and reflected shortwave radiation fluxes, LWin and LWout are incoming and emitted longwave radiation fluxes, SHF and LHF are the turbulent fluxes of sensible and latent heat and Gs is the subsurface conductive heat flux. Penetration of shortwave radiation and heat added to the surface by precipitation are neglected.
To solve Eq. (2), near surface observations are fed into a 1D surface energy balance (SEB) model that searches iteratively for a surface temperature T s for which Eq. (2) is valid. The SEB model has an atmospheric part and a subsurface part. In the atmospheric part, SWin, SWout and LWin are taken from (corrected) observations. Next, SHF and LHF are calculated using the bulk method, the vertically integrated version of the flux-profile relations. The bulk method uses single-level wind speed, temperature and relative humidity data in combination with modelled T s to determine the turbulent velocity (u*), temperature (θ*) and humidity (θ*) scales. These are then used to calculate the turbulent fluxes following:

where ρ = air density, cp = specific heat of air at constant pressure and Ls = latent heat of sublimation. Also required for the calculation of the turbulent fluxes is the surface aerodynamic roughness length z0, which is calculated using 2 and 10 m wind speed. As no clear seasonal cycle was found, a constant value of log(z0) = -3.5 was adopted for no-drift conditions (König-Langlo Reference König-Langlo1985). The roughness lengths for heat zh and moisture zq are calculated as a function of u* and z0 using the expressions of Andreas (Reference Andreas1987). A direct comparison with eddy correlation measurements is not possible, but previous studies have shown that the bulk method performs well in Antarctica (Van den Broeke et al. Reference van Den Broeke, Reijmer and van De Wal2004b, 2005a).
The subsurface part of the model calculates temperature profiles and subsurface heat flux (G) in 4 cm thick snow layers for the upper 20 m of the snowpack, below which G is assumed to vanish. Heat conductivity is made a function of snow density, following Anderson (Reference Anderson1976), and surface snow density is set to 420 kg m-3 and kept constant with depth. The model tracks meltwater that is formed at the surface and lets it refreeze in the snowpack using a bucket method, i.e. vertical transport of meltwater is assumed quasi-instantaneous (within the time step of six minutes). To allow liquid water to remain in the upper snow layers, a capillary meltwater retention of maximum 2% of the available pore space is prescribed.
Meteorological input data
For this paper we use 13 years of hourly mean meteorological data (1 January 1995–31 December 2007) collected at the German Antarctic station Neumayer (70°39′S, 8°15′W, 40 m a.s.l., indicated by the arrows in Fig. 1). Neumayer is situated on Ekströmisen, an ice shelf fringing the East Antarctic Ice Sheet in the north-eastern Weddell Sea. The radiation measurements at Neumayer comply with the standard of the Baseline Surface Radiation Network (BSRN). Furthermore we use 10 m wind speed and 2 m temperature/relative humidity measurements to calculate the turbulent fluxes of sensible and latent heat. Relative humidity measurements are corrected along the lines of Anderson (Reference Anderson1994), while shortwave radiative fluxes are treated according to the method described by Van den Broeke et al. (Reference van Den Broeke, van As, Reijmer and van De Wal2004a). The radiation data of Neumayer are accessible through the Pangea database (www.pangaea.de).
Results: surface energy balance
Validation of modelled surface temperature
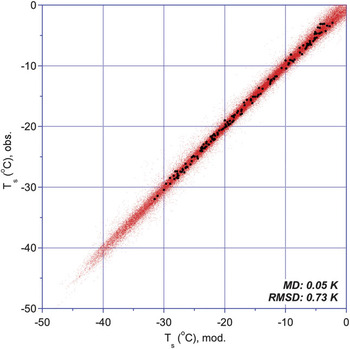
The most direct way to validate the SEB model is to compare modelled and observed hourly mean surface temperature Ts, where ‘observed’ Ts is derived from LWout, assuming the surface to have unit longwave emissivity. Figure 2 shows the result. Agreement for hourly (monthly) values is very good, with a mean difference (MD) of 0.05 K (0.04 K) and a root mean squared difference (RMSD) of 0.73 K (0.45 K). This shows that all relevant processes are included and that the modelled SEB components are robust.
Comparison of observed and modelled surface temperature, for hourly means (red dots) and monthly means (black dots).

Seasonal cycle of surface layer climate and turbulent scales
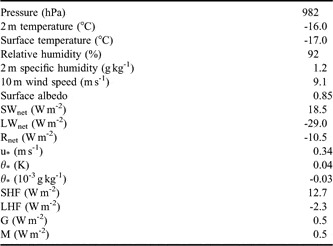
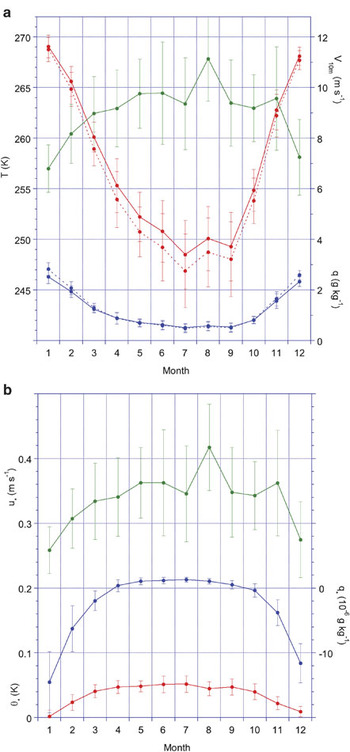
Table I shows annual means and Fig. 3a the average seasonal cycle of 10 m wind speed (V10m), temperature at 2 m and the surface (T2m, Ta) and specific humidity at 2 m and the surface (q2m qs). Owing to the proximity of the Weddell Sea, which is covered by sea ice for most of the year, Neumayer is relatively cold (König-Langlo et al. Reference König-Langlo, King and Pettré1998) compared to coastal stations further east. The high wind speeds are caused by frequent passages of low-pressure areas in the southern Atlantic Ocean, forcing strong easterlies over the coastal ice shelves of Dronning Maud Land. The seasonal cycle of wind speed shows a clear wintertime maximum, with monthly mean 10 m wind speed close to or in excess of 10 m s-1 (Fig. 3a). Because the ice shelf is almost flat, this is likely caused by enhanced depression activity and the outflow of cold air that piles up on the shelf as a result of enhanced katabatic activity further inland rather than local katabatic forcing.
Annual means at Neumayer for the standard run (1995–2007).

Average (1994–2006) seasonal cycle of a. 2 m (solid lines) and surface (dashed lines) temperature/specific humidity and 10 m wind speed, and b. turbulent scales of velocity (u*), temperature (θ*) and specific moisture (θ*). Error bars indicate standard deviation of the monthly means (1995–2007).

Table I shows annual means and Fig. 3b the seasonal cycle of turbulent scales of velocity (u*), temperature (θ*) and moisture (θ*). Because of the high wind speed, stability effects are modest and the seasonal cycle of friction velocity u* mirrors variations in 10 m wind speed. The occasional daytime convection in summer is not sufficient to reverse the monthly mean near-surface temperature gradient (Fig. 3a), although stratification is considerably weaker than in winter. This is reflected in the magnitude of the turbulent temperature scale θ*, which peaks in winter and becomes small in summer (Fig. 3b).
At Neumayer, relative humidity has a weak seasonal cycle (not shown), with maximum monthly mean values (∼96%) in winter and minimum values (∼88%) in summer. That is why specific humidity in first order follows temperature (Fig. 3a). In contrast to temperature, the specific humidity gradient changes sign from weakly positive (deposition) in winter to negative (sublimation) in summer, which is reflected in the seasonal cycle of the turbulent moisture scale θ* (Fig. 3b).
Seasonal cycle of surface energy balance components
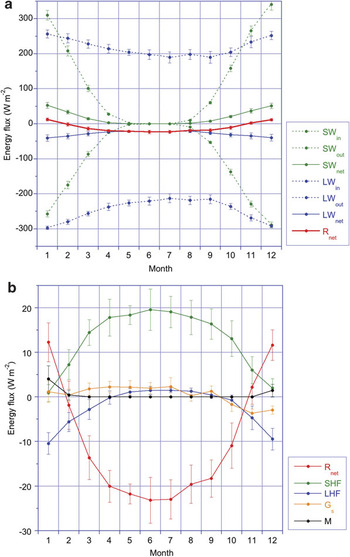
Table I shows annual means and Fig. 4a the average seasonal cycle of radiation components SWnet, LWnet and Rnet. As is typical for an Antarctic site with high albedo (0.87) and little melt, annual mean Rnet is negative (-10.5 W m-2); only in the summer months December and January, when sufficient solar radiation is absorbed at the snow surface, does Rnet become positive; Rnet∼0 during the transition months February and November.
Average (1994–2006) seasonal cycle of a. radiation components, and b. surface energy balance components. Error bars indicate standard deviation of the monthly means (1995–2007).

Figure 4b shows the average seasonal cycle of SEB components. During winter, the radiative heat loss is compensated in first order by SHF and in second order by Gs and LHF. The transport of sensible heat towards the surface is primarily driven by the radiative cooling, which maintains the required temperature gradient between surface and atmosphere, and persistent winds, which generate the wind shear necessary to overcome the static stability in the SL.
The most important difference between Neumayer and inland katabatic wind sites is that there is no coupling between cooling and wind speed, as is the case with katabatic flow. During December and January, Rnet becomes positive which is compensated mainly by sublimation (LHF) and in second order by melting (M) and the subsurface heat flux. The seasonal cycle in sublimation is comparable to that observed at Halley, a station situated on the Brunt Ice Shelf further west (King et al. Reference King, Anderson and Mann2001).
SEB snapshots
To illustrate in more detail the conditions that are favourable for sublimation and melting at Neumayer, Fig. 5 shows wind speed, observed and modelled surface temperature Ts and SEB components at hourly resolution for a typical ∼two-week period in winter (a) and summer (b). During the winter episode (Fig. 5a), surface temperature Ts varies between -10 and -30°C. Under these cold conditions, moisture concentrations/gradients are very low and LHF is small, typically < 10 W m-2. Two events with wind speeds as high as 30 m s-1 signify the passing of a low-pressure system north of Neumayer. During these events, clouds limit the longwave radiation loss, which in turn limits the near-surface temperature gradient, causing the other fluxes to be small as well.
Snapshots of a. wintertime, and b. summertime wind speed, surface temperature (observed and modelled, upper legend) and surface energy balance components (lower legend).

During clear-sky conditions in winter, Rnet decreases to values as low as -70 W m-2. When winds are sufficiently strong, the radiative energy loss is compensated by SHF (e.g. 21 June); in the absence of strong winds, however, SHF is not large enough to compensate the radiative heat loss and as a result Ts decreases rapidly (e.g. 23 June). In combination with subsurface snow layers that are still relatively warm, this enhances Gs, which quickly becomes comparable in magnitude to SHF.
The summertime SEB is considerably more complex, with a pronounced daily cycle in all components (Fig. 5b). Cloudy conditions are often associated with the passage of cyclones, enhanced wind speeds (∼20 m s-1) and a strongly reduced daily cycle. When the air is dry, sublimation efficiently cools the surface, reducing the probability of melting to occur (e.g. 13–14 January). If the air is moist, sublimation is reduced and melting occurs more readily with daytime peak values of 30 W m-2 (e.g. 8–10 January).
During clear conditions, noontime Rnet reaches values up to 135 W m-2. This forces convection (negative SHF) and significant sublimation (negative LHF), the latter reaching values between 30 and 50 W m-2. This strong sublimation prevents the occurrence of deeper convection at coastal sites compared to the interior (Van den Broeke Reference van Den Broeke2005b, King et al. Reference King, Argentini and Anderson2006). When melt occurs, Ts can no longer increase, which reduces heat losses by Gs, SHF, LHF and LWnet. Additional energy is invested in melting (M), which attains hourly mean values up to 90 W m-2, equivalent to a meltwater production of ∼1 kg m-2 hr-1 (e.g. 3, 5 and 6 January).
Figure 5b also demonstrates the major difficulty that arises when using observed Ts to detect melt events: even during strong, unequivocal melt conditions, observed Ts may still be <0°C, which is the result of uncertainties in observed LWout. This stresses the advantage of using an SEB model to quantify melt from in situ data, even though the absolute modelled amount of melt and sublimation remains difficult to validate.
Results: sublimation and melt
Surface sublimation
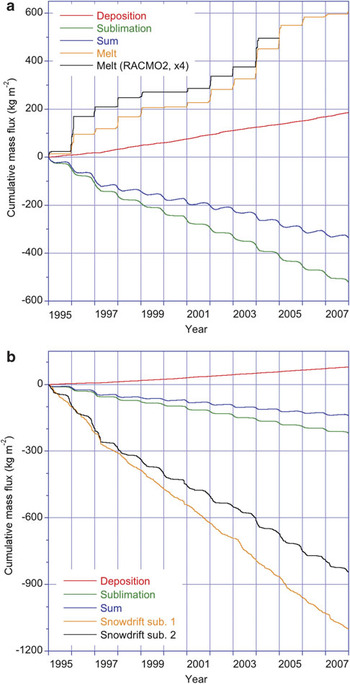
Figure 6a shows the cumulative sublimation (LHF < 0, green line), deposition (LHF > 0, red line) and their sum (blue line) for the control run, in which snowdrift is not allowed. Sublimation averages 40 kg m-2 yr-1, with little interannual variability (σ = 8 kg m-2 yr-1), while deposition averages 14 kg m-2 yr-1, with similarly small interannual variability (σ = 3 kg m-2 yr-1). As shown in the previous section, sublimation is primarily temperature-driven, making it almost exclusively a summer phenomenon, while deposition primarily occurs in winter. The net effect is that on average the turbulent moisture flux removes 26 kg m-2 yr-1 from the surface. Schlosser & Oerter (Reference Schlosser and Oerter2002) used firn cores to determine the 1955–97 mean accumulation rate at Neumayer: 374 kg m-2 yr-1 (s = 87 kg m-2 yr-1). This suggests that, in the control run, 7% of the snowfall at Neumayer is removed from the surface by sublimation.
Cumulative surface mass fluxes at Neumayer for a. the control run (no snowdrift allowed), including melt from RACMO2/ANT (black line), and b. the snowdrift run. In the snowdrift run, melting remained unchanged and is not shown.

Potential impact of snowdrift sublimation
We investigate the potential impact of snowdrift sublimation by applying two bulk drifting snow sublimation formula of Déry & Yau (Reference Déry and Yau2001) and Bintanja & Reijmer (Reference Bintanja and Reijmer2001). We use a constant threshold friction velocity for drifting snow of u*t = 0.3 m s-1, which for the value of z0 adopted here corresponds to a threshold 10 m wind velocity of 7.8 m s-1. This wind speed is exceeded during 43% of the time at Neumayer. Using a more realistic, time-varying value of u*t as in Gallée et al. (Reference Gallée, Guyomarch and Brun2001) is not possible owing to a lack of information about the state of the surface.
During snowdrift conditions, the near-surface air quickly becomes saturated (Déry et al. Reference Déry, Taylor and Xiao1998) and under these conditions we assume surface sublimation to cease. Figure 6b shows cumulative deposition (LHF > 0, red line), surface sublimation (LHF < 0, green line) and their sum (blue line) as well as cumulative snowdrift sublimation for the expression of Bintanja & Reijmer (Reference Bintanja and Reijmer2001, black line) and the expression of Déry & Yau (Reference Déry and Yau2001, orange line). Because of enhanced particle ventilation, snowdrift sublimation is clearly more effective than surface sublimation and, when averaged for both methods, equals 75 kg m-2 yr-1. Surface moisture exchange, which is set to zero during snowdrift, decreases to 17 kg m-2 yr-1, deposition to 6 kg m-2 yr-1, and the net effect to 11 kg m-2 yr-1. Including snowdrift sublimation thus more than triples the total sublimation compared to the run without snowdrift (86 vs 26 kg m-2 yr-1), a stronger effect than was observed using AWS data further west where the effect was roughly a doubling (Van den Broeke et al. Reference van Den Broeke, Reijmer and van De Wal2004b). If correct, this suggests that 17% of the snowfall at Neumayer is removed from the surface by snowdrift sublimation and only 2% by surface sublimation.
We compare our results to those obtained by King et al. (Reference King, Anderson and Mann2001) for Halley Station (75°35′S, 26°25′W, 30 m a.s.l.). Being situated on the Brunt ice shelf, Halley has a geographic setting comparable to Neumayer, albeit considerably further south. As a result, annual mean temperature (-18.7°C) is 2.7°C lower than Neumayer, and 10 m wind speed (6.5 m s-1) 2.6 m s-1 lower. As a result, snowdrift frequency is about 25% at Halley, compared to 43% at Neumayer. King et al. (Reference King, Anderson and Mann2001) estimated total annual sublimation at Halley to be 57 kg m-2, less than the 86 kg m-2 yr-1 we found for Neumayer; the difference is fully accounted for by snowdrift sublimation (39 vs 75 kg m-2 yr-1). At both stations, sublimation removes a considerable fraction of the annual snowfall (10% at Halley, 19% at Neumayer).
Melt
At Neumayer, as in most places in Antarctica, all meltwater refreezes in the cold snowpack, eliminating runoff (RU) as a contribution to the SSMB. Figure 6a (orange line) shows cumulative meltwater production from the SEB model. Seasonal meltwater production averages 47 kg m-2 yr-1, but with very large interannual variability (σ = 36 kg m-2 yr-1): the cold summer of 2000/01 experienced less than 3 kg m-2 of melt while the mild summer of 2003/04 had more than 125 kg m-2 of melt.
These numbers can be used to validate melt data from climate models and satellites. The black line in Fig. 6a represents cumulative melt at Neumayer for the period 1994–2004 extracted from the regional atmospheric climate model RACMO2/ANT that was used for Fig. 1a. Interannual variability in M is well reproduced by the regional model, but modelled melt must be enhanced by a factor of ∼4 to achieve quantitative agreement. A closer look at the SEB components reveals that the description of albedo in this particular version of the regional climate model does not reproduce the observed rapid albedo decrease when the surface is melting (Fig. 7). This demonstrates how in situ SEB modelling can be used to improve the representation of surface processes in atmospheric models.
Observed albedo at Neumayer (red symbols) and albedo from a regional climate model (blue symbols).

Figure 8a compares the vertically integrated amount of liquid water in the snowpack at Neumayer (daily mean in millimetres, red line) with the satellite liquid water detection algorithm from Picard & Fily (Reference Picard and Fily2006) for the summer of 2005/06. If we apply a threshold of 0.1 mm, the SEB model and satellite agree on the five days where liquid water was present in the snow, suggesting that the satellite detection algorithm is very sensitive. The green line in Fig. 7a shows that meltwater production in excess of 0.1 mm occurred on as many as 15 days, but that on 10 of these days the meltwater instantaneously refroze so that no liquid water was present in the snow. Fig. 8b summarizes the number of days per summer that a) the total amount of meltwater formed exceeded 0.1 mm, b) the daily average amount of vertically integrated liquid water exceeded 0.1 mm, c) that the satellite detected liquid water in the snow, and d) the total amount of meltwater formed in that summer.
a. Comparison of in situ calculated daily M (green line), LW amount (red line) and satellite-observed LW days (blue line) in the snowpack at Neumayer. b. 1994–2006 total in situ calculated summer M (orange line) and number of days per melt season with in situ daily M > 0.1 mm (green line), LW > 0.1 mm (red line) and LW detected by satellite (blue line).

When we apply the 0.1 mm threshold to the full period 1994–2006, we find a good correlation (r = 0.96) between the number of satellite-detected liquid water days (Fig. 9, blue line) and days with liquid water from the SEB model (red line). We also find a good correlation (r = 0.90) between satellite-detected liquid water days and calculated melt days (green line), with an offset of about 12 days. Finally, a good correlation also exists between satellite-detected liquid water days and total melt (red line, r = 0.96), but we expect that this relation is not universal for the whole of Antarctica. Nonetheless, combining satellite data with in situ melt rates shows promising results for future applications and may have the potential to derive melt rate from satellite products.
Number of days per melt season with in situ LW > 0.1 mm (blue symbols), number of days with total daily M > 0.1 mm (green line), and total summer M (red line) as a function of LW days as detected by satellite, at Neumayer.

Sensitivity tests
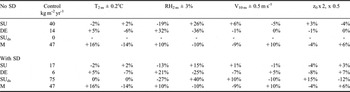
To test the sensitivity of the modelled cumulative sublimation/deposition and melt to uncertainties in the observations, we performed 20 sensitivity runs in which a systematic bias with the magnitude of the instrumental error was prescribed in one of the input variables: +/-0.2°C for temperature, +/-3% for relative humidity, +/-0.5 m s-1 for wind speed and a factor 2 for the surface momentum roughness z0. The changes were applied to both the run with and without snowdrift. The results are summarized in Table II.
Sensitivity of annual cumulative surface sublimation (SU), deposition (DE), snowdrift sublimation (SUds) and melt (M) for indicated changes in 2 m temperature, relative humidity, 10 m wind speed and a doubling/halving of surface momentum roughness for the run without snowdrift (upper part) and run with snowdrift (lower part).

Sublimation and melt are moderately sensitive to temperature and wind speed (-14% to +16%). In the non-snowdrift run, changing the surface roughness does not have a large impact on the cumulative mass fluxes (-4% to +6%). This is partly caused by the compensating effect of the Andreas (Reference Andreas1987) expression, which lowers zh when z0 is increased. In the snowdrift run, the sensitivity to changes in z0 are larger (up to 15%), because it directly impacts on u* and hence the snowdrift frequency.
In the non-snowdrift run, the highest sensitivity (-36 to +32%) is found for cumulative sublimation and deposition when subjected to a +/-3% change in relative humidity. This can be explained by the high average relative humidity at Neumayer, which in summer is only 12% and in winter only 4% below saturation. A systematic change of 3% therefore represents a very large change in under-saturation, hence in cumulative sublimation and deposition. The sensitivity to changes in RH in the snowdrift run are also large, for similar reasons.
Melt is moderately sensitive (-9% to +16%) to changes in temperature, sublimation and wind speed. Figure 5b showed that, untypically, both SHF and LHF are negative during typical melt conditions, indicating convection and sublimation. Increasing the 2 m temperature and humidity will decrease the surface-to-air temperature and humidity gradients, weakening convection and sublimation, which weakens surface cooling and increases the energy available for melt. Increasing the wind speed has the opposite effect, i.e. enhancing the turbulent fluxes and the associated cooling, decreasing melt. No changes in the sensitivity occur when snowdrift is allowed, indicating that snowdrift and melt do not occur simultaneously.
It should be noted that applying a random error as if it were a systematic error, as we do here, yields an upper estimate of the uncertainty. The actual uncertainty is random and its effect on cumulative mass fluxes therefore smaller. This is supported by the fact that in all the sensitivity tests, the model performance in reproducing the observed surface temperature deteriorated.
Conclusions and future work
We show that a surface energy balance model, driven by high-quality hourly observations from the Antarctic coastal station Neumayer, is capable of accurately reproducing observed surface temperatures. For this relatively cold and windy coastal site, surface sublimation is significant only in summer, when absorbed solar radiation heats the surface. Including a first order estimate of snowdrift sublimation more than triples the total (surface plus snowdrift) sublimation, indicating that this is potentially an important process for the mass balance of Antarctic ice shelves.
Surface melt does occur every summer at Neumayer, but with large interannual variations. The in situ melt that is calculated with the surface energy balance model can be used to validate and improve the representation of surface processes in climate models, e.g. the all-important melt-albedo feedback. A comparison of satellite-detected liquid water days and calculated in situ liquid water in the snow at Neumayer shows a high degree of correlation.