INTRODUCTION
Worldwide, heightened environmental concerns associated with N losses from farmers’ fields (Sutton et al. Reference Sutton, Oenema, Erisman, Leip, Van Grinsven and Winiwarter2011), increasing food and energy demands (Spiertz Reference Spiertz2010; Richards et al. Reference Richards, Fenton, Lanigan, Wall, Lalor and Watson2012), and rising N fertilizer costs (Ott Reference Ott2012) have become motivating factors for finding cost-effective approaches to improve N use efficiency (NUE) within agricultural systems. Van der Hoek (Reference Van Der Hoek1998) estimated the NUE across agricultural systems worldwide to be approximately 37%; while for Ireland's grass-based dairy systems the most recent estimates are 27–37% (Ryan et al. Reference Ryan, Hennessy, Murphy, Boland and Shalloo2011).
Within the European Union (EU), N fertilizer use on farms is constrained by the EU Nitrates Directive (EC 1991) which imposes mandatory measures on farms aimed at improving water quality (EC 2000). Also under the Kyoto protocol, EU member states need to achieve a 20% reduction in greenhouse gas (GHG) emissions by 2020 (EC 2010). Agriculture is a contributor to GHG emissions mainly through the release of nitrous oxide (N2O), from farmers’ fields. Therefore agriculture is required to adopt new technologies to improve NUE on farms.
Grassland is an important land use in the EU, ranging from 0·12 in Denmark to 0·90 in Ireland, averaging 0·33 of the utilizable agricultural area across the EU (Stypinski Reference Stypinski2011). Grassland soils contain large N reserves stored in the soil organic matter (SOM) (Whitehead Reference Whitehead1995). Nitrogen mineralization of SOM is an important resource for agricultural productivity. The levels of N uptake in grass derived from soil N mineralization can vary considerably within and across different soil types (Herlihy Reference Herlihy1979). For example, without N application the cumulative annual N uptake by grass ranged from 74 to 212 kg N/ha/year across 15 Irish grassland sites (Humphreys Reference Humphreys2007) and from 40 to 150 kg N/ha/year across 16 UK grassland sites (Hopkins et al. Reference Hopkins, Gilbey, Dibb, Bowling and Murray1990). Murphy et al. (Reference Murphy, O'connell, Watson, Watson and Humphreys2013) reported that c. 0·49 of the annual N uptake obtained at two contrasting Irish grassland sites, receiving high rates of N fertilizer (300 kg/ha/year), came from mineralization of soil organic N. A recent laboratory study by McDonald et al. (Reference Mcdonald, Watson, Laughlin, Lalor, Hoekstra and Wall2011) using 35 Irish grassland soils found that levels of mineralizable N (MN) as determined by a 7-day anaerobic incubation test (AI-7) (Schomberg et al. Reference Schomberg, Wietholter, Griffin, Reeves, Cabrera, Fisher, Endale, Novak, Balkcom, Raper, Kitchen, Locke, Potter, Schwartz, Truman and Tyler2009) ranged from 92·17 to 403·21 mg NH4-N/kg, illustrating the wide range in soil N supply and the need for better tools to accurately predict soil N contributions to plant growth and N uptake. However, accurately predicting the quantities of N to be mineralized and taken up by the plant can be difficult as many soil, climatic and land management factors affect the N mineralization process (Griffin Reference Griffin, Schepers, Raun, Follett, Fox and Randall2008).
Biological tests, similar to AI-7, are seen as standard reliable measures of mineralizable N (Keeney Reference Keeney, Page, Baker, Ellis, Keeney, Miller and Rhoades1982), as they imitate the biological processes in the field, breaking down labile organic N fractions into nitrate (NO3 −) and ammonium (NH4 +), the primary plant available forms of N (Dahnke & Vasey Reference Dahnke, Vasey and Westerman1973). However, these tests are time-consuming and impractical for routine use, especially where a rapid turnaround time is required (e.g. soil sampling in spring for making early season N fertilizer decisions).
These fundamental requirements of a soil N test have contributed to the development of numerous chemical N tests in an effort to find suitable alternatives to the biological N tests (Griffin Reference Griffin, Schepers, Raun, Follett, Fox and Randall2008; Ros et al. Reference Ros, Temminghoff and Hoffland2011). Worldwide, the most prominent chemical index of N availability is testing for soil mineral N levels (Dahnke & Johnson Reference Dahnke, Johnson and Westerman1990; Roberts et al. Reference Roberts, Norman, Ross, Slaton and Wilson2012). However, under humid and high rainfall climates, these tests are of limited value as soil mineral N pools are too dynamic and transient for making even short-term predictions (Keeney Reference Keeney, Page, Baker, Ellis, Keeney, Miller and Rhoades1982).
More recently the focus has been on identifying and quantifying the more stable fraction of N in SOM that will be potentially mineralized for crop uptake (Wall et al. Reference Wall, Weisz, Crozier, Heiniger and White2010). Based on the fractionation of SOM components, Mulvaney et al. (Reference Mulvaney, Khan, Hoeft and Brown2001) identified the amino sugar-N fraction as a tool for identifying maize fields with high potential N mineralization levels that are non-responsive to N fertilizer. From this the Illinois soil nitrogen test (ISNT) was developed by Khan et al. (Reference Khan, Mulvaney and Hoeft2001). The effectiveness of the ISNT to predict MN towards crop uptake or optimum yields has been evaluated with various levels of success; some studies found ISNT-N to be ineffective for aiding better N recommendations (Barker et al. Reference Barker, Sawyer, Al-Kaisi and Lundvall2006; Laboski et al. Reference Laboski, Sawyer, Walters, Bundy, Hoeft, Randall and Andraski2008; Osterhaus et al. Reference Osterhaus, Bundy and Andraski2008; Spargo et al. Reference Spargo, Alley, Thomason and Nagle2009) while others have reported positive significant relationships (Mulvaney et al. Reference Mulvaney, Khan, Hoeft and Brown2001), particularly when drainage class (Williams et al. Reference Williams, Crozier, White, Heiniger, Sripada and Crouse2007), sampling depth associated with crop type (Roberts et al. Reference Roberts, Ross, Norman, Slaton and Wilson2011), planting population (Mulvaney et al. Reference Mulvaney, Khan and Ellsworth2006) and adjustment for inherent SOM (Klapwyk & Ketterings Reference Klapwyk and Ketterings2006; Lawrence et al. Reference Lawrence, Ketterings, Goler, Cherney, Cox and Czymmek2009) were considered.
The focus of studies using the ISNT to estimate soil N supply has been mainly on arable soils of North America. Following an evaluation of a range of chemical N tests to predict MN in Irish grassland soils, McDonald et al. (Reference Mcdonald, Watson, Laughlin, Lalor, Hoekstra and Wall2011) found the more practical and rapid ISNT to have a strong relationship with a standard biological AI-7 test across 35 Irish mineral soils (R 2=0·68, P<0·001). The current study illustrated the large variability in soil N supply across these grassland soil types and highlighted the ISNT as a rapid chemical test that is capable of predicting MN levels; however, it did not evaluate the performance of the ISNT as a tool for making N fertilizer recommendations for grassland. To date, evaluation of chemical indices to predict plant N availability in temperate grassland soils has been limited to only a few ryegrass (Lolium perenne L.) pot studies which showed varying levels of success (Jenkinson Reference Jenkinson1968; Whitehead Reference Whitehead1981; Warren & Whitehead Reference Warren and Whitehead1988). Studies that evaluate more recently developed chemical N indices such as ISNT for grassland are limited.
The objective of the present study was to evaluate the effectiveness of chemical N tests, in particular the ISNT and other soil properties such as the carbon (C) to N ratio, in predicting soil N supply for plant uptake through MN, grass N uptake and dry matter (DM) yield, for a range of Irish soil types under controlled environment conditions.
MATERIALS AND METHODS
Soil sampling and preparation
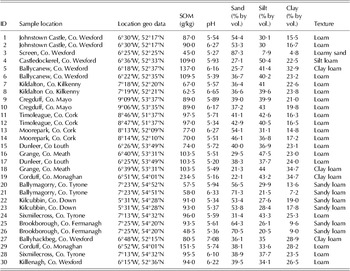
Thirty soil samples were collected in May and June of 2011 from farms within six dominant agricultural regions being monitored by the Agricultural Catchments Program (ACP), from Teagasc experimental research stations across the Republic of Ireland, and from the Agri-Food and Bioscience Institute (AFBI) monitor farms in Northern Ireland. These sites represented a range of mineral soil types, with varying soil textures and SOM levels typical for permanent grassland across the Island of Ireland (Table 1). At each site, 30 soil samples from the top 0·1 m of the soil were taken at random from an area of 0·405 ha. These samples were combined into one composite sample of c. 150 kg. Each composite sample was passed through a 12·7 mm sieve to remove root mass and large rock material. Following a thorough mixing, a subsample was taken of each soil type and analysed for gravimetric moisture content (Topp Reference Topp and Carter1993). An additional subsample was taken, oven dried at 40 °C for 3 days, sieved (2 mm mesh) and analysed for physical and biogeochemical properties (Table 1). The SOM content was determined using loss-on-ignition (LOI) at 500 °C for 16 h (Storer Reference Storer1984). The individual textural classes were applied to the soils using particle size analysis (Avery & Bascomb Reference Avery and Bascomb1974) and United States Department of Agriculture (USDA) classification of sand, silt and clay (Brady & Weil Reference Brady and Weil2002). Soil pH (v/v,1 : 2) in water was measured using a Mettler Toledo pH electrode (Mettler-Toledo, Zurich, Switzerland).
Description of physical and chemical properties of soil samples used in the controlled environment pot study

Potted soil experiment under controlled environmental conditions
Each of the 30 soil types were placed into plastic cylindrical pots 0·235 m in diameter and 0·28 m deep with the bottom 0·02 m initially filled with a coarse sand/gravel mix.
Four replicate pots were filled with each soil type and consolidated by tapping the pot several times during the filing process. The mass of each pot was recorded and the bulk density determined. Based on the moisture content determined when potting, the optimum threshold weight required for each pot to be maintained at 65% field capacity was calculated. The potted soils were left to stand outdoors for 14 days allowing time for initial NO3-N fluxes resulting from soil handling to stabilize. After this time, sufficient phosphorus (P) and potassium (K) were applied for grass growth, according to surface area calculations, equivalent to 248 kg P/ha as triple super phosphate and 775 kg K/ha as muriate of potash. The P and K was spread evenly across the soil surface and mixed into the top 0·1 m layer. The pots were then sown with a perennial ryegrass (L. perenne L.) mix of 0·60 Tyrella (late heading diploid) and 0·40 Aston energy (intermediate heading date), at a rate of 1 g per pot, the equivalent of 152 kg/ha or 15·2 g/m2 and watered regularly until the grass plants were established. The pots were then placed into a controlled environment facility in randomized blocks, where shelf position was the blocking factor. These pots were weighed and watered accordingly to maintain soil water at 65% field capacity. As the volume and weights of the pots were large, no adjustment in water additions were made for grass growth over a 5-week growth period (grass growth accounted for <0·05% of the overall soil weight in the pot). However, adjustments in water addition were made based on soil removal at the start of each growth period. Watering occurred six times a week during plant growth. Temperature was fixed at 15 °C (±2 °C), 80% relative humidity, and day length cycle of 16 h light and 8 h darkness. Once herbage was established on all pots, sulphur trioxide was applied based on surface area calculations (rate of 5·1 kg S/ha) to ensure no sulphur limitation to grass growth. Prior to starting the experiment an initial grass harvest was taken (to 0·02 m height) to remove the grass growth during establishment. Following this, three successive grass harvests were taken (cut to 0·02 m height) after each 5-week growth period (growth period one (GR1), growth period two (GR2) and growth period three (GR3)) from each pot. At the initial harvest and each successive harvest date, each pot was also soil sampled (c. 60 g of soil) to a 0·1 m depth.
Laboratory analysis
Grass herbage analysis
All harvested grass was oven-dried at 60 °C for 24 h, weighed to determine DM yield, ground using a Christy and Norris (12·7 cm) hammer mill and stored in dry air-tight containers prior to total N (TN) and total carbon (TC) analysis on a LECO Truspec CN analyser (LECO Corporation, Michigan, USA). A sub-set of grass samples were dried at 105 °C for 24 h to correct the results for differences in moisture content. Using the DM yield and N content, the N uptake at every harvest was calculated for each pot.
Soil mineral nitrogen
Approximately 30 g of the soil was subsampled, stored at <4 °C, and analysed within 24 h for mineral N (total oxidized N (TON=NO3-N+NO2-N) and NH4-N) using 5 : 1 (extract: soil) 2 m KCl extraction (Keeney & Nelson Reference Keeney, Nelson, Page, Baker, Ellis, Keeney, Miller and Rhoades1982; Mulvaney Reference Mulvaney1996) and measured colorimetrically by a Aquakem 600A (Aquakem 600A, 01621 Vantaa, Finland). Gravimetric moisture content was determined according to Topp (Reference Topp and Carter1993) using the remainder 10 g of soil.
The remaining soil (c. 40 g) was oven dried at 40 °C for 3 days, ground and sieved to <2 mm, and then stored in air-tight containers for later determination of mineralizable N.
A subsample (c. 3 g) of the dried soil samples were ball-milled (<150 μm) for total N and C analysis using a LECO Truspec CN analyser (LECO Corporation, Michigan, USA).
Illinois soil nitrogen test
The ISNT that estimates the amino sugar-N fraction in the soil and quantitatively measures NH4-N levels, was conducted on the soil samples based on the method developed by Khan et al. (Reference Khan, Mulvaney and Hoeft2001), and further modified by Klapwyk & Ketterings (Reference Klapwyk and Ketterings2005) and Spargo & Alley (Reference Spargo and Alley2008) Briefly, 1 g of dried and sieved (<2 mm) soil sample was weighed into a modified 473 ml (1 pint) wide-mouth Mason jar and treated with 10 ml of 2 m sodium hydroxide (NaOH). Five millilitres of 2% boric acid (H3BO3) solution was placed into a 60 mm Petri dish, which was suspended from the inside of the lid and the jar was sealed air-tight, then placed onto an enclosed hot plate at 50 °C for 5 h. Subsequently, ISNT-N liberated as ammonia (NH3) and collected in H3BO3 was measured colorimetrically using an Aquakem 600A analyser (Aquakem 600A, 01621 Vantaa, Finland).
Seven-day anaerobic incubation (AI-7)
Based on the method of Keeney & Bremner (Reference Keeney and Bremner1966) and Schomberg et al. (Reference Schomberg, Wietholter, Griffin, Reeves, Cabrera, Fisher, Endale, Novak, Balkcom, Raper, Kitchen, Locke, Potter, Schwartz, Truman and Tyler2009) 5 g of dried and sieved (<2 mm) soil was weighed into a 16×150 mm (external dimensions) screw-capped test tube, waterlogged by adding of 12·5 ml of deionized water, sealed air-tight and placed into an incubator at 40 °C for 7 days (AI-7). Following incubation soils were extracted with 25 ml of 2 m KCl and analysed for NO3-N+NO2-N and NH4-N levels using an Aquakem 600A analyser (Aquakem 600A, 01621 Vantaa, Finland). The same procedure was repeated without incubation to measure the soil mineral N levels at time zero (T0), these values were deducted from the value obtained after the 7-day incubation period to calculate net mineralization.
Statistical analysis
Using SAS JMP Version 9 (SAS, Cary, NJ, USA), summary statistics and one-way analysis of variance were performed on all soil and grass data collected. Soil N indices, TON and NH4-N were log transformed (log TON and log NH4-N, respectively) to allow for better fit within generated models. The mean values for each of the soil N indices (TON, NH4-N, ISNT-N, AI-7, TN and TC) were determined for the soil samples taken at the start of each of the three 5-week growth periods (GR1, GR2 and GR3). In addition, the mean values for grass DM yield and grass N uptake were determined for growth period one to three (GR1–GR3). Finally all the data from all three growth periods were combined for analysis (30 soils×three growth periods) giving a total of 90 soil sample-harvest data points (i.e. previous soil test points related to grass response variables after 5 weeks’ growth). A mixed multiple stepwise regression analysis of linear and quadratic terms using all the N indices and chemical and physical soil properties measured to predict grass DM yield and N uptake was carried out using SAS Version 9.3 (SAS Institute 2011). Initially these analysis procedures were performed separately for each of the three growth periods and then on the combined data set. The most suitable ‘best fit’ models were selected based on the lowest Akaike Information Criterion (AIC) and the knowledge that each index was measuring a different labile soil N fraction that can contribute to grass DM yield and N uptake. Repeated measures analysis was also performed across all the growth period prediction models, including the relationship between DM yield and N uptake and was analysed using an unstructured covariance model using the PROC MIXED procedure in SAS, Version 9.3 (SAS Institute 2011).
RESULTS
Soil characteristics and chemical properties
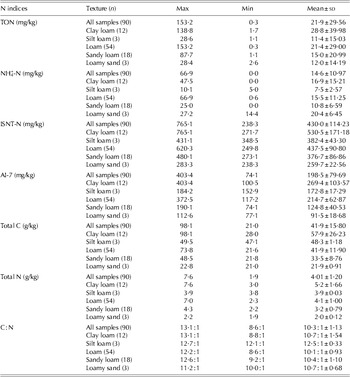
The 30 soils with varying physical and chemical properties included five textural classes, loam (n=18), sandy loam (n=6), clay loam (n=4), silt loam (n=1) and loamy sand (n=1) (Table 1). There was a large range in TON (nitrate+nitrite) levels across all soils and growth periods (Table 2). The highest levels and widest range of TON concentrations (10·8–153·2 mg/kg) across the 30 soil types were measured at the beginning of GR1. Three soils had very high initial TON concentrations (>100 mg/kg) when GR1 commenced, but by the start of growth GR2, on average, TON concentrations had decreased by 36·15 mg/kg and in general by the beginning of GR3 TON concentrations had decreased further. While TON concentrations varied across soil types and growth periods, on average TON concentrations were higher in clay loam soils and lowest in silt loams (Table 2).
Mean, maximum and minimum values for the chemical and biological soil nitrogen indices over the three growth periods
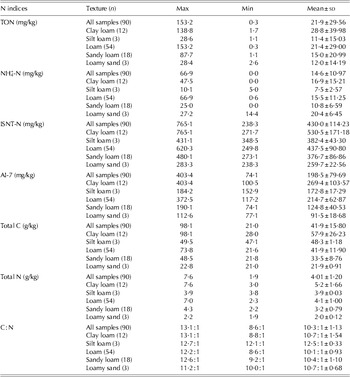
TON, total oxidized N (TON=NO3-N+NO2-N); ISNT-N, Illinois soil nitrogen test measuring amino sugar-N+NH4-N; AI-7, 7-day anaerobic incubation tests measuring NH4-N; C : N, ratio of total soil C divided by total soil N.
Ammonium (NH4-N) concentrations were lower than the TON concentrations across all soils. The concentrations of NH4-N fluctuated widely across the three growth periods with the highest mean values measured at the start of GR1 (Table 2). No definite trend in NH4-N concentrations was observed over the three growth periods. Soil texture (sand, silt and clay) did not explain variability in mineral N as measured by TON and NH4-N, across individual growth periods or when growth periods were combined (n=90 soils).
Mineralizable N as measured by AI-7 showed a large range over the 30 different soil types (74–403 mg/kg) and across all growth periods (Table 2). The general trend in MN concentrations in the majority of soil types was to decrease between the start of GR1 and GR2 and to increase between GR2 and GR3. Across all growth periods, on average, the concentrations of MN were highest in clay loam soils and lowest in loamy sands (Table 2). The percentage of sand, silt and clay significantly (P<0·01) explained 19, 14 and 19%, respectively, of the MN as across all growth periods combined (n=90 soils).
Similarly, MN as measured by ISNT-N varied widely between the 30 various soil types (Table 2). Within each soil type, across the three growth periods, the concentrations of ISNT-N remained relatively constant. The mean ISNT-N concentration (451 mg/kg) was highest at the start of GR1 and tended to decrease slightly, but not significantly over the following growth periods (−32 mg/kg between GR1 and GR2, and −0·39 mg/kg between GR2 and GR3). The ISNT-N concentrations ranged from 238 to 765 mg/kg over the three growth periods for these 30 soil types (n=90). Similar to the mineralizable N measured using AI-7, on average the highest concentrations of MN measured using the ISNT were in the clay loam soils and the lowest in the loamy sand soils across all growth periods (Table 2). The sand silt and clay content significantly (P<0·001) explained 31, 24 and 31%, respectively, of the variability in MN as measured by ISNT-N across these soils for all three growth periods combined.
The soil C-to-N ratio (C : N) remained relatively constant for each soil type throughout the pot experiment, however, the C : N across the 30 soil types ranged from 8·6 : 1 to 13·1 : 1 (Table 2).
Grass yield and nitrogen uptake
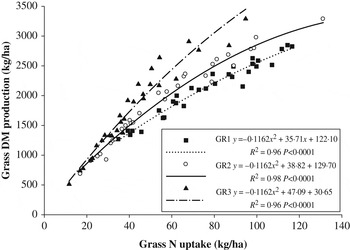
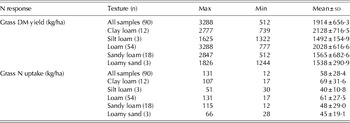
There was a large range in grass DM yield (511–3288 kg/ha) and grass N uptake (12–131 kg/ha) over the three growth periods and 30 soil types (Table 3). There was a positive quadratic relationship between grass DM yield and grass N uptake for each growth period GR1, GR2 and GR3 (R 2=0·96, 0·98 and 0·96; P<0·001, respectively; Fig. 1). In general across soils both grass DM yield and N uptake were highest after GR1 and then declined during GR2 and GR3. The grass DM yield and N uptake peaked on a loam soil at 3288 and 131 kg/ha, respectively. However, on average grass DM yields and N uptake were highest on clay loam soils (Table 3). Growth period had a significant influence on N uptake and DM yield and the interaction of N uptake×growth period was significant (P<0·05) for the relationship between DM yield and N uptake (Fig. 1).
Relationships between grass dry matter (DM) production and grass nitrogen (N) uptake for each of the three 5-week growth periods (GR 1–3). Fitted models account for the significant interaction of grass N uptake×growth period.

Mean, maximum and minimum values of the grass nitrogen response variables for 30 soil types over three growth periods
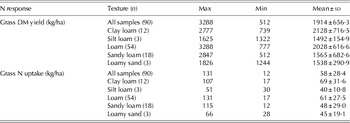
DM, dry matter.
Soil nitrogen indices for predicting grass dry matter yield and nitrogen uptake
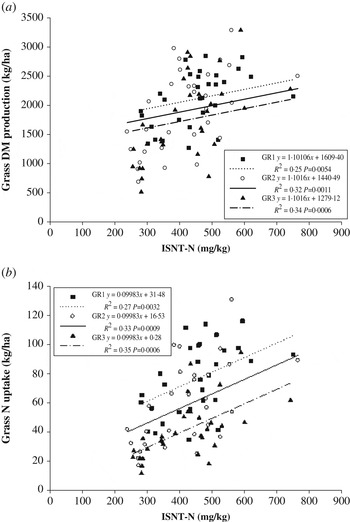
The ISNT-N was positively related (P<0·001) to grass DM yield and N uptake across each growth period. The interaction of ISNT-N×growth period was not significant; however, the main effects of ISNT-N and growth period were significant (P<0·05) (Figs 2(a) and (b)). This showed that from GR1 to GR3, mineralizable N (as measured by ISNT-N) accounted for between 25 and 35% of the variability in grass DM yield and between 27 and 35% of the variability in grass N uptake.
Relationship between Illinois soil nitrogen (N) test (ISNT-N) values and (a) grass dry matter (DM) production and (b) grass N uptake for each growth period (GR1, GR2 and GR3). Fitted models account for significant main effect of growth period.

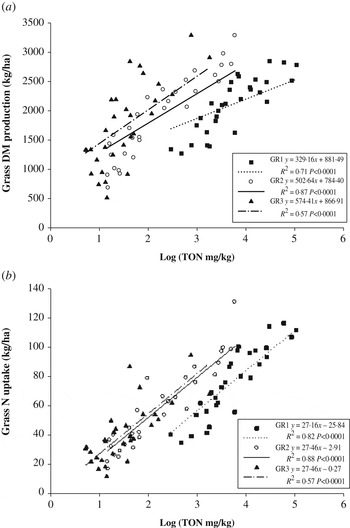
Of the soil mineral N pools log TON had the strongest relationship with grass DM yield (R 2=0·72, 0·87 and 0·57; P<0·001; Fig. 3(a)) and N uptake (R 2=0·82, 0·88 and 0·57 P<0·001; Fig. 3(b)) in each of the growth periods (GR1, GR2 and GR3, respectively) compared with log NH4-N (R 2=0·01, 0·45 and 0·53 for grass DM yield and R 2=0·02, 0·43 and 0·55 for grass N uptake). The interaction of log TON×growth period was significant (P<0·05) for grass DM yield but not for N uptake (Figs 3(a) and (b)). Although TON showed a strong relationship with grass DM yield and N uptake at each of the growth periods, on closer investigation there was large variability in both grass DM yield (512–2840 kg/ha) and N uptake (12–87 kg/ha) at low TON levels (<5 mg/kg equivalent to log TON <1·8 mg/kg) across these soils.
Relationship between log transformed total oxidized N (TON) and (a) grass dry matter (DM) production and (b) grass nitrogen (N) uptake for each growth period (GR1, GR2 and GR3). Fitted models account for the significant interaction of log TON×growth period.

The soil C : N by itself did not have a significant effect on grass DM yield or N uptake across all harvests. However, when C : N was included with ISNT-N in a combined model there was a significant (P<0·01) improvement in the predictions of grass DM yield (by 24 and 16% for GR1 and GR2, respectively) and N uptake (by 12 and 13% for GR1 and GR2, respectively). The inclusion of C : N in the prediction models with ISNT-N for GR3 improved the DM yield prediction by 7% although this was not statistically significant. The C : N ratio had a poor but significant (P<0·05) relationship with ISNT-N for GR1 (R 2=0·20) and across all growth periods combined (R 2=0·09, P<0·01).
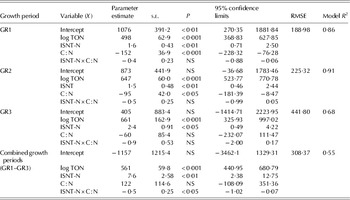
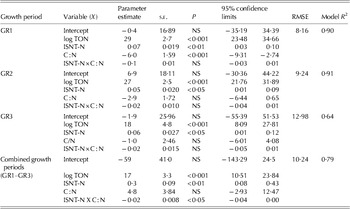
Based on multiple stepwise regression analysis and minimum AIC selection criteria, the combination of log TON, ISNT-N and C : N gave the best fit prediction models for both grass DM yield and N uptake in each of the three growth periods (Tables 4 and 5). Although not statistically significant the interaction of ISNT-N×C : N was included in the regression models for individual growth period as it was significant for the overall model (across all growth periods). Using the same statistical selection criteria, the combination of log TON, ISNT-N, C : N and ISNT-N×C : N interaction gave the best fit prediction models for both grass DM yield (Table 4) and N uptake (Table 5) across all growth periods combined (n=90).
Regression model of soil nitrogen indices for predicting grass dry matter production (kg/ha)

NS, not significant; RMSE, root mean square error.
Equation formula for each growth period is constructed as follows: Y=aX 1+bX 2+cX 3+d, where X is the measured N indices (variable), a, b, c, are parameter estimates and d is the intercept.
Equation formula for the combined growth periods is constructed as follows: Y=aX 1+bX 2+cX 3+dX 4+e, where X is the measured N indices (variable) or their interaction, a, b, c, d are parameter estimates and e is the intercept (intercept is for final harvest).
Regression model of soil N indices for predicting grass nitrogen uptake (kg/ha)

NS, not significant; RMSE, root mean square error.
Equation formula for each growth period is constructed as follows: Y=aX 1+bX 2+cX 3+d, where X is the measured nitrogen indices (variable), a, b, c, are parameter estimates and d is the intercept.
Equation formula for the combined growth periods is constructed as follows: Y=aX 1+bX 2+cX 3+dX 4+e, where X is the measured nitrogen indices (variable) or their interaction, a, b, c, d are parameter estimates and e is the intercept (intercept is for final harvest).
Across this dataset the inclusion of growth period (number) with log TON, ISNT-N, C : N and ISNT-N×C : N in the models for the combined growth periods (90 data points) did have a significant (P<0·001) influence on the overall prediction of grass DM yield and N uptake (R 2=0·78 and R 2=0·87, respectively). Growth period may relate to changing N dynamics in the soil over time relating to climatic or management factors. However, considering that growth period would be a parameter that may not be easily be quantified in a field situation it was omitted from the final prediction models. Using the unbiased slopes from the models that include growth period (number), the relationships shown are slightly weaker (R 2=0·55 for DM yield and R 2=0·79 for N uptake; Tables 4 and 5).
DISCUSSION
Variability of soil nitrogen pools between soil types
The large range of soil mineral N, in particular for TON, across these different grassland soil types, suggests the large differences among the soil types in the size and stability of their soil N pools, possibly reflecting past management history (years in grassland, manure and N fertilizer applications, stocking rate, etc.). Some of the variability in concentrations of soil mineral N, particularly at the first sampling at the start of GR1, can be attributed to an initial increase in N mineralization following soil preparation handling and grass seeding, similar to the effect generally observed after ploughing of grass swards (Whitehead Reference Whitehead1995). The levels of N mineralized can be dependent on the age of the sward and its previous fertilizer and management history (cut v. grazed) (Shepherd et al. Reference Shepherd, Stockdale, Powlson and Jarvis1996). Whitehead et al. (Reference Whitehead, Bristow and Lockyer1990) estimated mineralized N to range from 45 kg/ha on a 1-year cut sward receiving 50 kg/ha/year of chemical N fertilizer to 360 kg/ha on a 15-year-old grazed sward receiving N fertilizer of 300 kg/ha/year.
Concentrations of soil TON and MN (measured by both AI-7 and ISNT) were lowest in coarse-textured loamy sand, silt loam and sandy loam soils, and higher in the more fine-textured loam and clay loam soils. Gasser (Reference Gasser1961) also found that the concentrations of soil mineral N and MN (measured after 21-day incubation at 50% water holding capacity) increased, as the clay content of the 40 soils increased ranging from sand to clay loam soils. Although there was no relationship with soil mineral N, soil textural properties (sand, silt and clay) were associated with MN, in particular ISNT-N. Similar associations between soil texture and potential N mineralization were also highlighted in a study by Nyiraneza et al. (Reference Nyiraneza, Ziadi, Zebarth, Sharifi, Burton, Drury, Bittman and Grant2012), where there was a negative correlation with sand content and MN (r=−0·88, P<0·001, n=54) and a strong positive correlation with clay content and MN (r=0·77, P<0·001, n=54). In sandy soils, MN may be reduced due to low accumulation of SOM, as opposed to clay rich soils which may have higher MN because the clay-silt complexes protect and bind SOM (Jenkinson Reference Jenkinson and Wilson1988).
Similar to the weak but significant correlation between C : N and MN (ISNT-N) (r=0·20, P<0·01) across all the growth periods combined TN and TC levels also had weak but significant correlations with N mineralization. Other studies reported similar correlations between these parameters and related these to the geographical location of the soil types (Hassink Reference Hassink1994; Selles et al. Reference Selles, Campbell, Mcconkey, Brandt and Messer1999). In many studies, the SOM levels were used as an indication of potential N availability for plant uptake (Griffin Reference Griffin, Schepers, Raun, Follett, Fox and Randall2008) as, unlike TON, its levels remain relatively stable. However, rather than the size of the SOM pool, the levels of C and N in the SOM may offer a better indication of the mineralizable N of the soil. For microbes to function they generally consume on average one part of N to every eight parts of carbon (Brady & Weil Reference Brady and Weil2002). An increase of C : N ratio in a soil causes a deficit in N compared to C during the microbial breakdown of soil SOM leading to N immobilization. Therefore, the C : N of a material being decomposed influences the balance between the N mineralization and immobilization processes occurring in a soil, and in grassland the final balance usually results in net mineralization (Whitehead Reference Whitehead1995). Similar to the active fractions of N, the C : N of the 30 soils studied here was highest in a clay loam soil and lowest in a loamy sand. In an experiment investigating grass N response in English soils Gasser (Reference Gasser1961) reported similar ranges of C : N from 7·3 : 1 in calcareous clay loam to 13·7 : 1 in a clay loam.
Mineral nitrogen and mineralizable nitrogen as predictors of grass dry matter yield and nitrogen uptake
Grass DM yield and N uptake both had positive linear relationships with log TON concentrations at each growth period. The high levels of initial TON (log TON) (10·8–153 mg/kg of TON) in the soils prior to GR1 explained a high proportion of the variability in grass DM yield (0·71) and N uptake (0·82).
Although TON (log TON) concentrations at the start of GR2 reduced by an average of 75% across the 30 soils (2·21–42·6 mg/kg of TON), this mineral N pool continued to have the best relationships in N recovery by grass, explaining 0·87 of grass DM yield and 0·88 of grass N uptake. However, grass DM yields and N uptake varied considerably across these soils (682–3284 kg/ha for DM yield and 17–131 kg/ha for N uptake) at a given level of TON. The weaker relationship between TON (log TON) with DM yield and N uptake in GR3 can be explained by the reduced levels of TON (1·1–25·0 mg/kg) across the 30 soils at the start of this growth period, which do not adequately explain the large variability in grass growth after 5 weeks (grass DM yields ranged from 511 to 3288 kg/ha and N uptake from 12 to 94 kg/ha).
Compared to log TON, ISNT-N seemed to have poorer relationships with grass DM yield and N uptake at each growth period. Under the optimized growth conditions the grass plants would have preferentially consumed the readily available TON in the earlier growth periods (GR1 and GR2). As the concentrations of TON declined during GR2 and GR3, the strength of the relationships between ISNT-N and DM yield or N uptake increased simultaneously. During GR2 and in particular GR3, where residual TON concentrations were generally lower (the majority of soils had <5 mg/kg of TON, equivalent to <1·8 log TON), there was a wide range of grass DM yield and N uptake. During these growth periods the grass most likely assimilated a larger proportion of their N from the mineralized N pool compared to the preceding growth periods (GR1 and GR2, respectively).
Interactions between soil nitrogen indices for predicting grass dry matter yield and nitrogen uptake
Although ISNT-N was a good predictor of soil MN (R 2=0·50, P<0·001) across all harvests, both in the current study and in a previous laboratory study using similar soils (McDonald et al. Reference Mcdonald, Watson, Laughlin, Lalor, Hoekstra and Wall2011), ISNT cannot detect TON concentrations within the root zone, which will significantly contribute to plant N response (Klapwyk & Ketterings Reference Klapwyk and Ketterings2006; Wall et al. Reference Wall, Weisz, Crozier, Heiniger and White2010). Stanford & Legg (Reference Stanford and Legg1968) found that TON (mainly NO3-N) by itself, had a strong correlation with a crop N uptake (r=0·887) and when combined with N mineralized from organic matter in a multiple regression analysis the N response improved significantly (R 2=0·97, P<0·01). Based on these findings Stanford & Legg (Reference Stanford and Legg1968) concluded that NO3-N acts as an independent contributor of plant available N. Inclusion of mineral N and MN as independent pools of plant N supply are noted in many studies (Keeney Reference Keeney, Page, Baker, Ellis, Keeney, Miller and Rhoades1982; Stanford Reference Stanford and Stevenson1982).
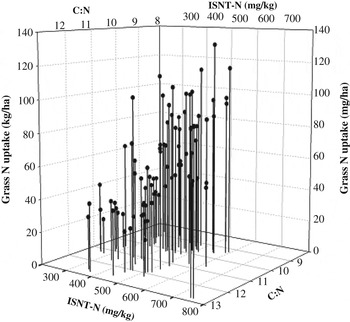
The ISNT and similar chemical N indices predicting MN extract higher concentrations of potentially available N compared to biological incubation methods such as AI-7. Similar rigorous extraction methods have been criticized for their lack of biological sensitivity towards the processes that control mineralization and immobilization of N in the soil (Jenkinson Reference Jenkinson1968). Klapwyk & Ketterings (Reference Klapwyk and Ketterings2006) found that combining SOM with ISNT-N improved the prediction model for yield responsiveness (P<0·01) in 33 soils from New York State with varying cropping and management histories. The Klapwyk & Ketterings (Reference Klapwyk and Ketterings2006) study highlighted the influence of SOM in regulating the availability of the MN pool estimated by ISNT. For the 30 Irish soils investigated in the current work, a similar interaction was found between C : N and ISNT-N across all growth periods, resulting in improved prediction models for grass DM yield and N uptake. As the C : N increases, the MN measured using the ISNT starts to become immobilized by microbes and thus less N is available for plant uptake, and vice versa (Fig. 4). In this case, the soil C : N seems to be acting as a biological regulator for microbial assimilation and supply of amino sugars (Mary et al. Reference Mary, Recous, Darwis and Robin1996; Ding et al. Reference Ding, Zhang, He and Xie2010), a relatively stable fraction of organic soil N (Khan et al. Reference Khan, Mulvaney and Hoeft2001).
Three-dimensional relationship between the Illinois soil nitrogen (N) test (ISNT-N) values, soil total carbon to total N ratio (C : N) values and response in grass N uptake across all growth periods combined (n=90 data points).

Combining three rapid soil N indices (ISNT-N, C : N and TON) into a model to represent the different soil N pools of available and potentially available soil N gave the best prediction of grass DM yield and N uptake for each growth period and for all growth periods combined (n=90). Other studies conducted under similar controlled conditions have also reported highly significant prediction models from combinations of similar N indices, including Serna & Pomares (Reference Serna and Pomares1992), who predicted N uptake in maize by combining MN after a 2-week incubation, initial soil mineral N, N extracted with sodium bicarbonate (NaHCO3) and estimated by ultraviolet absorbance at 230 or 260 nm and C : N ratio (R 2=0·82, P<0·001), and Warren & Whitehead (Reference Warren and Whitehead1988), who predicted grass N uptake across 27 English and Welsh soils by combining MN after incubation, soil mineral N and macro organic matter (R 2=0·92, P<0·001).
The findings from controlled studies, such as the current work, cannot be extrapolated to the field-scale without in-field evaluation. In a field environment, many N loss processes may be active, resulting in less N being available for plant uptake in the longer term. Soil mineral N (usually dominated by NO3-N) is transient under high rainfall conditions such as those in Ireland (Herlihy Reference Herlihy1979). However, the current study does provide a method to assess the potential of a grassland soil to supply mineralizable N, and regardless of the future N losses at field scale, it is still important to know the base N supply prior to making N management decisions which promote efficient and sustainable N use. Hence, the need for the current findings to be further validated across these soils under varying seasonal environments of field trials is emphasized.
In conclusion, temperate soils have a high capacity to supply N through N mineralization for grass N uptake and growth. For improvements in N guidelines for grassland, quantification of soil N supply is essential. The current study shows a combination of three chemical tests (ISNT, C : N, and TON) to be effective in predicting soil N supply and grass N recovery across 30 mineral soil types with a high level of confidence under controlled conditions. Accounting for this variability in soil N supply among different soil types could have the potential to help offset some of the high N fertilizer applications being applied to intensively managed grassland without compromising grass yields. Field studies are needed to further evaluate the soil testing tools under varying weather and soil conditions.
The authors acknowledge funding for the current study provided by the Irish Department of Agriculture Food and Marine under the Agricultural Catchments Programme (ACP). The authors would like to thank T. Sheil, G. Ridgway, J. Mellon, N. Meehan, A. Rothwell, T. Cowman, C. O'Connor, D. Brennan, M. Radford and C. Maddock for the technical support provided when conducting this work.