Introduction
Habitat destruction remains a key driver of biodiversity loss (Wilcove et al. Reference Wilcove, Rothstein, Dubow, Phillips and Losos1998, Maxwell et al. Reference Maxwell, Fuller, Brooks and Watson2016), and preventing biodiversity loss is a primary goal of conservation efforts (Johnson et al. Reference Johnson, Balmford, Brook, Buettel, Galetti, Guangchun and Wilmshurst2017). To protect biodiversity, conservation organizations often set aside land from development with the goal of keeping its natural habitat intact (Chape et al. Reference Chape, Spalding and Jenkins2008, Le Saout et al. Reference Le Saout, Hoffmann, Shi, Hughes, Bernard and Brooks2013), but they often face important funding shortfalls (McCarthy et al. Reference McCarthy, Donald, Scharlemann, Buchanan, Balmford and Green2012). As such, organizations active in land protection must prioritize their investments to maximize their progress towards protecting biodiversity (Moilanen et al. Reference Moilanen, Possingham and Wilson2009, Groves & Game Reference Groves and Game2016). This requires both protecting places rich in species and also ensuring that different parts of the protected area network cover locations that are important for complementary sets of species (Gaston et al. Reference Gaston, Charman, Jackson, Armsworth, Bonn and Briers2006). Community biogeography has long focused on understanding such patterns of species distribution, both in local richness and in community turnover (Koleff & Gaston Reference Koleff and Gaston2002, Mena & Vázquez-Domínguez Reference Mena and Vázquez-Domínguez2005, Qian & Ricklefs Reference Qian and Ricklefs2012). Here, we re-examine the potential for using ideas from community biogeography to help prioritize areas for protection.
Historically, total area of protected land has been cited as a metric of progress towards preserving biodiversity (Chape et al. Reference Chape, Harrison, Spalding and Lysenko2005). However, because of inconsistency in the quality of protected areas and in the type of habitat protected, total protected area coverage alone is not an adequate indicator of biodiversity preservation or of habitat protection (Nagendra Reference Nagendra2008, Joppa & Pfaff Reference Joppa and Pfaff2009, Nelson & Chomitz Reference Nelson and Chomitz2011). Simply maximizing protected area coverage favours protecting ‘cheap’ areas – land with few alternative competing uses. Indeed, historical protection biases have led to high-elevation, rugged environments with poor-quality soils being disproportionately represented among protected areas (Joppa & Pfaff Reference Joppa and Pfaff2009, Aycrigg et al. Reference Aycrigg, Davidson, Svancara, Gergely, McKerrow and Scott2013). So how should a conservation organization approach prioritizing sites for protection in order to conserve biodiversity? Very commonly, such organizations will not have the luxury of performing detailed on-site inventories of species before committing resources for each land acquisition they are pursuing. Instead, they must rely on models or other estimation methods to decide what species a site is likely to contain (Le Saout et al. Reference Le Saout, Hoffmann, Shi, Hughes, Bernard and Brooks2013).
One common current practice is first to model the distributions of each individual species within some taxon of interest (Early et al. Reference Early, Anderson and Thomas2008, de Pous et al. Reference de Pous, Beukema, Weterings, Dümmer and Geniez2011, Villero et al. Reference Villero, Pla, Camps, Ruiz-Olmo and Brotons2017). Typically, these are modelled independently (but see Pollock et al. Reference Pollock, Tingley, Morris, Golding, O’Hara and Parris2014, Rougier et al. Reference Rougier, Lassalle, Drouineau, Dumoulin, Faure and Deffuant2015). The individual species distributions are then usually combined to estimate biodiversity patterns, something we will refer to as a stacked distribution model approach. Stacked distribution models are used to prioritize locations for protection based on how well they sample the combined set of estimated distributions for species in the community. However, modelled species distributions are known to suffer from commission errors (reporting false occurrences). It can be very challenging to understand and account for how these errors accumulate and affect resulting prioritizations when combining distribution maps for many different species (Araujo & Guisan Reference Araujo and Guisan2006, Feeley & Silman, Reference Feeley and Silman2011 Franklin Reference Franklin2013). Dissatisfaction with these methods has led researchers to consider ways to prioritize land acquisition that do not require species data at all. Instead, priorities could be based on habitat types or ecosystem properties (e.g., soils, topography). The idea behind this is established in a body of literature that describes ‘conserving nature’s stage’ as a way to strategize conservation based on more easily observed physical properties of land (Anderson et al. Reference Anderson, Comer, Beier, Lawler, Schloss and Buttrick2015, Beier et al. Reference Beier, Sutcliffe, Hjort, Faith, Pressey and Albuquerque2015, Lawler et al. Reference Lawler, Ackerly, Albano, Anderson, Dobrowski and Gill2015). This framework emphasizes the protection of geodiversity, or different types of landscapes, to set aside land in a way that is robust to a changing environment. The ‘actors’ – the species supported on those landscapes – can then move around those landscapes as needed.
Here, we explore a third approach, one sourced in well-established ideas from community biogeography. Specifically, we explore the performance of prioritization methods that are based on trying to predict community-level properties (local richness and turnover). This is in contrast to an approach of first disaggregating to predict individual species distributions and then re-aggregating predictions to understand biodiversity patterns, or to one of ignoring species information altogether.
In summarizing community-level properties, we will refer throughout to the ecological principles of alpha, beta and gamma diversity, which are well-known to conservation practitioners. Alpha diversity refers to the value of biodiversity contained within a local area. Species richness within a protected area, for example, is a measure of alpha diversity (Gering & Crist Reference Gering and Crist2002). Beta diversity, in contrast, describes the turnover in diversity between discrete sites (Whittaker Reference Whittaker1960, Reference Whittaker1972, Legendre & De Cáceres Reference Legendre and De Cáceres2013, Socolar et al. Reference Socolar, Gilroy, Kunin and Edwards2016). For example, two sites containing many of the same species might each be high in alpha diversity, but their beta diversity value would be low because of the overlap in species between the sites. Measures such as the Jaccard index and Sorensen–Dice index are commonly used for quantifying beta diversity between sites, but many methods for calculating beta diversity exist in the literature. These methods are summarized in reviews by Ellison (Reference Ellison2010) and Tuomisto (Reference Tuomisto2010a, Reference Tuomisto2010b), and a comparison is made by Legendre and De Cáceres (Reference Legendre and De Cáceres2013). New methods continue to be proposed, such as those described in Baselga (Reference Baselga2010), Podani and Schmera (Reference Podani and Schmera2011) and Carvalho et al. (Reference Carvalho, Cardoso and Gomes2012). Given that so many different approaches exist, working with beta diversity can be confusing in practice. However, all beta diversity methods place a common emphasis on dissimilarity in species representation across multiple sites. Conservation planning approaches emphasizing representation (e.g., Chadés et al. Reference Chadés, Nicol, van Leeuwen, Walters, Firn and Reeson2015, Chauvenet et al. Reference Chauvenet, Kuempel, McGowan, Beger and Possingham2017) are in effect seeking to account for some measure of beta diversity, and so calculating some metric for it is therefore important (Jost Reference Jost2007).
Alpha and beta diversity are important to consider jointly for most conservation objectives, given that neither alpha nor beta diversity values alone guarantee adequate species coverage by protected areas. Gamma diversity is the number of species contained in a region and therefore considers both the biodiversity within individual sites (alpha diversity) and the turnover in biodiversity between them (beta diversity), which are independent from one another, to describe the total biodiversity across a landscape (Gering et al. Reference Gering, Crist and Veech2003, Jost Reference Jost2007, Tuomisto Reference Tuomisto2010a, Reference Tuomisto2010b). Gamma diversity is traditionally formulated as being the product of alpha and beta diversity (Whittaker Reference Whittaker1960, Reference Whittaker1972), although more recent approaches have considered an additive relationship (Lande Reference Lande1996, Veech et al. Reference Veech, Summerville, Crist and Gering2002). Regardless, we suggest that predicted values of alpha and beta diversity could be a useful approach for predicting total diversity among a set of sites (gamma diversity) to then prioritize areas for protection.
In this paper, we test this approach by applying it to data obtained from surveying tree diversity on a set of sites protected by The Nature Conservancy (TNC), a large non-profit land trust (Birchard Reference Birchard2005). The study sites in question were protected in part to conserve forested regions of the southern Appalachian Mountains. This region contains many tree species that are disproportionately under-protected and that will be important for future biodiversity conservation (Jenkins et al. Reference Jenkins, Van Houtan, Pimm and Sexton2015). It also contributes an elevational gradient and a north–south movement corridor that could act as a buffer for species responses to climate change (Lawler et al. Reference Lawler, Ruesch, Olden and McRae2013). We use the ecological properties of the sites to build two predictive models, evaluating both alpha and beta diversity. We then demonstrate how the predictions from the two models can be used jointly to estimate gamma diversity, or total biodiversity, across groups of sites. We show that these gamma diversity estimates can improve protected area selection under two different selection regimes, one focused only on representing species within protected areas and one that also considers the cost of securing that protection.
Methods
Data collection
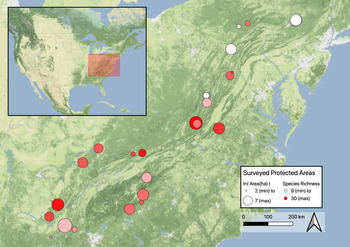
We surveyed tree species diversity on 27 TNC protected areas (hereafter ‘sites’) distributed across 10 states within the Central Appalachian Forest, Southern Blue Ridge, and Cumberland and Southern Ridge and Valley ecoregions of the eastern USA (Fig. 1). These ecoregions constitute part of the Appalachian Mountains of the eastern USA. This region is a conservation priority and is known for its diversity of tree species (Currie & Paquin Reference Currie and Paquin1987, Stein et al. Reference Stein, Kutner and Adams2000, Jenkins et al. Reference Jenkins, Van Houtan, Pimm and Sexton2015).
Sites that were surveyed for tree diversity. Area (ha) is scaled using the natural logarithm, and the relative scaled values are represented on the map by dot diameters, ranging on a continuous scale from small to large. Surveyed species richness at each site is represented by the colour of each dot, ranging on a continuous scale from light to dark.

We used a spatial random point generator (ArcMap version 10.1, ESRI, Redlands, CA, USA) to identify 20 survey points prior to visiting each protected area – 10 of which were near (within 100 m of) the protected area edge and 10 of which were in the core. We visited each sampling site between May and September of 2013. At each point, location data were recorded using handheld GPS (Garmin E-Trex 20). We then identified the 10 trees nearest to each point to the species level (5400 trees in total). Resampled and averaged accumulation curves from each site are provided in Supplementary Fig. S1 (available online) to show that our sampling procedure adequately characterized the relative contributions of each site to tree diversity in the study. We considered trees that had a diameter at breast height (dbh) greater than 10 cm, but counted any dbh scrub oak (Quercus ilicifolia) as a tree because it is the dominant tree species in the scrub oak–heath community that is a conservation priority at some of our protected areas (The Nature Conservancy 1997), and it rarely exceeds 10 cm dbh. All species nomenclatures follow Kirkman et al. (Reference Kirkman, Brown and Leopold2007), except species only found north of Maryland, which follow Elias (Reference Elias1980). All Crataegus and Amelanchier were identified to the genus level only.
The tree sampling data were paired with GPS location data for each point. Elevation data for each sampled location were obtained from the NASA Shuttle Radar Topography Mission (Rodriguez et al. Reference Rodriguez, Morris and Belz2006). For our analysis, all data were aggregated at the level of the protected area using the mean values of the 20 points in the protected area to determine the protected area mean elevation and mean latitude. The distance between the highest and lowest sampling points was used to calculate the elevation range within each protected area.
Across sites, mean site elevation ranged from 130 to 1700 m; latitude ranged from 34° to 41.5°; within-site elevation change varied from 30 to 400 m; and parcel area ranged from 10 ha to nearly 900 ha (Table 1).
Summary of site characteristics. For each variable, we report the mean with SD in parentheses. Alpha diversity is shown in units of species and beta diversity is represented by the averaged pairwise Sorensen–Dice dissimilarity indices. Costs are adjusted to year 2000 US$ and represent the acquisition cost for each site.

Data on protected area parcel sizes and costs were provided by TNC (Table 1). The protected areas were acquired by TNC at different times between 2000 and 2009. As such, we needed to correct the cost information for inflation. Therefore, we converted this cost information to 2000 US$ equivalents using a state-level housing price index.
Models of alpha, beta and gamma diversity
To model alpha diversity, we fit a generalized linear model to test the predictive capacities of site latitude, mean site elevation, within-site elevation range and site area for estimating within-site richness. We limited our analysis to these variables to avoid over-parameterizing our model given our limited sample size (Zuur et al. Reference Zuur, Ieno and Smith2007). Because we present alpha diversity as counts of site species richness, we assumed the dependent variable to be Poisson-distributed. We tested predictor variables for collinearity and found them to be sufficiently independent from one another to proceed. We added a quadratic term for site latitude because an examination of residuals when only linear terms were included strongly suggested a non-linear effect of latitude. Introduction of this quadratic term resulted in large reductions in Akaike information criterion (AIC) values for the alpha diversity model and in a higher pseudo-R2 value, indicating that the model was explaining more variance. We did not consider other interaction effects, having no a priori reason to expect any particularly strong interaction effects from among the many that are possible.
To model beta diversity, we performed a multiple regression on matrices of pairwise distances between sites’ ecological variables (MRM; see Lichstein Reference Lichstein2007). MRM, an extension of the Mantel test (Mantel Reference Mantel1967) to a regression framework, is a flexible multivariate method for examining relationships between a series of predictive matrices and a response matrix. A MRM can be constructed to accommodate linear as well as more complex relationships (Lichstein Reference Lichstein2007). In our analysis, the response variable matrix consisted of a Sorensen–Dice dissimilarity index, which is one of the most common ways to represent beta diversity among pairs of sites (Chao et al. Reference Chao, Chazdon, Colwell and Shen2006, Anderson et al. Reference Anderson, Crist, Chase, Vellend, Inouye and Freestone2011, Legendre & De Cáceres Reference Legendre and De Cáceres2013). We chose this particular metric because it is well-known, easy to calculate and therefore very interpretable, particularly within our prioritization that emphasizes species representation. The Sorensen–Dice dissimilarity index describes turnover in species richness between sites and is calculated as follows for each cell in the distance matrix, where sets X and Y are composed of species observed in each of two sites:
 $$Dissimilarity = 1 - {{2\left| {X \cap Y} \right|} \over {\left| X \right|\; + \;\left| Y \right|}}$$
Each cell in the response variable matrix therefore represents the magnitude of turnover among species present between two sites. The independent variables chosen were the same as in the alpha diversity model, although now structured as pairwise distance matrices: site latitude, site elevation, site area and within-site elevation range. In these matrices, each cell represents the difference in values for the variable in question between two sites. Model predictors were again examined for collinearity. Pairwise distances between site areas were natural-log-transformed, and distances in terms of latitude squared were not included in this regression because the distribution of the residuals did not warrant including the extra term.
We used our models of alpha and beta diversity to explore how estimated gamma diversity could be used to inform selection of protected areas. The following heuristic equation for estimating gamma diversity between two sites incorporates alpha and beta diversity into the site selection process:
 $${\gamma _{ab}} = \left( {{\alpha _a} + {\alpha _b}} \right) \times {\beta _{ab}}$$
Here,
 $${\alpha _a}$$
and
 $${\alpha _b}$$
refer to individual site richness values and
 $${\beta _{ab}}$$
refers to the Sorensen–Dice dissimilarity index for the two sites. We chose this gamma diversity metric again because of its simple transparency and because it adequately captures common understanding about the relationships between alpha, beta and gamma diversity. This choice of index makes clear that as the alpha diversity indices of the two sites increase, or as the dissimilarity between the sites increases, the gamma diversity index between the two sites will also increase (see Veech et al. Reference Veech, Summerville, Crist and Gering2002 for a discussion of alternative ways to combine alpha and beta diversity into measures of gamma diversity).
We constructed a matrix of pairwise gamma diversity estimates using predicted values for each site from the alpha and beta models. The average of all pairwise gamma diversity indices including a specific site was used as a proxy for the site’s overall contribution to gamma diversity.
Protected area selection strategies
After building models predicting alpha, beta and gamma diversity, we examined how these models could be used to select sites for protection. In reality, all 27 sites included in our data collection were actually protected. For our analysis, we focused on hypothetical scenarios of what would have happened had TNC not had sufficient funding to protect all 27 sites. If the organization were more limited in funding, which of these sites should be the very top priorities? We also set a goal of ensuring as many species as possible received at least some protection within a selected protected area network. Other protection goals, such as ensuring a particular number of occurrences of each species within selected protected area networks, are also possible (Willis et al. Reference Willis, Lombard, Cowling, Heydenrych and Burgers1996, Rodrigues et al. Reference Rodrigues, Orestes Cerdeira and Gaston2000).
We benchmarked the relative performance of different strategies for selecting protected areas against the best possible choice and a random selection strategy. To calculate the maximum possible coverage of species by a protected area network of a given number of sites, we iterated through all possible choice combinations (exhaustive search). The maximal possible coverage of species by a reserve network of a given size was found by counting the number of species present on at least one protected site for every combination of selected sites. We also calculated the expected species coverage if choosing protected areas at random from within the set of 27 sites. One hundred randomly selected sets of sites were drawn for each budget level and the average number of species included in the set of protected sites was calculated.
Next, we used our models of alpha, beta and gamma diversity to guide the selection of sites to protect. The alpha diversity model was used to predict which site would have the highest alpha diversity based on predictor variables, and new sites were added in order of decreasing alpha diversity. For beta diversity, sites were selected in order of decreasing mean value across the predicted matrix of pairwise Sorensen–Dice values, so that sites that were predicted to be most different from the other sites were generally selected first. To account for variance in model predictions, this process was repeated for 100 random samples through the variance of predictions for each of the two models. As detailed above, we combined our alpha and beta diversity models to estimate a site’s overall contribution to gamma diversity. To test how this could be used to inform decisions about which sites to protect, we selected sites in order of decreasing mean predicted gamma diversity value across all of each site’s pairwise gamma diversity estimates, so that priority was given to sites that were predicted to have high richness and also not to overlap much with other sites. This was repeated for 100 random samples through the mean squared error of predictions by the alpha and beta diversity models.
In addition to considering the performance of different approaches given specific numbers of sites selected in a protected area network, we also considered the ability of our models to perform well when considering the cost of the protected areas. To include cost information, we considered the one-time acquisition costs of different sites and considered a range of budget intervals (23 values spread logarithmically from US$18 000 to US$20 000 000) to select sites for the protected area network. For our analyses of the role of costs, we focused on the gamma diversity strategy, as it was the best performing of those based on the diversity models when considering only biodiversity data.
Results
Tree diversity survey results
Our field sampling effort identified a total of 94 species across the 5400 individual trees on 27 sites. The mean sampled species richness (alpha diversity) of these sites was 19.2 tree species, with a minimum of 9 tree species and a maximum of 30 tree species (Table 1). The average Sorensen–Dice dissimilarity (beta diversity) across the 27 sites was 0.58, reflecting substantial turnover among sites (Table 1). Between individual sites, the turnover was highly variable; for instance, the highest turnover was between a site sampled in Alabama and a site sampled in North Carolina. Of the 39 species observed across the two sites, only 1 was recorded at both sites (Sorensen–Dice dissimilarity = 0.95). In contrast, the lowest turnover was observed between a site sampled in Tennessee and one in Virginia, where for the 30 species observed across both sites, 22 were shared (Sorensen–Dice dissimilarity = 0.15).
A few tree species were very frequent across all sites, but infrequent species contributed to our sampled diversity, with 30 of the 94 observed tree species recorded just five times or fewer. The most commonly observed species was Acer rubrum, accounting for about a tenth (531) of all observations; however, it was the most common tree at only one site, in Tennessee. Across sites, dominant species included those in the genera Pinus, Liriodendron, Prunus, Betula, Nyssa, Robinia, Picea, Fraxinus, Celtis or Tsuga, mirroring an expectation of highly heterogeneous community composition and high diversity across Appalachia.
Diversity models
Model coefficients for the two latitude terms indicate that alpha diversity increases with latitude at the lowest latitudes, but decreases with latitude at higher latitudes (Table 2). Additionally, site elevation has a negative relationship with site alpha diversities. Altogether, the alpha diversity model explained some of the variation in tree richness values of sites (R2 = 0.33). Perhaps surprisingly, neither site area nor within-site elevation range contributed significant predictive capacity to the models.
Alpha diversity regression results.

The beta diversity model used pairwise differences in latitude, elevation, within-site elevation ranges and ln(area) values to predict pairwise Sorensen–Dice dissimilarity values (Table 3). Pairwise distances between site latitude values and site elevation values were significant (p < 0.001) predictors of Sorensen–Dice dissimilarity indices. The positive coefficient for distance between latitudes implies that differences in latitude contribute to high values for species turnover, as does the positive coefficient for distance between site elevations. The McFadden R2 value of 0.25 indicates that a moderate amount of the variance in beta diversity is explained by just the few predictors included in the model. As in the alpha diversity model, pairwise distances between site areas and within-site elevation ranges were not significant predictors of species turnover between sites.
Beta diversity regression results.

AIC = Akaike information criterion.
Protected area selection strategies
We compared the number of species covered by different protected area strategies when limited by the number of sites that can be protected (Fig. 2). The filled circles in Fig. 2 are the maximum coverage solutions and represent the ‘best possible’ answer, namely the combination of sites that would be selected to maximize species richness if we had perfect knowledge of species presence. The distance between these solutions and the results from the other methods is a consequence of ‘hiding’ the species presence data and instead making predictions based on site characteristics alone (e.g., latitude, elevation, etc.) from our alpha, beta and gamma diversity models. Of these methods, our gamma diversity estimation method performed best. Selection by predicted alpha diversity alone performed well at low thresholds, but lost its advantage at selection sizes of 15 sites or greater. Selection by predicted beta diversity performed significantly worse than random selection at low selection sizes.
Site selection efficacy by number of sites. Filled circles: maximum coverage solutions. Triangles: average coverage by site selection using pairwise gamma diversity estimates from alpha/beta model predicted values. Empty circles: random site selection. Empty squares: site selection by predicted alpha diversity alone. Crossed squares: site selection by predicted beta diversity alone.

We then also integrated information on the cost of protecting sites and repeated site prioritizations for a range of budget thresholds. We first used known information about species richness at each site to sample sites under each price threshold and to produce a ‘near maximum richness’ set of site selections. Because we could not exhaustively sample all possibilities at each threshold, each value might be slightly underestimated. We then used the predicted number of species at each site (using only the gamma diversity prediction model) to make site selections under each threshold, and we compared these results to that of random selection. Gamma diversity-estimated site selection performed much better than random site selection at each price threshold (Fig. 3).
Site selection efficacy with price thresholds. Filled circles: maximum richness possible at each price interval. Black triangles: average number of species included at each interval if selecting sites by gamma approximation. Empty circles: average number of species included at each interval by random selection.

With both prioritization scenarios (limited by site number or limited by cost), the gamma diversity selection method performed better than random selection. The gamma diversity model worked particularly well in comparison to random site selection when price thresholds were considered, covering over 98% of the area under the maximum solution curve while random selection only covered c. 90% of the area under the curve.
Discussion
We aimed to determine whether abiotic factors such as latitude and elevation would help prioritize the purchasing of a protected area network that maximizes tree species coverage. We surveyed 27 sites recently acquired by TNC in the southern Appalachian Mountains for tree diversity, and we paired these data with data on the physical characteristics of the protected areas. We then revisited the community biogeography principles of alpha, beta and gamma diversity to separately model local patterns of species richness and regional patterns of species turnover among the tree diversity data. We modelled alpha and beta diversity separately. We then combined predictions from alpha and beta diversity models into an estimate of gamma diversity. Our gamma diversity estimate performed well under two scenarios for prioritizing protected area selections: one scenario in which we were limited by the number of protected areas in the network and one in which we were limited by total cost.
Our results use classic ideas about diversity partitioning to make predictions about species coverage (Gering & Crist Reference Gering and Crist2002, Jost Reference Jost2007, Socolar et al. Reference Socolar, Gilroy, Kunin and Edwards2016). The simplicity of the models demonstrates the predictive power of just a handful of variables. We found that variables such as latitude and elevation of the protected areas influenced both the alpha diversity of individual sites and the beta diversity between pairs of sites. Incorporating predictions of the separate models for alpha and beta diversity for protected area prioritization allowed us to optimize our choices to include sites with high local species richness while also favouring sites that were likely to include species different from those already in the network. Including additional predictors could further increase the explanatory power of the analysis (e.g., see Albuquerque & Beier Reference Albuquerque and Beier2015). However, fitting models that include more variables would require survey data from more sites.
Including cost thresholds improved the performance of our method relative to the selection scenario that was limited by number of sites. This suggests a disconnect between the cost of individual parcels and their contribution to species coverage in a protected area network, which our site selection procedure leveraged to accumulate many species compared to random selection as price thresholds increased. Costs are one of many socioeconomic factors that could be considered, and our method would likely improve further under other socioeconomic constraints (e.g., threats or proximity to urban areas; Armsworth et al. Reference Armsworth, Jackson, Cho, Clark, Fargione and Iacona2017). Additionally, further analyses might benefit from also considering management costs, since previous work has found that management costs did not correlate with acquisition costs (Armsworth et al. Reference Armsworth, Cantú-Salazar, Parnell, Davies and Stoneman2011).
A conventional approach to predicting species diversity might be to make predictions about occupancy from stacked species distribution models (SDMs) (Villero et al. Reference Villero, Pla, Camps, Ruiz-Olmo and Brotons2017). However, conservation planners anticipating that species diversity data may not be available, or may change in the future, have sought to use abiotic characteristics to guide site prioritizations (Anderson et al. Reference Anderson, Comer, Beier, Lawler, Schloss and Buttrick2015, Beier et al. Reference Beier, Sutcliffe, Hjort, Faith, Pressey and Albuquerque2015). We show here that very simple abiotic site characteristics can meaningfully inform site selection in comparison to empirical data on species coverage. Moreover, the predictions made by the models presented here are specifically informed by data at the site level, and they might not be as susceptible to problems at fine scales as SDM-based methods (Hernandez et al. Reference Hernandez, Graham, Master and Albert2006, Lobo et al. Reference Lobo, Jiménez-Valverde and Hortal2010).
We made a number of choices with our research design. First, we examined a particular conservation context. Our data were obtained from a sample of sites protected by a single conservation organization, albeit one that operated a similar land protection mission to many other land trusts and regional public agencies during the time these sites were protected. Even when working with one organization, many factors contribute to determining just which particular properties end up being protected. Acquisitions of the particular set of protected areas we consider were guided by a collaborative ecoregional planning process, but were constrained by what land was available for purchase and what funding was available (Groves Reference Groves2003, McDonald-Madden et al. Reference McDonald-Madden, Bode, Game, Grantham and Possingham2008, Lennox et al. Reference Lennox, Fargione, Spector, Williams and Armsworth2017). The outcome of this process is encapsulated in TNC’s ecoregional plans for the study area (e.g., The Nature Conservancy 2000) covering the period of these acquisitions. In identifying our sample of sites for this work, we also examined internal TNC documents detailing why each individual parcel was acquired and we consulted with individual TNC staff involved in the relevant land deals. All of the parcels in question were acquired at least partly to protect forested ecosystems, and the diversity of these forest ecosystems was commonly highlighted. A related point was that the data came from sites that were actually protected. As such, our analysis is most relevant when considering sites that are candidates for selection and, again, differences in diversity patterns may have resulted if we included sites at random from across the landscape.
Next, we focused on a conservation goal of species coverage. Conservation organizations, including TNC, pursue a multiplicity of objectives when protecting land, of which protecting biodiversity is often one. When considering how well protected area networks perform in terms of biodiversity, species coverage – our focus here – is one particularly relevant criteria (Church et al. Reference Church, Stoms and Davis1996, Veach et al. Reference Veach, Di Minin, Pouzols and Moilanen2017). However, we recognize that there are others that also warrant consideration. For example, if prioritizing rare species, the models presented here could also be adapted to maximize metrics weighted for representation of species of higher conservation priority (Arponen et al. Reference Arponen, Heikkinen, Thomas and Moilanen2005, Veach et al. Reference Veach, Di Minin, Pouzols and Moilanen2017). Alternatively, one might assign greater weight to ensuring persistence of species covered somewhere within the protected area network (e.g., by valuing repeat occurrences of the species at different protected sites). Other design choices we made should also be considered to contextualize our results, including limiting our sampled sites to the southern Appalachian Mountains (a region known for high levels of tree diversity and that spans a substantial range of elevations) and sampling from randomly selected points within protected areas. Lastly, our approach here was limited specifically to considering diversity of tree species and might not be as effective for other species groups, such as those that are very mobile or are especially sensitive. Other metrics for site prioritization that do not require extensive on-the-ground surveying have been shown to be effective for other groups of species, such as predicted importance, predicted rarity-weighted richness and metrics related to environmental diversity and velocity (Albuquerque & Beier Reference Albuquerque and Beier2015, Reference Albuquerque and Beier2016, Carroll et al. Reference Carroll, Roberts, Michalak, Lawler, Nielsen and Stralberg2017).
Biodiversity partitioning using alpha, beta and gamma diversity is rooted in fundamental concepts about patterns in species distributions. Here, we have revisited biodiversity partitioning as a tool for conservation planning and have demonstrated its continued relevance for explaining patterns in diversity and for guiding conservation decision-making.
Supplementary material
To view supplementary material for this article, please visit https://doi.org/10.1017/S0376892921000060
Acknowledgements
We thank The Nature Conservancy for providing relevant data and colleagues at University of Tennessee for useful discussions.
Financial support
This material is based on work partially supported by the National Science Foundation (grant number 121141).
Conflict of interest
None.
Ethical standards
None.