


Introduction
The Lambert Glacier drainage basin, with a total area of more than 1.5 X 10⁶ km2, is one of the major ice-drainage basins of the East Antarctic ice sheet. Snow accumulation in the interior of the basin drains via Lambert Glacier and its tributary ice streams to the embayed Amery Ice Shelf, and I hence to the coast. The ice shelf and ice streams occupy a large depression in the East Antarctic bedrock topography which is also reflected in the ice-sheet surface: the 2000 m surface elevation in parts of the Lambert basin lies up to 600 km further south of the edge of the ice sheet than in other regions around the perimeter of East Antarctica. This topography has a significant effect on the climate of the region, and in particular on the surface wind regime and the accumulation distribution; and hence also on the surface mass budget. Yet until recently, except at the occupied coastal stations of Mawson, Davis, and Zhong Shan in the Larscmann Hills, there were no regular climatic data for the region.
The Lambert Glacier basin has long been a focus of Australian glaciological studies. Between the 1989-90 and 1994-95 austral summers these included a series of over-snow traverses around the interior of the basin, approximately paralleling the 2500 m surface contour. These traverses investigated the ice-sheet characteristics, dynamics and mass budget, and the programme and some of the results from these studies are described by Reference Goodwin, Higham, Allison and JiawenGoodwin and others (1994), Reference Higham and CravenHigham and others (1995, Reference Higham, Craven, Ruddell and Allison1997) and Higham and Craven (1997). Five automatic weather stations (AWSs) were installed during these traverses, and the data from those, together with data from a sixth station at a longer-occupied near-coastal site, are used in this paper to describe the surface climatology of the interior of the basin.
AWSs and Lambert Basin Network
Since the mid-1980s AWSs have increasingly provided surface meteorological data, usually transmitted in near real time via satellite-data relay, from remote areas of Antarctica. Seventeen AWSs were operating on the East Antarctic ice sheet between 30° and 150°E longitude, and above 1000 m elevation, in January 1996 (Reference TurnerTurner and others, 1996). Many of those were operated as part of a large U. S. network (e.g. Reference Stearns, Keller, Weidner, Sievers, Bromwich and SlearnsStearns and others, 1993), but others were contributed by Australian (Allison and others, 1993) and Japanese (Enomoto and others, 1996) programmes. Stearns and others (1993) showed that Antarctic AWS data, particularly pressure and air-temperature, are good enough for climatic purposes, and in many cases the AWSs are more reliable and at more representative sites than occupied stations.
The AWSs used in this study were designed and built by the Australian Antarctic Division. They are an updated version of the stations described by Allison and Morrissy (1983). They measure air temperature at a nominal height above surface of 1,2 and 4 m (sensor precision 0.02°C), wind speed at 1, 2 and 4 m (0.2 m s−1), wind direction at 4 m (5°), atmospheric pressure (0.15 h Pa), global radiation, and firn temperatures at nominal depths of 0.1, 1, 3 and 10 m. All data from the stations are relayed via the Argos system on U.S. National Oceanic and Atmospheric Administration satellites. Data from these high-latitude AWSs are received almost every hour, except around local solar noon when, because of the satellite-orbit geometry, hourly observations are obtained on only 30 50% of days.
Typically the Australian AWSs are rarely revisited for maintenance after deployment. The nominal sensor heights change with snow accumulation, and sensors eventually become buried, but this can take decades at low-accumulation sites. Anemometer bearings may seize at low temperatures (typically below 60°C), but free up again in warmer months. Air-temperature sensors have only naturally ventilated radiation shields, but at most sites average wind speeds exceed 7ms−1. The accuracy and reliability of the stations is confirmed by temperature and wind profiles measured by the stations. One similar AWS in Wilkes Land (GF08; 68.5°S, 102.2° E; 2123 m), in an area of near-zero surface net balance, was still recording approximately logarithmic wind and temperature profiles after 10 years unattended operation. At some locations in the Lambert basin, AWSs have been replaced, and at LGB00 and LGB10 the old and new stations were left operating together for periods of 18 and 6 months, respectively. Average temperature differences between the two AWSs at each site were <0.2°C, and pressure differences <0.1hPa (std dev. = 0.2hPa).
Site information for the Lambert Glacier basin AWSs. Surface elevation at the AWS sites has been determined from precise differential GPS survey, and corrected for geoid-ellipsoid separation to give an elevation above sea level
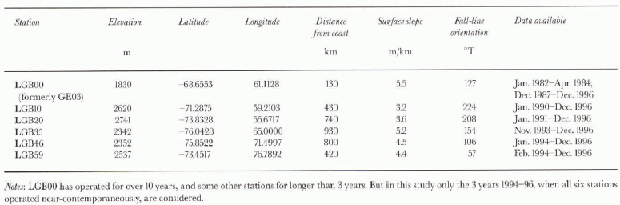
The locations of the Lambert basin AWSs used in this study are shown in Figure 1, and site information is given in Table 1. All stations are on the ice sheet, at surface elevations of 1830-2741 m. Station LGB00 (previously named GE03; Allison and others, 1993) is on the coastal ice-sheet slope just outside the Lambert drainage basin, while all other AWSs are on relatively steep slopes draining into the main Lambert system. Station LGB35 is in a trough associated with the Mellor Glacier Ice Stream, on the western side of the Lambert graben (Higham and others, 1995).
The Lambert Glacier basin, showing location of AWSs LGB00, LGB10, LGB20, LGB35, LGB46 and LGB59 (open circles) and traverse routes. The annual average wind vector at each A WS site is shown by an arrow.

Annual mean climatic data for Lambert basin AWS sites, 1994-96
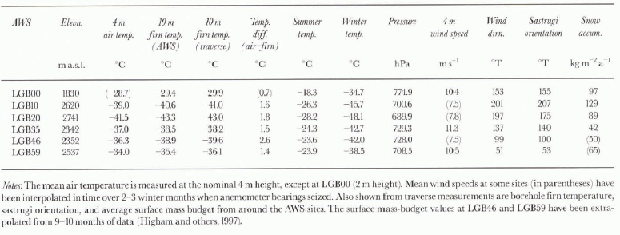
by the AWSs have been calculated from all available data (approximately every 50 min) for the period 1 January 1994 to 31 December 1996. Monthly and annual means for each AWS have been derived from these, and the annual mean surface climate at the six sites is summarised in Table 2.
All sites have a high average wind speed with a strong downslope component, indicative of katabatic flow. The strongest average winds occur at LGB00 on the sleep near-coastal slopes; at LGB59 on the eastern side of the basin where average surface slopes are up to 50% greater than on the western side; and at LGB35 where winds are funnelled in the valley of the Lambert and Mellor Ice Streams (e.g. Reference Parish and BromwichParish and Bromwich, 1987; Reference DareDare, 1995). The mean wind direction at all sites (Fig. 1) is within about 30° of the fall-line orientation, and on the eastern side of the basin, where the slope is approximately aligned with the mean easterly geostrophic wind direction, this difference is even less. Orientation of erosiona] sastrugi is very closely aligned with the mean wind direction, except at LGB20 where the average wind speed is <8 m s−1 and the surface microrelief consisted of predominantly reshuffled, rather than erosional, snow features (Higham and others, 1997).
The surface lapse rate, calculated from annual mean temperature différences between AWSs, is supcr-adiabatic (at -1.4°C/100m) except for station LGB59. The lapse rate between this station and lower AWS is near-adiabatic, and the annual average temperature at LGB59 is 4.5°C warmer than at sites at the same elevation on the western side of the basin. This is a result of adiabatic warming associated with stronger katabatic winds on the Sleeper eastern slopes; 10 m firn temperatures show that the whole eastern side of the basin, from traverse station LGB50 (75.5° S, 73.0° E) to LGB67 (71.4° S, 77.5° E), is similarly influenced (Higham and others, 1997).
There is a slight increase in contincntality, measured as the difference between mean summer (Decembei-February) and winter (June-August) air temperature, for stations further inland. The summer-winter temperature difference increases on average by about 0.35°C for every 100 km distance from the coast, but differences in summer and winter temperatures are also influenced by the different katabatic regimes at the sites.
The 10 m firn temperature is often used in Antarctica as an approximation to the surface air lemperalure. Table 2 shows that while the instantaneous 10 m firn temperature measured in boreholes during the 1994-95 summer is in close agreement with the average over 3 years calculated from the AWS dala, the firn temperatures are consistently colder than the air temperature (note that the LGB00 air temperature was measured at 2 m height, while all others are at 4 m). This is a result of the very strong near-surface temperature inversions that occur due to radiative cooling during winter months.
Also shown in Table 2 are values of average snow accumulation (surface mass budget) to 15 km either side of the AWS, obtained from measurements made at canes along the Lambert traverse route (Higham and others, 1997). The snow accumulation on the eastern side of the basin (in the “rain-shadow” of the prevailing upper-level winds) is up to 50% less than at equivalent elevation on the western (windward) side. Accumulation is also low to the south, where sites are more distant from the coast.
Seasonal Cycle in Surface Climate
Temperature
At all stations the seasonal cycle in monthly mean temperatures, shown in Figure 2, exhibits a characteristic “kernlose” (coreless) winter between May and September. The indication of slightly warmer temperatures in June and August is probably a result of the limited length of the record used in this study. June 1994 and July 1995 included exceptionally warm periods, with surface temperatures rising by 20°C or more in 2 or 3 days during high-pressure/high-wind-speed events. These periods of extreme surface-temperature increase are at least partly due to a weakening of the surface inversion, for example from subsidence of warmer upper air (Reference Wendler, Kodama, D. H. and StearnsWendler and Kodama, 1993) or by the turbulent mixing from above the inversion with the increased wind speed, rather than an advective warming of the whole aimospheric column. The large winter warming events are large-scale features, seen at all the Lambert AWS siles.
Annual variation of monthly mean temperature (top) and of the standard deviation of daily means within each month (bottom). Standard deviations are shown as an average for all Lambert basin AWS sites.
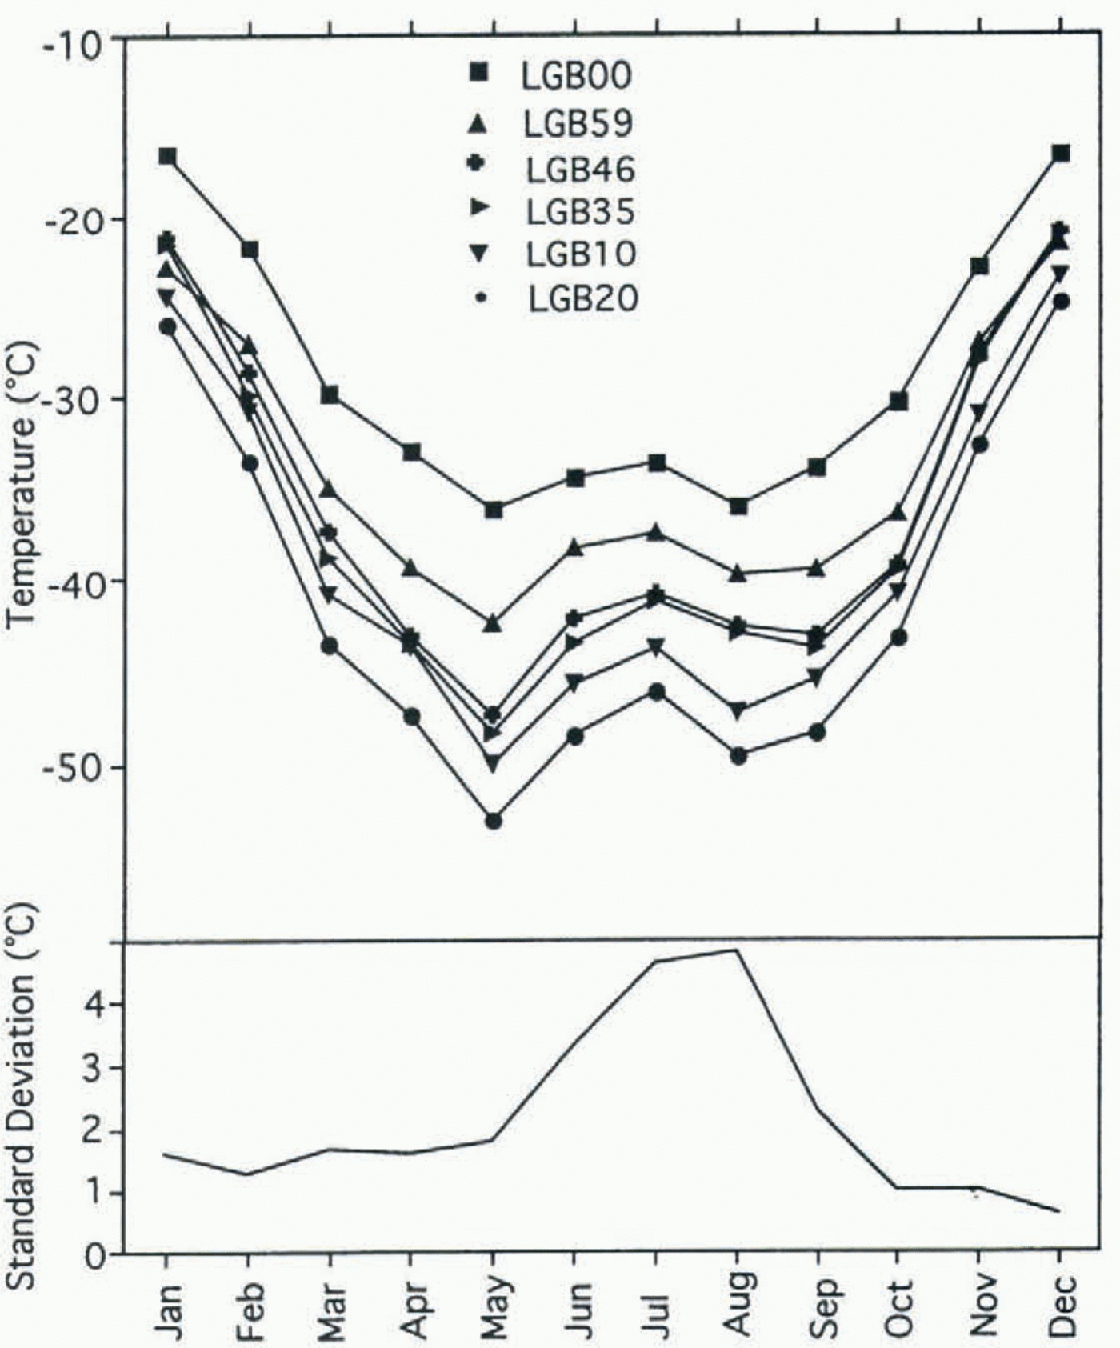
Also shown in Figure 2 is the standard deviation of daily mean temperatures within each month shown as an average for all AWS sites. There is some tendency for stations that are further from the coast to show greater winter temperature variability. However, in the Lambert basin this trend is not nearly as clear as for the Terre Adélie sites studied by Wendler and Kodama (1993), where the ice-sheet elevations also increase systematically with dislance from the coast. Surface air tempera!lire is most variable for winter months between June and September; during winter, meridional (north—south) temperature gradients are greatest and synoptic systems are more vigorous.
Seasonal Variation in the surface lapse rale between LGB00 and other Lambert basin AWS sites.

Figure 3 shows the seasonal change in surface lapse rate, calculated from the difference between monthly mean tem-perature at each AWS and that at the lowest station, LGB00. All sites except LGB59 show a near-dry-adiabatic lapse rate (1°C/100m) during mid-summer, but super-adiabatic conditions at other times of the year. The lapse rates have dual maxima in May and September, and reach 2.4°C/100m between LGB00 and LGB35 during May. Again with the exception of LGB59, the relative magnitudes of the surface lapse rates at their maxima are strongly correlated with the surface slope, with LGB35 having the greatest slope (5.2 m/ km), and LGB10 the lowest (3.2 m/km). For example, during May:

In Wilkes Land, Allison and others (1993) showed from AWS data that sites on the “escarpment” of the ice sheet had near-adiabatic surface lapse rates, while those on the “plateau” were super-adiabatic in winter. The strength of the lapse rate decreased once a threshold slope of about 5 m/km was exceeded, because vertical turbulent mixing from stronger katabatic winds decreased the surface inversion strength. The Lambert basin AWS sites from LGB10 to LGB46 can all be characterized as “plateau” sites.
At LGB59 the monthly lapse rate shows the same pattern of maxima around the equinoxes as at other sites, but the values are consistently lower than dry adiabatiC. Lapse rates for LGB59 calculated relative to temperatures at the near-sea-lcvel Zhong Shan slation(69.4° S, 76.4° E; 18 m) are also close to or below the dry adiabatic lapse rale, ralher than super-adiabatiC. Hence, it is likely that the warmer surface temperatures at LGB59, and at other sites along the eastern side of the basin, are related to an interplay between the ice-sheet slope, katabatic wind and temperature-inversion strength, rather than a regional climatic anomaly.
Pressure
A pronounced semi-annual pressure oscillation, with maxima in July and December, is observed in the monthly mean pressures.This has an amplitude of 9-12 hPa at all sites.The standard deviation of the daily mean pressures within each month has maximum values of 5-10 hPa from June to September. This peak in interdiurna] pressure variation indicates greater cyclonic activity in the winter months (Reference SchwerdtfegerSchwerdtfeger, 1984) due to the increased meridional-temperature gradient, even though the circumpolar trough is located further north (พexler, 1958).
During winter, high-pressure/high-wind-speed events are highly correlated with rapid warming. This has also been noted inlèrre Adelie by YVendler and Kodama (1993), and suggests that the warming includes a component of vertical transport, and not just horizontal advection, normally associated with increased cyclonic activity. The pressure-temperature increases in winter occur near-synchronously across the whole Lambert basin, although there is a slight tendency for the increase to start first at eastern-side sites.
Wind
Figure 4 shows the seasonal cycle in monthly mean wind speed and direction at the six AWS sites. All sites show the high directional constancy typical of katabatic wind regimes, and a pattern of maximum wind speed in winter, consistent with an increase in the downslope gravity force with stronger wintertime surface inversions. Wind direction also turns more towards the fall-line during winter, although at LGB59 the fall-line is close to the direction of mean geostrophic flow, and the net seasonal cycle in wind direction is less.
Annual variation of wind speed (top) and wind-direction deviation (bottom) for the Lambert basin AWS sites. Deviations arefrom the annual mean direction, shown in the legend.

Strongest winds occur at sites with the greatest surface slopes (LGB00, LGB35) and at LGB59 where the mean geostrophic forces (pressure gradient and Coriolis) and the gravity force are aligned: at these three sites the mean winter wind speed exceeds 10 ms−1. The monthly mean wind speed has a range of 7.3 m S−1 at LGB35, compared to a range of 3.7-4.9 M S−1 at all other sites. But at LGB35 the range in monthly mean wind direction is only 14°, compared with >20 at all other stations except LGB59. At LGB35 the surface wind direction is strongly channelled by the topographic trench in which the Mellor and Lambert Ice Streams flow (Higham and others, 1995), and the increased gravity force in winter has the greatest impact on speed, which reaches a monthly mean of nearly 14 m s-1 The directional constancy at this site (the ratio of the scalar average to the vector average of the velocity) exceeds 0.99 during the winter months.
During the summer months the wind speed is greatest on the eastern side of the basin (LGB59) where geostrophic and katabatic wind components reinforce each other.
Diurnal Variation of Wind and Temperature in January
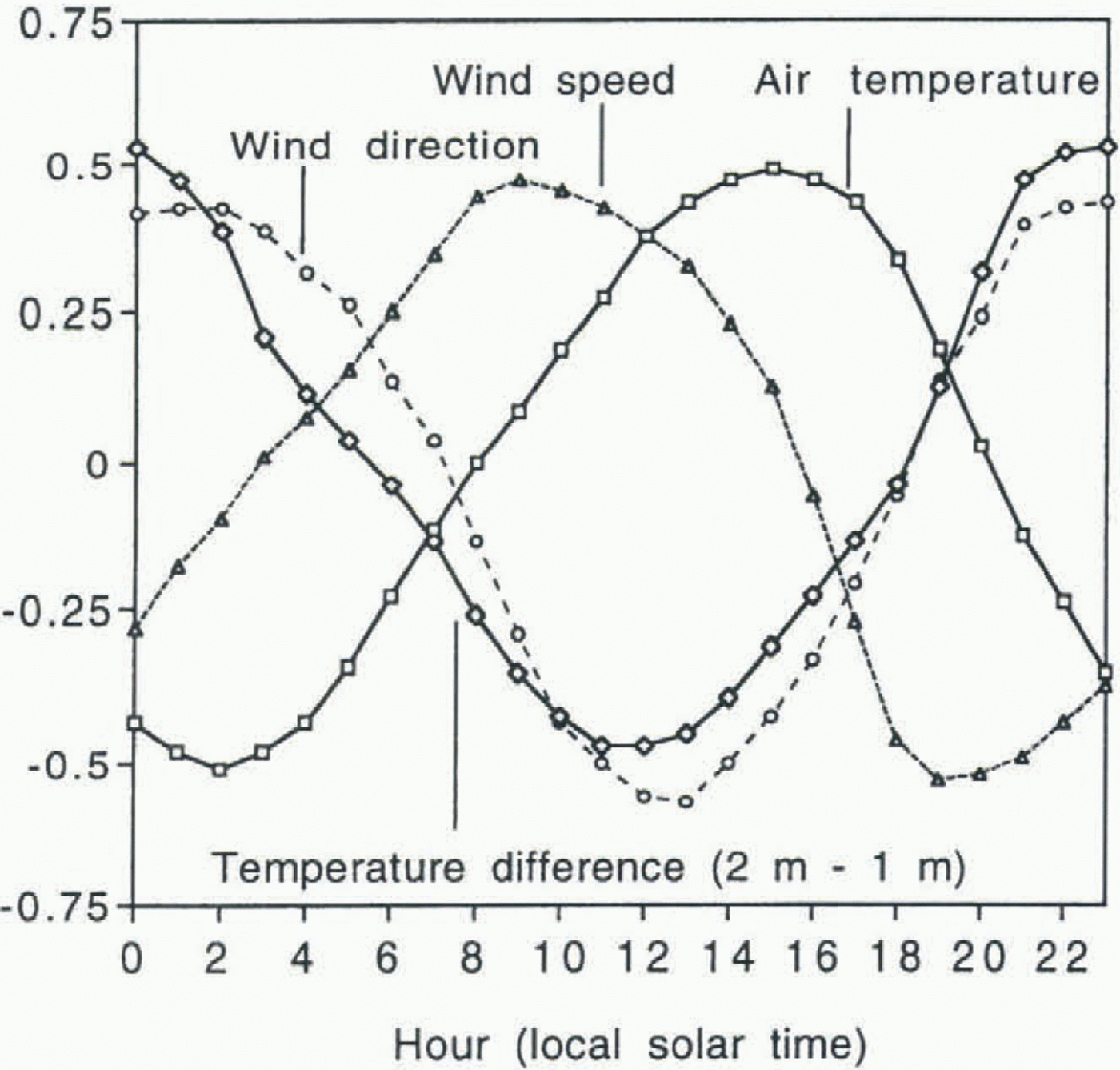
During the polar night there is no diurnal pattern in surface temperature or wind, but during summer the daily cycle in the surface radiation budget changes the surface temperature inversion, and hence the katabatic wind. This is shown with data from all stations for January. Wind and temperature observations from each station have been adjusted to local solar time (LST), and the January data for each of the three years 1994-96 have then been averaged in hourly bins. Approximately 90 observations have been averaged for each variable for each AWS, except around solar noon, when only 30-50 observations are typically available. The difference between the 2 and 1 m temperature sensors has additionally been used as a measure of the near-surface temperature inversion. The resultant patterns of diurnal variability are remarkably consistent from station to station, with an average diurnal range in temperature of 6-8°C, in inversion strength of 0.32-0.47°C, in wind speed of 2.5-3.9 m s−1 and in wind direction of 29-48°.
The pattern of diurnal variability is summarised in Figure 5: here data have been expressed as a deviation from the January mean, normalised by dividing by that mean and averaged across all AWSs. The change in the surface inversion is directly coupled with the radiation budget, such that the weakest inversion is at solar noon and the strongest at local midnight. The change in wind direction closely follows the radiation budget and the temperature inversion pattern: it is furthest from the fall-line slope (i.e. most easterly) no more than 1 hour after solar noon (1200—1300 LSI) and most directly downslope at 0200 LST. However, both the temperature and the wind speed are lagged from the radiational forcing. The wind speed is at its maximum at 0900 LST, and its minimum at 1900 LST, while the temperature is lowest at 0200 LSI; and highest at 1500 LST. The Lambert basin sites would thus appear to be intermediate between steeper coastal locations such as D47 (67.4° S, 138.7° E; 1560 m), where the maximum wind speed occurs in the early morning, about 4 hours behind the minimum in temperature (Wendler and others, 1993), and locations high on the Antarctic plateau where the maximum wind speed occurs in the early afternoon (Reference Mather and MillerMather and Miller, 1967).
Composite normalised hourly deviation of the surface wind and temperature in the Lambert Basin in January. See text for details.
Conclusions
Data from the six AWSs show flow topography of the Lambert Glacier basin controls the katabatic wind regime and strongly influences the surface climate of the slope region to at least 2500 m elevation and up to nearly 1000 km inland. Regional differences in the topography lead to regional differences in the surface climate. The relatively Sleeper slopes on the eastern side of the basin have strong winds (>10 m S−1 annual average), a well-mixed boundary layer, and a near-adiabatic surface lapse rate in most seasons; while the shallower slopes on the western side result in somewhat weaker winds (<8 m s−1 annual average), a stronger inversion and super-adiabatic surface lapse rates in winter. Annual mean temperatures on this side of the basin are 4—5°C colder than at an equivalent altitude on the eastern side. With in the depressions of the Lambert and Mellor Ice Streams, the katabatic flow is topographically channelled. Annual average surface winds here are stronger than elsewhere, and show greater seasonal variation in speed but less variation in direction.
There are strong seasonal and summertime diurnal variations in the wind flow, caused by changes in the seasonal and diurnal radiation budget. A strong pattern of diurnal wind variation in January at all stations has a maximum wind speed at about 0900 LST well after the minimum in temperature at about 0200 LST, and a mostly easterly wind direction at 1300 LSI. Conlinenlalily also influences the seasonal cycle of temperature.
During winter, well-correlated increases in both synoptic temperature and pressure can occur near-synchronously throughout the basin, to at least 1000 km from the coast. Re-gional variations also occur in the snow-accumulation rate. The accumulation rate on the eastern side of the basin (in the “rain-shadow” of the prevailing upper-level winds) is up to 50% less than that at equivalent elevations on the western (windward) side.
ACKNOWLEDGEMENTS The Lambert basin AWSs were installed and maintained, often under difficult conditions, with the assistance of all members of the Lambert Glacier basin traverse parties and with particular support from A. Brocklesby, R. Kiernan and M. Higham. The AWSs were designed and constructed under supervision from J. Morrissy and p. Yates. V. Dirita developed the software used to process the Argos data, and R. Fisher assisted with much of the data analysis.



