INTRODUCTION
The biological habitat generation and the possible interactions between the organisms have been observed in a wide range of benthic marine environments (Bruno & Bertness, Reference Bruno, Bertness, Bertness, Gaines and Hay2001). Animals (sedentary and sessile) and plants commonly form dense aggregations that create, modify and support a new habitat (Jones et al., Reference Jones, Lawton and Shachak1994; Jackson Reference Jackson1997, Reference Jackson2001; Bruno & Bertness, Reference Bruno, Bertness, Bertness, Gaines and Hay2001) through their intricate architectonic shape. Such structures are colonized by different species looking for food and refuge against predators or physical disturbance (Obenat et al., Reference Obenat, Ferrero and Spivak2001) so species richness and diversity can be altered (Jones et al., Reference Jones, Lawton and Shachak1994; Bruno & Bertness, Reference Bruno, Bertness, Bertness, Gaines and Hay2001). Also, they act as nursery for larval and juvenile forms (Nalesso et al., Reference Nalesso, Duarte, Pierozzi and Enumo1995). Many groups can modify hard and soft bottom sites: seagrasses, mollusc valves, seaweeds, corallinaceous algae, corals and polychaetes (Laubier, Reference Laubier1966; Gettleson et al., Reference Gettleson, Phillips and Hammer1985; Nalesso et al., Reference Nalesso, Duarte, Pierozzi and Enumo1995; Obenat, Reference Obenat2002; Gutierrez et al., Reference Gutierrez, Jones, Strayer and Iribarne2003).
Polychaete aggregates can be considered an autogenic ecosystem engineer because their physical structure enhances the availability of food resources for other species (Jones et al., Reference Jones, Lawton and Shachak1994, 1997; Crooks, Reference Crooks2002). The tubiculous polychaetes of the Chaetopteridae (Malmgren, 1867) family build tubes made of chitin (corneous), some bury them in sand or mud, while others attach them to hard substrates and form a biogenic structure that can alter habitats both ecologically and physically (Obenat et al., Reference Obenat, Ferrero and Spivak2001). Predominantly, Phyllochaetopterus socialis Claparède, 1870 is a little worm that builds corneous tubes with ramifications forming dense mats (aggregates) in shallow and deep waters in New Zealand, South Africa, India (including Pakistan, Ceylon, Burma and Malaya), the Mediterranean Sea, US, Mexico, Costa Rica and South America (Rioja, Reference Rioja1941; Fauvel, Reference Fauvel1953; Day, Reference Day1967; Bhaud & Amouroux, Reference Bhaud and Amouroux1975; Probert & Wilson, Reference Probert and Wilson1984; Gettleson et al., Reference Gettleson, Phillips and Hammer1985; Ariño, Reference Ariño1987; Abbiati et al., Reference Abbiati, Airoldi, Castelli, Cinelli and Southward1994; Nalesso et al., Reference Nalesso, Duarte, Pierozzi and Enumo1995; Dean, Reference Dean1996; Obenat et al., Reference Obenat, Ferrero and Spivak2001). These mats can host worm densities reaching up to 100,000 worms/m2 (Gilbert, Reference Gilbert, Uebelacker and Johnson1984).
The mats of P. socialis are associated with hard substrata such as rocks, empty mollusc shelves and handmade hard objects (Nalesso et al., Reference Nalesso, Duarte, Pierozzi and Enumo1995; Obenat et al., Reference Obenat, Ferrero and Spivak2001; Albano et al., Reference Albano, Seco-Pon and Obenat2006a; Barreto et al., Reference Barreto, Kiffer, Dias-Santos, Tomáis, Sá and Krohling2007). They provide structural complexity due to their intricate arrangement of tubes acting as ecosystem engineers like other benthic organisms already mentioned. Although morphological differences in the host species could reflect differences in faunal assemblages, Virnstein & Howard (Reference Virnstein and Howard1987 a, Reference Virnstein and Howardb) argue that species with similar architectures have similar faunal assemblages.
The aim of this research is to describe and analyse temporal changes in the benthic macrofauna assemblage that inhabit the aggregates of the polychaeta P. socialis Claparède, 1870, in the anthropogenically polluted site of the Mar del Plata harbour.
MATERIALS AND METHODS
Study area
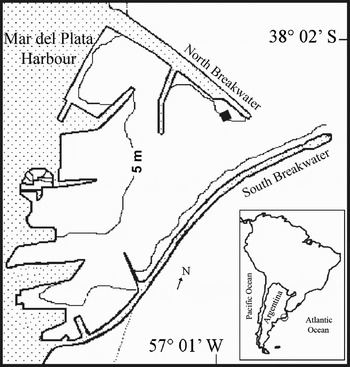
The study was carried out in the Mar del Plata harbour (38° 02′S 57° 31′30″W; Figure 1) Buenos Aires, Argentina, which is one of the most important harbours in the country due to naval traffic, commercial trade and size. The environmental conditions correspond to those of a polluted site having low water turbidity as well as low salinity, dissolved oxygen and pH (Rivero et al., 2005). Industrial and sewage effluents contribute to the increment of organic matter (Bastida et al., Reference Bastida, Capezzani and Torti1971). The harbour area is limited by two artificial breakwaters (north and south) mainly composed of orthoquartzite blocks, and has an approximately 300-m wide mouth. Mean water depth is around 5 m, ranging between 3 and 10 m.
Phyllochaetopterus socialis. Mar del Plata harbour (Argentina) and the sampling site (■).

P. socialis in southern South America
Phyllochaetopterus socialis was recorded for the first time in South America in 1901, off the Argentinian coast at 100 m depth (Buenos Aires Province shelf waters), on dark grey mud and described as the sub-species Phyllochaetopterus socialis platensis (Hartman, Reference Hartman1953). Beyond these records, P. socialis was cited for the region by Rullier & Amoureux (Reference Rullier and Amoureux1979), Pastor de Ward (Reference Pastor de Ward2000), Obenat et al. (Reference Obenat, Ferrero and Spivak2001), Capítoli (Reference Capítoli2002), Giberto (Reference Giberto2003) and Giberto et al. (Reference Giberto, Bremec, Acha and Mianzan2004). The presence of P. socialis aggregates in the Mar del Plata harbour was recorded for the first time by Albano et al. (Reference Albano, Seco-Pon, Obenat and Genzano2006b). It is possible that the registers of P. pictus published by Hartmann-Schröder (Reference Hartmann-Schröder1983) could correspond to the same species (Orensanz, personal communication). Besides, P. socialis was reported as fishery bycatch of the ‘caracol fino’ Zidona dufresnei (Donovan, 1823) in the north-eastern zone of the Uruguayan continental shelf (34°S and 35°W) (Riestra et al., Reference Riestra, Lozoya, Fabiano, Santana and Carrizo2006). Likewise, tubes of an indeterminate species of Phyllochaetopterus registered during the fishery bycatch of scallop Zygochlamys patagonica (King & Broderip, 1832) in Reclutas Banks (39°S and 39°30′S) near the continental slope (Schejter, Reference Schejter2005), could probably be assigned to P. socialis. In recent years, several studies of the aggregates were performed in the rocky shore of São Sebastiao and Espírito Santo, Brazil (Nalesso et al., Reference Nalesso, Duarte, Pierozzi and Enumo1995; Barreto et al., Reference Barreto, Kiffer, Dias-Santos, Tomáis, Sá and Krohling2007), in estuarine areas of the Rio de la Plata (Obenat et al., Reference Obenat, Ferrero and Spivak2001) and in the Mar del Plata harbour (Albano et al., Reference Albano, Seco-Pon and Obenat2006a).
Sampling
Depending on weather conditions, during 2004 and in May 2005, monthly or bimonthly samples were collected near the mouth of the north breakwater in the Mar del Plata harbour. Three samples were randomly selected by SCUBA diving. Each mat was kept in plastic bags in situ underwater and was then fixed at the laboratory with formaldehyde solution (4%). After that, water column displacement was performed in order to estimate the volume of the mats. Polychaete tubes were carefully separated and washed through a 0.35 mm square mesh sieve and the retained organisms were preserved with alcohol (70%). Macrofauna was separated, identified at the lowest possible taxonomic level and counted under 20× binocular microscope for abundance estimation (number of individuals (mean±SD)/250 ml of displacement volume), richness and diversity.
Statistical analysis
Both null hypothesis of no difference on the mean abundance (ind/250 ml) of vagile macrofauna and the mean abundance of the associated biota among the sampling period (February, March, April, June, August, October and December, 2004; May 2005) were evaluated by a one-way ANOVA. Comparisons among means were performed using an a posteriori Tukey test (Zar, Reference Zar1999).
To assess the relative importance of sessile and colonial associated biota (sponges, hydrozoans, sea anemones, bryozoans and tunicates) along the sampled seasons, qualitative dominance (Bouderesque, Reference Bouderesque1971) was used considering their frequency of occurrence (%). This author defined five categories: occasional (0–20%), scarce (21–40%), common (41–60%), abundant (61–80%) and very abundant (81–100%).
Species richness (S, total number of species) was estimated performing a non-parametric estimator, and also Shannon–Wiener (H′ log2), Simpson (D, 1/1 – ∑ pi2), and Evenness (J′, H′/H MAX) indices were calculated (Krebs, Reference Krebs1989). A one-way ANOVA and an a posteriori Tukey test (Zar, Reference Zar1999) were developed to assess the null hypothesis of no difference of these parameters along the months.
According to feeding types, the organisms found in the mats (vagiles and sessile) were classified as deposit feeders (DF), herbivorous (HE), carnivores and/or scavengers (C/S), filter or suspension feeders (F/S) and omnivores (OM). These pre-established trophic groups were assigned following the related literature (Fauchald & Jumars, Reference Fauchald and Jumars1979; Giberto et al., Reference Giberto, Bremec, Acha and Mianzan2004). Crustacean decapods were excluded from the analysis due to the lack of information on their feeding modes (Spivak, personal communication). The null hypothesis of no difference between feeding modes along the sampled months was assessed using a one-way ANOVA test (Zar, Reference Zar1999).
To run the different ANOVAs, data were transformed using square root when necessary to accomplish assumptions of normality and variance homoscedasticity (Zar, Reference Zar1999). For all the analyses, the significance level was fixed at 0.05.
Non-parametric multivariate analyses were performed using the PRIMER v5.0 software package (Clarke & Gorley, Reference Clarke and Gorley2001). Similarities and differences in macrofaunal communities based on species abundance (excluding sessile and colonial), species presence, and feeding types were explored using non-metric multidimensional scaling (nMDS) and analyses of similarity (ANOSIM; Clarke, Reference Clarke1993). In both analyses, Bray–Curtis similarity indices were calculated and when necessary, data were transformed by log10 (X+1). The SIMPER procedure (similarity percentage analysis) was used to determine the percentage of dissimilarity (or similarity) of samples, and the particular taxa responsible for differences between groups (Clarke, Reference Clarke1993).
RESULTS
At the beginning of this study, aggregates of P. socialis were observed only inside the Mar del Plata harbour, in the inner area of the north breakwater, between 5 to 10 m of depth on hard and soft substrata, with a mean volume of 224.2 ml ±124.7 (mean±SD, N = 25).
Community composition
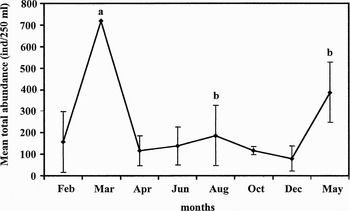
The community inhabiting the mats was conformed by a total richness of 57 species (invertebrates and chordates, all samples combined) belonging to 11 phyla. The total number of vagile organisms recorded during the period was 3865 in a total volume of 5065 ml; the mean volume of the aggregates was 224.2 ml±124.7 (mean±SD, N = 25). Macrofaunal mean total abundance (expressed as number of individuals/250 ml (mean±SD)) ranged from 79.67±57.47 ind/250 ml in December to 718.75 ind/250 ml in March; differences along the sampling period were significant (one-way ANOVA, F = 3.841, df = 6; N = 25; P = 0.013). The Tukey test showed that March differed from all other months with the exception of August and May (Figure 2). The most abundant taxa were Crustacea (51%), Mollusca (39%) and Polychaeta (6%). Crustaceans and polychaetes were the most diverse groups with 14 and 11 species, respectively.
Phyllochaetopterus socialis. Mean total abundance ± SD of the macrobenthic species along the sampling period (only ± SD was not included in March due to the lack of replicates). Different letters indicate the average values of macrofauna that were significantly different between months (P < 0.05).

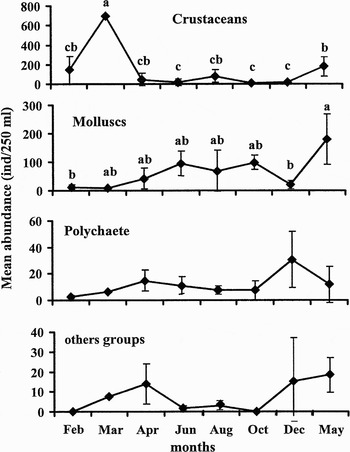
Mean crustacean and mollusc abundance was different among sampling periods (one-way ANOVA, F = 5.502, df = 6; N = 25; P = 0.003 and F = 3.971, df = 6; N = 25; P = 0.011, respectively) while polychaetes and all minority groups combined showed no significant differences (one-way ANOVA: F = 1.955, df = 6; N = 25; P = 0.129 and F = 2.986, df = 6; N = 25; P = 0.035 respectively). The Tukey test revealed that in March the abundance of crustaceans differed from all other months (P < 0.05) while May differed from June, October and December (P < 0.05). Mollusc abundance differed significantly in May in relation to February and December (P < 0.05) (Figure 3).
Phyllochaetopterus socialis. Monthly variation of the most abundant taxa. Mean abundance±SD (only±SD was not included in March due to the lack of replicates). Different letters indicate the average values of taxa that were significantly different between months (P < 0.05).

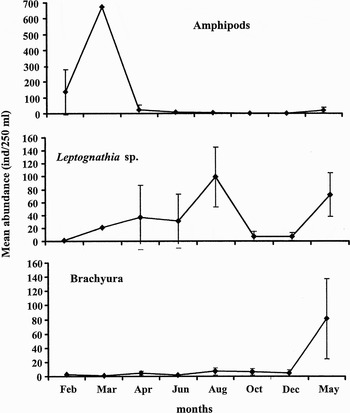
The best represented crustacean taxa in the aggregates were Amphipoda, Tanaidaecea and Brachyura (Figure 4). Amphipods reached their maximum density in March (673.7±0 ind/250 ml), and then oscillated between 136.27±142.8 ind/250 ml and 0.83±0 ind/250 ml during the rest of the year Monocorophium insidiosum (Crawford, 1937; an invasive species) being the most abundant species. The tanaidacean Leptognathia sp. (Bamber, personal communication) showed two peaks: in August (98.9±46.1 ind/250 ml) and in May (75.6±36.7 ind/250 ml). The mean total abundance of the infraorder Brachyura Latreille, 1802 (seven species) was constant along the period and ranged between 1.25±0 ind/250 ml and 6.84±5.00 ind/250 ml reaching the highest value in May (81±56.5 ind/250 ml).
Phyllochaetopterus socialis. Monthly variation of the most abundant crustaceans. Mean abundance±SD (only±SD was not included in March due to the lack of replicates). Amphipods: Monocorophium insidiosum, an indeterminate species of the suborder Gammaridea and Caprella dilatata; tanaidacea Leptognathia sp. and Brachyura: Pilumnus reticulatus, Pyromaia tuberculata, Pilumnoides hassleri, Pelia rotunda, Acontholobulus schmitti, Halicarcinus planatus and Pachycheles laevidactylus.

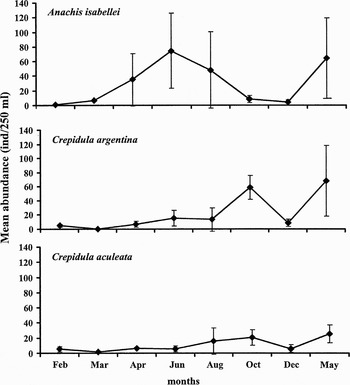
Among molluscs, two of the three most abundant recorded species showed a seasonality pattern around the year. The gastropod belonging to the family Buccinidae Anachis isabellei (d'Orbigny, 1841) showed two peaks, one in June (74.2±51.5 ind/250 ml) and the other in May (64.45±55.11 ind/250 ml) while Crepidula argentina Simone, Pastorino & Penchaszadeh, 2000 and Crepidula aculeata (Gmelin, 1791) peaked in October (58.62±16.9; 20.7±10.33 ind/250 ml) and May (67.76±49.75; 25.55±11.86 ind/250 ml), respectively (Figure 5). However, the abundance of both species of Crepidula could have been overestimated due to the difficult task of separating complete organisms and empty shells.
Phyllochaetopterus socialis. Monthly variation of the most abundant molluscs. Mean abundance±SD (only±SD was not included in March due to the lack of replicates).

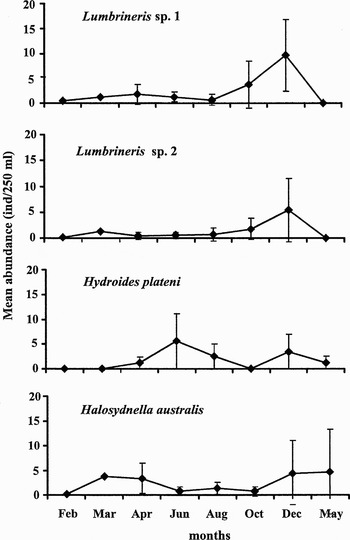
The most abundant polychaetes belonged to Lumbrineridae Schmarda, 1861, Serpulidae Latreille, 1825 and Polynoidae Malmgren, 1867 (Figure 6). Both species of Lumbrineris Blainville, 1828 attested their highest densities in December (9.6±7.2 and 5.3±6.1 ind/250 ml). The high serpulid Hydroides plateni (Kinberg, 1867) mean density was 6.2±5.5 ind/250 ml in January while the polynoid Halosydnella australis (Kinberg, 1855) showed the highest mean abundance in May (4.6±8.5 ind/250 ml).
Phyllochaetopterus socialis. Monthly variation of the most abundant polychaetes. Mean abundance±SD (only±SD was not included in March due to the lack of replicates).

Juveniles belonging to different groups were also recorded in the aggregates. As an example, juvenile molluscs (poliplacophora and bivalvia) occurred in February, April, August and May at low densities (4 ind/250 ml and 14 ind/250 ml, respectively). Asteroidea (3 ind/250 ml) and ofiuroidea (2 ind/250 ml) were registered in May 2005. Ovigerous females of P. hassleri and P. reticulatus (Brachyura) were also observed, but they were not quantified in this study.
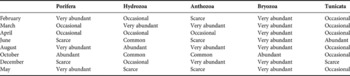
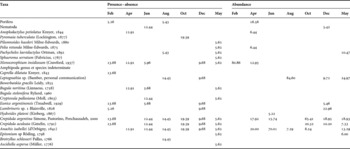
Among sessile organisms, Bryozoa presented the highest relative frequency. They occurred in all samples at different months (Table 1). Instead, Tunicata were occasionally found and were scarce, with the exception of June. The cnidarians (Hydrozoa and Anthozoa) were abundant and very abundant in March, August, and December while sponges were recorded as scarce or occasional in March, April, June and December, but were abundant in all other months.
Qualitative dominance (%) (Bouderesque, Reference Bouderesque1971) of sessile and colonial biota along the sampling period. Categories: occasional (0–20%); scarce (21–40%); common (41–60%); abundant (61–80%); very abundant (81–100%).

Diversity measures
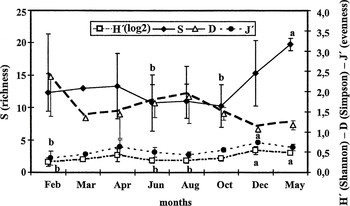
Diversity of the vagile organisms (S = 42) during the complete period was H′ = 3.69, D = 1.13 and evenness was J′ = 0.68. The one-way ANOVA showed differences in these parameters (S, H′ and J′) among months (F = 3.294, df = 6; N = 25; P = 0.025; F = 5.088, df = 6; N = 25; P = 0.004 and F = 4.341, df = 6; N = 25; P = 0.008, respectively) except for the Simpson index (F = 2.663, df = 6; N = 25; P = 0.052) (Figure 7).
Phyllochaetopterus socialis. Mean±SD of vagile taxa richness (S), Shannon (H′), evennes (J′) and Simpson index (D) along the months. Different letters indicate the average values of indices that were significantly different between months (P < 0.05) (only±SD was not included in March due to the lack of replicates).

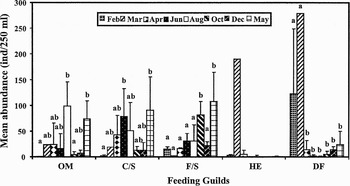
Feeding guilds
Results of the one-way ANOVAs showed differences in mean abundance among months and feeding types (N = 29): omnivores (OM), carnivores and/or scavengers (C/S), filter or suspension feeders (F/S) and deposit feeders (DF) (F = 6.203, df = 6, N = 25; P = 0.001; F = 4.098, df = 6, N = 25; P = 0.01; F = 7.757, df = 6, N = 25; P = 0.001; F = 5.121; df = 6, N = 25; P = 0.004, respectively), except herbivorous (HE) (F = 1.360, df = 6, N = 25; P = 0.286) (Figure 8). In August and May, omnivores presented differences (Tukey test) both with February and October (P < 0.05). Carnivores and/or scavengers showed significant differences in June and May with February (P < 0.05). Abundance of filter feeders was significantly higher in May and October (P < 0.05) and abundance of deposit feeders was significantly different in February and March with respect to the other months (P < 0.05).
Phyllochaetopterus socialis. Mean abundance + SD of feeding guilds along sampling period (only + SD was not included in March due to the lack of replicates). Different letters indicate the average values of feeding guilds that were significantly different between months (P < 0.05). OM, omnivores; C/S, carnivores and/or scavengers; F/S, filter or suspension feeders; HE, herbivorous; DF, deposit feeders.

Multivariate analyses
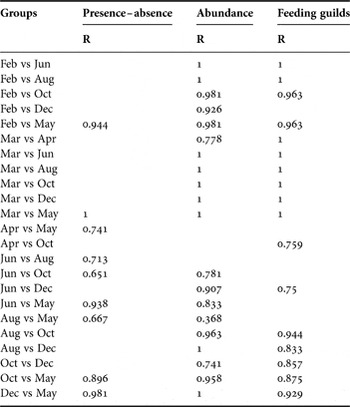
Analyses of similarities showed that the macrobenthic community structure differed among the analysed months for presence–absence of all species (N = 57) (global R = 0, 54, P = 0.001), abundance of vagile species (N = 42) (global R = 0.733, P = 0.001) and abundance of feeding guilds (N = 29) (global R = 0.450 P = 0.001; Table 2).
One-way ANOSIM considering: presence–absence of all the species (N = 57), abundance of vagile species (N = 42) and abundance of feeding guilds (N = 29). R-statistics values only for significant pair-wise comparisons of species composition.

vs, versus.
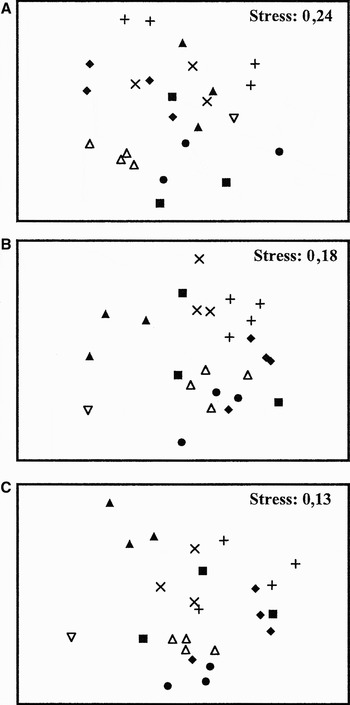
Results of MDS of species presence–absence showed that samples collected in May were well separated but the other months presented some overlapping indicating similarities (Figure 9A). Taking into account the abundance of species (excluding sessile and colonial), samples in February, March, October and December were each clustered while in April, May and August samples presented overlapping (Figure 9B). According to feeding guilds (Figure 9C), February and March samples (summer months) were clearly separated from autumn, winter and spring samples.
Phyllochaetopterus socialis. MDS ordination of months using (A) presence–absence; (B) abundance of species (excluding sessile and colonial); and (C) feeding guilds. Months: ▴, February; ▿, March; ■, April; ⧫, June; •, August; +, October; ×, December; and Δ, May.

SIMPER analysis of species contributions (%) for each taxon at each month according to presence–absence and abundance during the study period (March not included due to the lack of replicates).

According to presence–absence of all species, the SIMPER procedure (Table 3) showed that the species (taxa) which most contribute to differences in February were: the gastropods C. argentina, C. aculeata, the amphipods M. insidiosum and C. dilatata, the polychaetes Eunice argentinensis and Lumbrineris sp. 1. In April, June, August, October and December, differences were mainly due to the gastropod A. isabellei, although Brotryllus schlosseri Pallas, 1766, C. argentina, Leptognathia sp. and Pyromaia tuberculata were also well represented. In May, similar percentages of bryozoans and ascidians (sessiles) and gastropods and crustaceans (vagiles) explained the differences compared with other months.
The SIMPER procedure for species abundance contributions (Table 3) showed that in February the species explaining differences with the other months was M. insidiosum, while in April and June it was the mollusc A. isabellei. In August and May, differences were due to the abundance of the tanaidacean Leptognathia sp. while for October, the species that explained differences were the molluscs C. argentina and C. aculeata. The polychaete Lumbrineris sp. explained the differences in December.
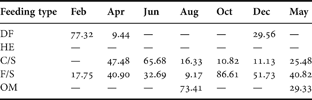
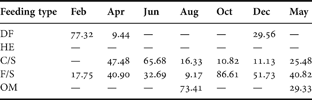
Finally, considering the abundance of feeding guilds, the SIMPER procedure showed that deposit feeders were responsible for differences in February (Table 4). The carnivores and/or scavengers contributed to the differences in April, June and May while filter or suspension feeders were dominant in October, December and May. In August, omnivorous were the most abundant trophic guild.
SIMPER analysis of species contributions (%) according to feeding guilds during the study period. Deposit feeders (DF), herbivorous (HE), carnivores and/or scavengers (C/S), filter or suspension feeders (F/S) and omnivores (OM) (March not included due to the lack of replicates).
DISCUSSION
Phyllochaetopterus socialis aggregates constitute a diversity reservoir inhabited by 57 species. These aggregates represent a stable environment for permanent and transitory residents. The assemblage of benthic macrofauna in P. socialis aggregates suggests the existence of microhabitats that provide substrate, refuge for predation, and availability of food which increase richness and diversity. The results also show notorious temporal changes in composition, abundance and feeding guilds of the macrofauna associated with the mats.
The benthic macrofauna inhabiting the studied mats show a slightly lower species richness if compared to that observed in mats of other areas of the south-western Atlantic such as the rocky littoral in Aracá beach, Brazil (Nalesso et al., Reference Nalesso, Duarte, Pierozzi and Enumo1995: 68 species) and the Rio de La Plata estuary, Argentina (Obenat et al., Reference Obenat, Ferrero and Spivak2001: 63 species). However, species richness is much higher in Mar del Plata harbour mats than in the surrounding soft sediments (Rivero et al., Reference Rivero, Vallarino and Elías2005: 35 species). In terms of number of species, the best represented taxa are crustaceans (14), polychaetes (11), molluscs (7), bryozoans (6) and cnidarians (5). As other researchers have found, it seems that high values in terms of abundance of certain groups such as crustaceans, polychaetes and molluscs as hosts in the aggregates and in other biotic substrate are common (Obenat et al., Reference Obenat, Ferrero and Spivak2001; Giberto et al., Reference Giberto, Bremec, Acha and Mianzan2004; Riestra et al., Reference Riestra, Lozoya, Fabiano, Santana and Carrizo2006; Barreto et al., Reference Barreto, Kiffer, Dias-Santos, Tomáis, Sá and Krohling2007). Obenat et al. (Reference Obenat, Ferrero and Spivak2001) found that polychaetes, bryozoans, cnidarians, nematodes and cirripedia crustaceans presented high abundance although data were analysed in a relative frequency scale. In other biotic substrates, crustaceans and molluscs were the most abundant taxa in a study of benthic macroinvertebrates bycatch of the snail Zidona dufresnei in Uruguay (Riestra et al., Reference Riestra, Lozoya, Fabiano, Santana and Carrizo2006) and in benthic assemblages in the Rio de la Plata estuary and adjacent waters (Giberto et al., Reference Giberto, Bremec, Acha and Mianzan2004). Zidona patagonica and Z. dufresnei can be considered ecosystem engineers like P. socialis because they are capable of providing benthic organisms a structural complexity for settlement, shelter and food availability.
Taking into account the benthic fauna found in the soft sediment surrounding mats in the Mar del Plata harbour, the highest values of abundance corresponded to nematodes and polychaetes (Rivero et al., Reference Rivero, Vallarino and Elías2005) while crustaceans and molluscs represent <1% of total dominance.
As regards vagile organisms, the invasive amphipod Monocorophium insidiosum showed higher densities within the mats mainly during summer. In a similar way, Bastida et al. (Reference Bastida, Trivi, Lichtschein and Stupak1980) had observed M. insidiosum in the fouling community of the harbour. This species commonly occurs at high abundance levels in other harbours and in natural areas around the world (Prato & Biandolino, Reference Prato and Biandolino2006). Anachis isabellei (as Pyrene isabellei) was also registered by Bastida et al. (Reference Bastida, Trivi, Lichtschein and Stupak1980) in the Mar del Plata harbour but in lower densities than those observed in this research. Giberto et al. (Reference Giberto, Bremec, Acha and Mianzan2004) found this gastropod (also as Pyrene isabellei) in the Rio de la Plata estuary and adjacent waters at low salinity conditions (<15 psu). Considering the third most abundant species, Leptognathia sp., more detailed taxonomic studies should be carried out to establish if it corresponds to a new species or it could be assigned to a Brazilian one (Bamber, personal communication).
As Obenat et al. (Reference Obenat, Ferrero and Spivak2001) observed in the Rio de la Plata estuary in terms of relative abundance, the best represented sessile organisms are six species of bryozoans, but quite different results estimated by means of relative abundance scale were reported by Bastida et al. (Reference Bastida, Trivi, Lichtschein and Stupak1980) in the fouling community of the Mar del Plata harbour. Five species reported in the present work were considered exotic by Orensanz et al. (Reference Orensanz, Schwindt, Pastorino, Bortolus, Casas, Darrigan, Elías, Lopez Gappa, Obenat, Pascual, Penchaszadeh, Piriz, Scarabino, Spivak and Vallarino2002). On these grounds, abundance could have increased in the last years, thus explaining the variation with findings in the 1980s.
There are few studies to compare richness and diversity indices obtained in P. socialis mats. The highest values of H′ in the months of summer and autumn were similar to those registered by Nalesso et al. (Reference Nalesso, Duarte, Pierozzi and Enumo1995) in Brazil, but this research work also recorded high diversity in winter and they did not find significant differences among sampling periods. On the other hand, data obtained for the Argentinian continental shelf showed that richness and diversity were higher in the P. socialis mats than in sediments (Roux & Bremec, Reference Roux and Bremen1996; Obenat et al., Reference Obenat, Ferrero and Spivak2001; Rivero et al., Reference Rivero, Vallarino and Elías2005) and slightly higher than in mollusc bycatch (Schejter, Reference Schejter2005; Riestra et al., Reference Riestra, Lozoya, Fabiano, Santana and Carrizo2006).
The structural complexity and the presence of temporary organisms (juveniles of different taxa and Brachyura ovigerous females) in the assemblages suggest the role of P. socialis as shelter providing refuges for recruits that will later migrate to other areas. Furthermore, the enhancement of richness and diversity is one of the main effects assigned to ecosystem engineers. Both results observed in this study allow to consider that P. socialis act as an ecosystem engineer in the Mar del Plata harbour.
In the harbours, human activities change natural substrata replacing them with man-made structures particularly vertical surfaces (e.g. sandstone walls and piling). Complex surfaces such as natural and artificial substrates in harbours can provide sites for settlement and improved opportunities for attachment, growth and survivorship of organisms (Walters & Wethey, Reference Walters and Wethey1996). Moreover, an increase in the size of habitat often increases the number of species (Simberloff & Abele, Reference Simberloff and Abele1982) and this can happen at relatively small scales for subtidal epibiota (Butler, Reference Butler1991). The addition of pilings or pontoons involves the creation of additional patches of hard substratum increasing the dispersal of sessile native organisms and also facilitates the invasion of exotic taxa (Connell, Reference Connell2001). Connell & Glasby (Reference Connell and Glasby1999) and Connell (Reference Connell2001) in Sidney Harbour found that artificial structures may increase the abundance and diversity of subtidal epibiota in spite of the pollution of the harbour. In Otago Harbour (New Zealand), Grove & Probert (Reference Grove and Probert1999) found in an area considered vulnerable to anthropogenic impacts a total of 92 taxa mainly represented by annelids, molluscs and crustaceans.
In Mar del Plata harbour, it is hypothesized that strong hydrodynamics affect the region of the mouth, as shown by low organic content. During sieving, dominance of sandy sediments was evident in outer sampling location according with the Rivero et al. (2005) and Bastida et al. (Reference Bastida, Capezzani and Torti1971) results which show that sandy sediments characterize the outer region. In the inner harbour, poor environmental conditions are due to restricted water movement and the prevalence of high values of organic matter was measured. Along the environmental gradient, outer areas present high water dynamics, whereas the inner area shows high pollution level, and intermediate stations present an intermediate degree of stress of both hydrodynamics and pollution gradient (Rivero et al., 2005).
According to presence–absence of all species, the analysis shows that the species (taxa) which most contribute to temporal variability are gastropods, tanaidaceans, amphipods, polychaetes, ascidians and bryozoans, probably indicating seasonality of certain species or recruitment at different developmental stages. Also, tanaidaceans, amphipods and gastropods are the species that contribute to separate samples when considering the abundance of vagile species among different months.
Differences due to the abundance of feeding guilds could indicate a temporal succession of permanent residents during the sampling period. This could be explained taking into account the availability of organic matter (phytoplankton or residual material generated by zooplankton grazing, decomposition and other processes in the water column) and the presence of preys and predators between the tubes of P. socialis. Thus, the abundance of sediment and filter feeders in the months of summer and spring could be attributed to primary production and to residual organic matter in the water column. Since the structural complexity of the tubes causes the accumulation of sediment and organic matter (Nalesso et al., Reference Nalesso, Duarte, Pierozzi and Enumo1995; Obenat et al., Reference Obenat, Ferrero and Spivak2001), higher densities of sediment feeders like amphipods and polychaetes were observed. In contrast, during the winter and autumn months, the presence of carnivores and/or scavengers could indicate that the main food sources for the associated macrofauna are preys between the tubes. As observed in other studies of P. socialis aggregates (Gettleson et al., Reference Gettleson, Phillips and Hammer1985; Nalesso et al., Reference Nalesso, Duarte, Pierozzi and Enumo1995; Obenat et al., Reference Obenat, Ferrero and Spivak2001; Barreto et al., Reference Barreto, Kiffer, Dias-Santos, Tomáis, Sá and Krohling2007), the presence of organisms belonging to different feeding guilds suggests a complex food web within the mats.
Temporal changes in abundance, richness, diversity and trophic groups observed in the mats do not agree with the study of Nalesso et al. (Reference Nalesso, Duarte, Pierozzi and Enumo1995) in San Sebastián, Brazil. However, temporal changes were observed in the settlement of fouling organisms in the Mar del Plata harbour (Bastida et al., Reference Bastida, Trivi, Lichtschein and Stupak1980; Trivi de Mandri et al., Reference Trivi, Lichtschein and Bastida1984). This is the first research work on temporal variability of a particular microhabitat in the Mar del Plata harbour: the P. socialis mats. Future studies of other habitats in this harbour will surely permit the production of a model of temporal changes in a very complex site due to the characteristics of environmental variables (salinity, pH and dissolved oxygen), extensive urban, industrial and harbour development and the natural and artificial surfaces suitable for benthic fauna settlement. Also, these studies will contribute to the knowledge of the very important role this Chaetopteridae worm has in the benthic community.
ACKNOWLEDGEMENTS
This paper was funded by the Universidad Nacional de Mar del Plata (Project UNMdP: Ecología y Ontogenia de Invertebrados Acuáticos). We thank Lic. J.P. Seco Pon for his great help and understanding during sampling. We are grateful to Dr María de los Angeles González Sagrario and Dr José María (Lobo) Orensanz for their helpful comments and advice. Thanks to Dr Roger Bamber for his useful comments about the taxonomy of tanaidaceans. We also thank Ana Cosulich and Gabriela Albano for their help with the English version.