
Introduction
The incorporation of porosity often confers advantages to the mechanical, thermal, optical, or chemical properties of materials and to the performance of components incorporating porous materials.[Reference Schaefer1–Reference Ashby, Evans, Fleck, Gibson, Hutchinson and Wadley5] In particular, chemical properties of porous materials can be superior to those of their dense analogs if the chemical property is surface mediated and the pore surface is accessible for chemical reaction. Open-cell foam materials,[Reference Gibson and Ashby4] in which the entire interior pore surface of the material is accessible, thus have a great advantage for electrochemical, catalytic, separation, and other surface-based applications.[Reference Schaefer1–Reference Erlebacher and Seshadri3] The structural (i.e., load-bearing) integrity of such materials is degraded, however, by the large porosity, ϕ. Typically, in open-cell foams ϕ ≈ 0.8 and hence the solid fraction (1–ϕ) ≈ 0.2. The significant porosity leads to design trade-offs between chemical properties (enhanced by greater porosity) and mechanical properties (usually degraded by porosity). Similar trade-offs exist for thermal properties (insulating ability enhanced by porosity) or optical properties (refractive properties enhanced by porosity) versus mechanical properties.[Reference Schaefer1–Reference Erlebacher and Seshadri3] The trade-off is especially acute for open-cell foams formed from ceramics and glasses as the mechanical properties are usually determined by the surface-defect controlled brittle fracture response of the base material rather than the less defect-sensitive ductile response of metal foams.
In developing an open-cell foam material or assessing its mechanical properties, instrumented indentation techniques are especially useful and have been used extensively: only small volumes of material are required for testing (relative to tension, compression, or bending specimens), the test surface requires minimal preparation, specimen gripping is not an issue, and the test can be performed locally to provide a map of the spatial distribution of properties. In such techniques, the indentation load and displacement are continuously measured as a (usually) pyramidal or spherical probe is first driven under load- or displacement-control into the material and then reversed. In conventional indentation testing, the ensuing residual indentation deformation is measured after unloading. Indentation tests at larger, multi-millimeter, scales tend to be conventional, including the early works on (probably closed-cell) polymer foams,[Reference Shaw and Sata6, Reference Wilsea, Johnson and Ashby7] or employ displacement-controlled probes in universal testing machines, including tests on open-cell foams of zirconia[Reference Ashby, Palmer, Thouless, Goodman, Howard, Hallam, Murrell, Jones, Sanderson and Ponter8] and aluminum-carbon nanotube composites,[Reference Krommenhoek, Shamma and Morsi9] open- and closed-cell aluminum titanate-mullite composite foams,[Reference Sarkar, Lee, Park, Mazumder, Aneziris and Kim10] closed-cell aluminum foam,[Reference Olurin, Fleck and Ashby11, Reference Sudheer Kumar, Ramachandra and Ramamurty12] porous alumina,[Reference Latella, O'Connor, Padture and Lawn13, Reference Staub, Meille, Le Corre, Rouleau and Chevalier14] snow,[Reference Huang and Lee15] and plaster.[Reference Bouterf, Adrien, Maire, Bajer, Hild and Roux16, Reference Bouterf, Maire, Roux, Hild, Bajer, Gouillart and Boller17] A porous material is distinguished here by an approximate solid fraction (1 − ϕ) ≥ 0.6 compared with approximately (1 − ϕ) ≤ 0.2 for a closed-cell foam. In both cases, the pores or cells are isolated. At slightly smaller, sub-millimeter scales, load-controlled specialty micro-indenters are employed, including tests on plaster[Reference Clément, Meille, Chevalier and Olognon18] and porous rocks.[Reference Kitamura and Hirose19] At the smallest, micrometer and smaller, scale, load-controlled “nanoindenters” are employed, including tests on open-cell gold foam,[Reference Hodge, Biener, Hayes, Bythrow, Volkert and Hamza20] open- and closed cell silica foams,[Reference Toivola, Stein and Cook21, Reference Jauffrès, Yacou, Verdier, Dendievel and Ayral22] semi-closed cell mullite foam,[Reference Tulliani, Montanaro, Bell and Swain23] (closed cell) silica aerogel,[Reference Kucheyev, Hamza, Satcher and Worsley24] and porous titania,[Reference Han, Hong and Xu25] alumina,[Reference Ling, Wang and Ma26] zirconia,[Reference Chintapalli, Jimenez-Pique, Marro, Yan, Reece and Anglada27] and La0.6Sr0.4Co0.2Fe0.8O3.[Reference Chen, Wang, Bhakhri, Giuliani and Atkinson28–Reference Chen, Wang, Brandon and Atkinson33]
Clear similarities and differences emerge from a survey of these indentation studies, performed on different foamed or porous materials over a range of length scales. Two points, in particular, stand out: first, similar indentation deformation is observed in all foams. The deformation is localized axially beneath the indenter with little or no transverse deformation and consists of simple displacement of the volume of foam material by the volume of the indenter. There appears to be no reversible elastic deformation exterior to the indentation contact region. The irreversible deformation within the indentation contact appears in the form of axial crushing or collapsing of cells; in the case of ductile materials by the buckling, plastic deformation, and tearing of cell walls,[Reference Shaw and Sata6, Reference Wilsea, Johnson and Ashby7, Reference Olurin, Fleck and Ashby11, Reference Sudheer Kumar, Ramachandra and Ramamurty12] and in the case of brittle materials by the fracture of cell walls and struts.[Reference Sarkar, Lee, Park, Mazumder, Aneziris and Kim10, Reference Bouterf, Adrien, Maire, Bajer, Hild and Roux16–Reference Clément, Meille, Chevalier and Olognon18, Reference Toivola, Stein and Cook21] In brittle open-cell foams, the fractured walls and struts form debris that falls away from the indenter through the cell openings or “windows.” Transverse and longitudinal fracture of individual struts in an open-cell alumina foam has been demonstrated in a range of macroscopic loading geometries.[Reference Brezny, Green and Dam34–Reference Acchar, Souza, Ramalho and Torquato38] Localized indentation fracture and crushing have also been observed in un-foamed porous brittle materials.[Reference Latella, O'Connor, Padture and Lawn13–Reference Huang and Lee15, Reference Han, Hong and Xu25] The second point is that although the indentation load-displacement responses were discontinuous in most materials, the nature of the discontinuity was clearly different between load- and displacement-controlled tests. In displacement-controlled tests, the broadly increasing indentation load was punctuated with transient load drops, usually small but in some cases approaching the entire supported load.[Reference Ashby, Palmer, Thouless, Goodman, Howard, Hallam, Murrell, Jones, Sanderson and Ponter8–Reference Sudheer Kumar, Ramachandra and Ramamurty12, Reference Huang and Lee15, Reference Bouterf, Adrien, Maire, Bajer, Hild and Roux16, Reference Dam, Brezny and Green36, Reference Acchar, Souza, Ramalho and Torquato38–Reference Meille, Lombardi, Chevalier and Montanaro41] The load would then recover and continue to increase with increased imposed displacement before a repeat of the transient. In load-controlled tests, the indentation displacement was punctuated with transient displacement excursions, usually small but often approaching a significant fraction of the maximum displacement[Reference Clément, Meille, Chevalier and Olognon18, Reference Toivola, Stein and Cook21, Reference Tulliani, Montanaro, Bell and Swain23, Reference Ling, Wang and Ma26, Reference Chen, Wang, Giuliani and Atkinson29, Reference Chen, Wang, Atkinson and Brandon30, Reference Chen, Wang, Brandon and Atkinson33] at near-zero increase in load. The displacement would then continue to increase slowly with an increased imposed load before a repeat of the displacement excursion. In some cases, it was noted that the displacement excursions were variable and depended on indentation location on the sample.[Reference Toivola, Stein and Cook21, Reference Tulliani, Montanaro, Bell and Swain23, Reference Ling, Wang and Ma26] In both load- and displacement-controlled tests, the discontinuities were interpreted as the effects of collapse or crushing of individual cells or pores or discrete small groups of cells within the indentation contact area, giving rise to transient increases in contact compliance. Conversely, in cases in which the microstructure was too small or the indentation too large, the discrete nature of the cells could not be detected and the load-displacement traces were smooth, reflecting a near continuum response.[Reference Staub, Meille, Le Corre, Rouleau and Chevalier14, Reference Kitamura and Hirose19, Reference Hodge, Biener, Hayes, Bythrow, Volkert and Hamza20, Reference Jauffrès, Yacou, Verdier, Dendievel and Ayral22, Reference Kucheyev, Hamza, Satcher and Worsley24, Reference Han, Hong and Xu25, Reference Chintapalli, Jimenez-Pique, Marro, Yan, Reece and Anglada27, Reference Chen, Wang, Bhakhri, Giuliani and Atkinson28, Reference Chen, Wang, Atkinson and Brandon31, Reference Chen, Wang, Brandon and Atkinson32]
In the work here, attention is focused on developing a model for the load-displacement behavior of a brittle open-cell foam during load-controlled indentation by a fixed profile (e.g., conical or pyramidal) probe, building on the observations above. Indentation deformation is assumed to be localized beneath the contact, punctuated by the intermittent crushing of discrete groups of cells that gives rise to variable displacement excursions. The model is very different from the previous, continuum-mechanics-based, models of foam and porous material indentation that are typically focused on the choice of solid constitutive model for the indented material.[Reference Chen, Wang, Brandon and Atkinson33, Reference Gold42–Reference Tekoğlu, Gibson, Pardoen and Onck47] Some of these models generate some of the characteristics noted above, e.g., load oscillations[Reference Fleck, Otoyo and Needleman43] and damage localization.[Reference Chen, Wang, Brandon and Atkinson33, Reference Tekoğlu, Gibson, Pardoen and Onck47] A major motivation for the development of the current model is the determination of cell crushing parameters and their variability from instrumented indentation measurements, typified in work on silica.[Reference Toivola, Stein and Cook21]
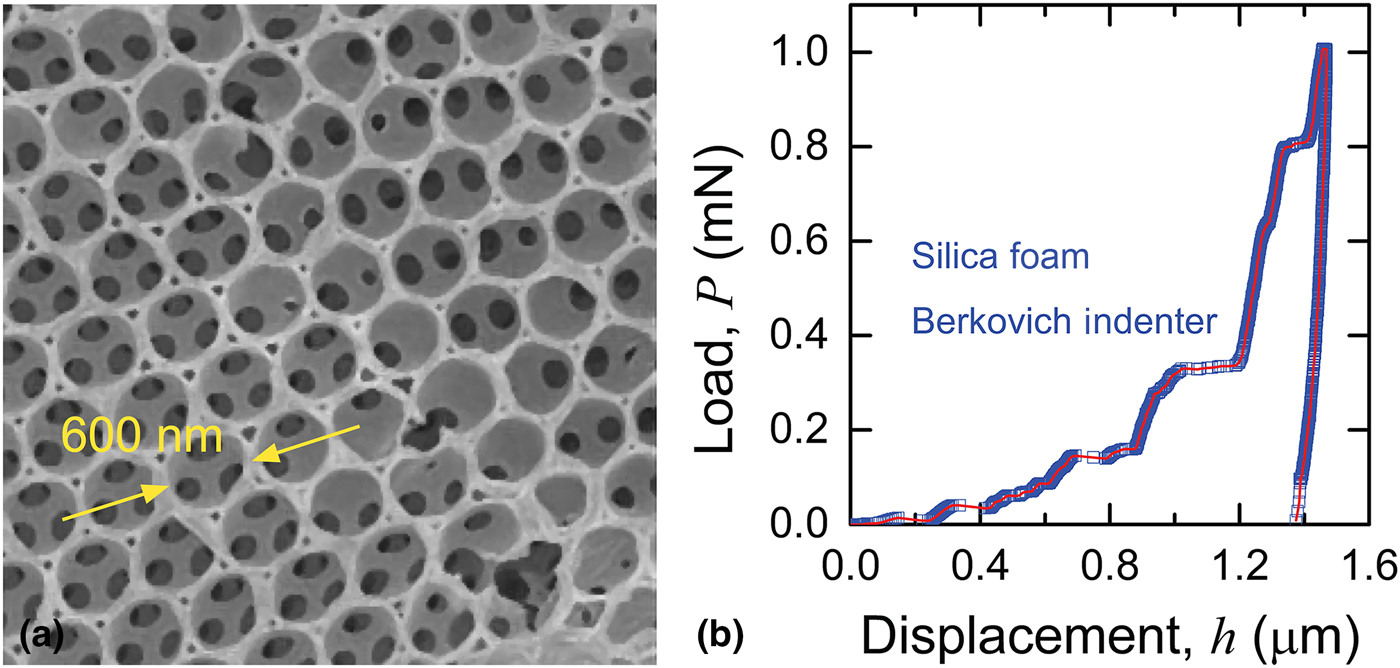
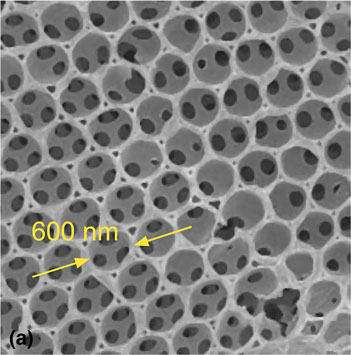
Figure 1(a) shows the “inverse opal” open-cell silica foam studied earlier[Reference Toivola, Stein and Cook21] and considered here. The microstructure consisted of near-spherical pores surrounded by fine struts, forming open-windowed cells arranged in a close-packed array. The cells and windows were about 600 nm (0.6 µm) and 150 nm in diameter, respectively, and the struts were about 50 nm in width; the solid fraction was (1−ϕ) ≈ 0.24 (note the localized defective cells with closed windows or broken struts). Figure 1(b) shows an example load-controlled Berkovich indentation load-displacement, P-h, trace for the material. The loading response forms a staircase as noted above, alternating between gradual displacement increases associated with sequential load increments and large displacement excursions occurring in a few load increments at the cell diameter scale. The unloading response is steep, with a slope similar to the slopes observed during the gradual displacement increases on loading, leading to little indentation recovery and a large hysteresis loop. Observations showed indentation damage in the form of cell crushing to be restricted to the contact area.[Reference Toivola, Stein and Cook21] The intent of the model developed here is to describe the observations of Fig. 1(b), and to extend that description to include spatial variability in responses, the transition to a continuum response at large indentation loads, and the stiffening effects of indenter penetration through the foam into the dense substrate.
(a) Scanning electron microscope image of a silica open-cell foam showing the cells in a hexagonally close-packed array, the struts forming the cells, and the windows between the cells. (b) Indentation load-displacement, P-h, response for the silica foam, showing intermittent displacement excursions on loading comparable in scale to the cell diameter.

Model
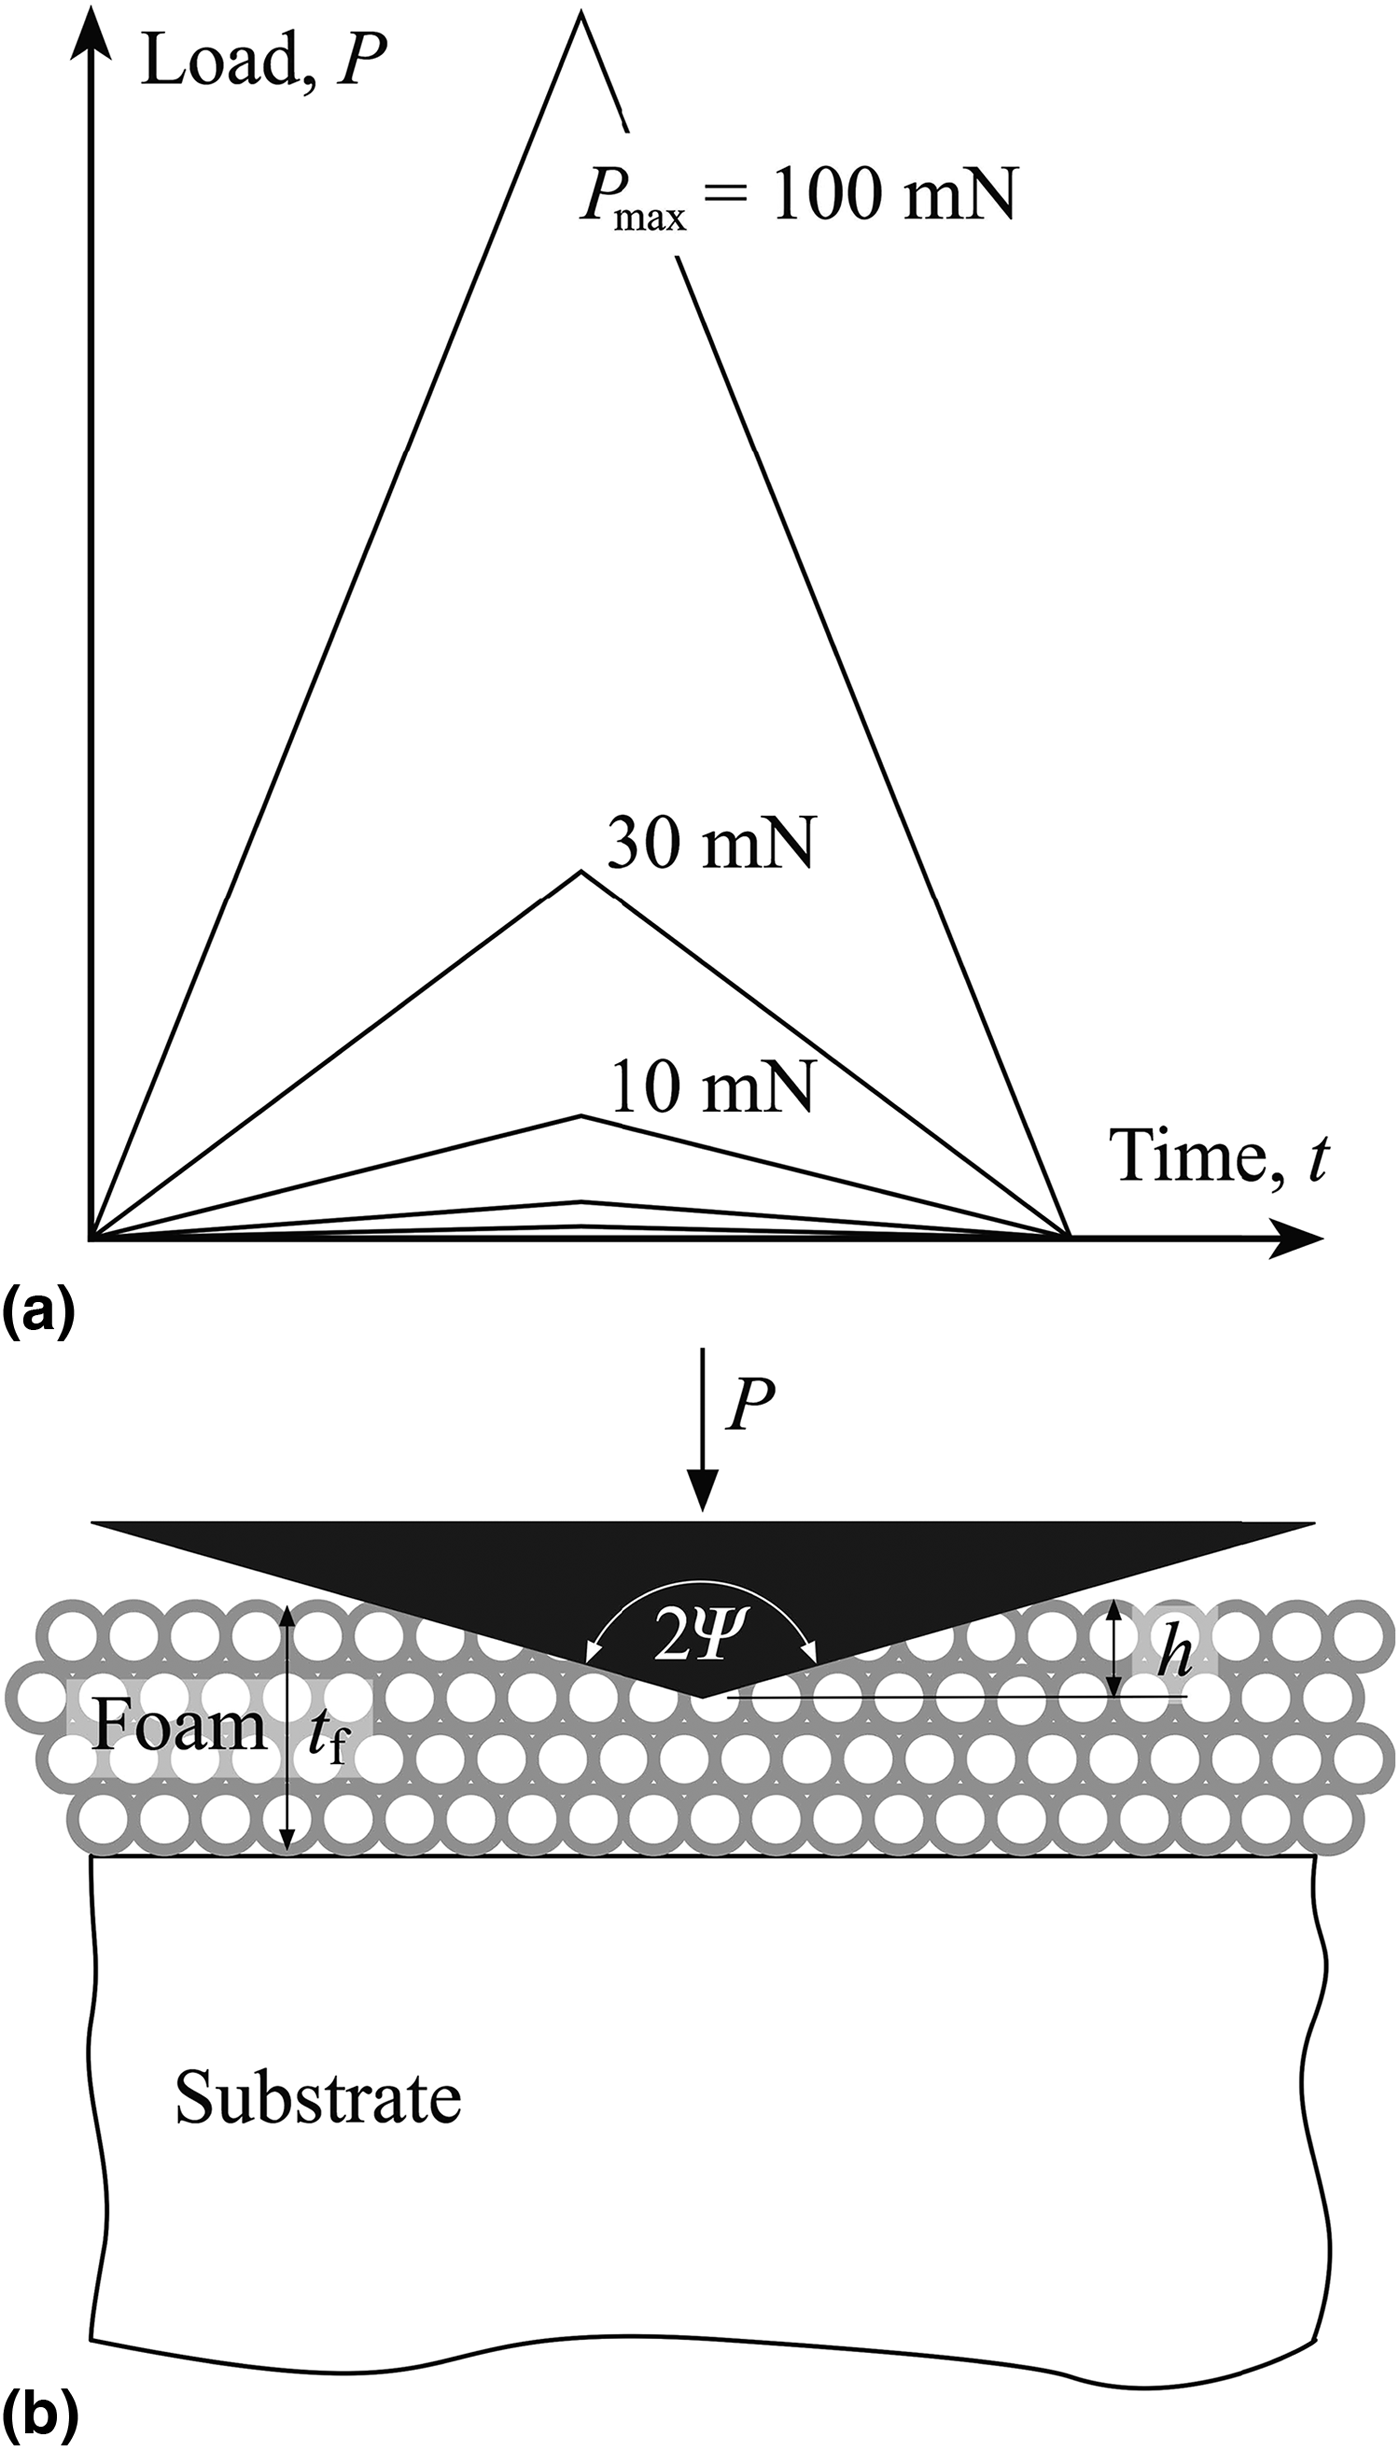
The indentation load spectrum under consideration here, P(t), is a common triangular wave with peak load P max as shown in Fig. 2a. P max will be varied from 1 mN to 100 mN and a common test period of 200 s is assumed. Time, t, is a weak factor here (unlike viscoelastic indentation,[Reference Cook48] but see below). A symmetric conical diamond indenter of included angle 2ψ = 140.6° is assumed. This angle describes a conical shape equivalent to the relatively obtuse pyramidal Berkovich indenter in terms of cross-sectional area as a function of tip distance. The foam is assumed to be in the form of a film, thickness t f, on a dense soda-lime glass substrate with base fixed to the indenter. The indentation displacement h(t) is determined relative to the surface of the silica foam. A schematic cross-section of the indentation is shown in Fig. 2b. The goal is to determine h(t) and eliminate t as a parameter to obtain a conventional P-h trace.
(a) Triangle load-time spectra used in the indentation model. The peak load, P max, was varied from 100 mN to 1 mN. (b) Schematic cross-sectional diagram of conical indentation of a foam on substrate system. The foam cell dimensions and thickness and indenter included angle are similar to those observed and modeled.

The essence of the model is the alternation during indentation loading of the mean contact pressure between a minimum, relaxed value, p r, and a maximum, critical value, p c, reflecting material responses, as the applied indentation load P increases. The mean indentation contact pressure is given by P/A where A is the projected indentation contact area. For simple crushing, A is identical to the indenter cross-sectional area, given as a function of indentation displacement h by
 $$A = \alpha h^2,$$
where α = πtan2ψ = 24.5. At peak load the maximum indentation displacement is h max, composed of two components: a majority component of displacement, h f, associated with fractured and crushed cells and struts largely beneath the indenter; and, a minority component (h max–h f) associated with elastic deformation of intact cells and struts. Using Eq. (1), the pressure condition at the peak load is thus in the range  $p_{\rm r} \le P_{{\rm max}}/\alpha h_{{\rm max}}^2 \le p_{\rm c}$. Unloading from peak load is elastic, usually expressed in displacement-control terms,[Reference Oliver and Pharr49]
 $$P = P_{{\rm max}}(h - h_{\rm f})^m/(h_{{\rm max}} - h_{\rm f})^m,$$
or, inverting for a load-controlled system,
 $$h = h_{\rm f} + (h_{{\rm max}} - h_{\rm f})(P{\rm /}P_{{\rm max}})^{1/m},$$
where m is an empirical exponent. For a geometrically similar system (which this is not) m = 2, for invariant contact area (which this approximates) m = 1. The instantaneous mean contact pressure, P/αh 2, decreases from the peak load value to zero on complete unloading as the indentation load decreases from P max to 0 and the displacement decreases from h max to h f. The elastic strain energy in the foam is zero at complete unloading. Reloading at the same location is elastic until the peak load conditions are once again attained.
The first indentation loading behavior is a variant of the reload-from-unload behavior. Two states during loading, x and y, are considered. After initial contact, the loading process leads to both crushed and elastically deformed cells. At some point during loading, the condition (P x, h x) is met in the absence of an incipient fracture and crushing event, such that  $P_{\rm x}{\rm /}\alpha h_{\rm x}^2 = p_{\rm r}$. Elastic strain energy in the foam is not zero in this state (x), as in an unloaded configuration, but at a local minimum value characterizing elastic deformation of struts and cells in relaxed stable equilibrium loaded configurations. Further loading from this state is elastic and reversible, described by a relation similar to Eq. (2b),
 $$h = h_{\rm x} + (h_{{\rm max}} - h_{\rm f})\left[ {\left( {P - P_{\rm x}} \right){\rm /}P_{{\rm max}}} \right]^{1/m}.$$
During loading from this state, values of P, h, and the mean contact pressure increase gradually until the condition (P y, h y) is met such that 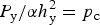 $P_{\rm y}{\rm /}\alpha h_{\rm y}^2 = p_{\rm c}$. The elastic strain energy density in the foam is a maximum in this state (y) and a critical instability condition for an incipient strut or cell fracture or crushing is reached. Further incremental increase in indention load exceeds the instability condition leading to a substantial and irreversible indentation displacement excursion Δh. The excursion is halted at Δh as stable equilibrium is regained at the condition P y/α(h y + Δh)2 = p r. (It is envisaged that the load increase is slow enough relative to the rate of excursion such that this process occurs at essentially fixed load P y.) The new displacement after the excursion, h y + Δh, is obtained by eliminating load P y from the above instability and stability conditions to give
 $$h_{\rm y} + {\rm \Delta} h = h_{\rm y}\left[ {1 + \left( {\,p_{\rm c}{\rm /}p_{\rm r} - 1} \right)} \right]^{1/2}$$
The two-step process, elastic loading followed by inelastic displacement, then repeats, replacing (P y, h y + Δh) with (P x′, h x′) at a new starting state x′.
Equation (4) implies that displacement excursions should increase in size as the absolute indentation displacement increases, or, equivalently, as the contact area or indentation load increase. This is not in accord with the intuition that the crushing of an approximately fixed number of cells, representing an approximately fixed area within the contact, should have less of an effect as the contact area increases. The implication is also not in accord with the observations above that indentations encompassing many cells or pores generate smooth, continuum-like responses; a tendency to less pronounced staircase behavior was also observed at large indentation loads in the silica foam considered here.[Reference Toivola, Stein and Cook21] Hence, if the instability configuration y is periodically reached for a fixed number of cells, independent of the contact area or load, the difference between the relaxed and critical pressures should decrease as the area or load increases and a discrete to continuum transition should be exhibited. A simple representation of this is the differential relation dp r/dP ~ (p c – p r), which leads to an increase of the relaxed pressure with the load as
 $$p_r = p_c - {\rm \Delta} p{\rm exp}( - P{\rm /}P_{{\rm char}}{\rm ),}$$
where Δp is a maximum difference between the pressures pertaining on initial contact and P char is a characteristic transition load. For P ≪ P char, the foam behaves in a discrete manner as described above. For P ≫ P char, the foam behaves as a continuum and deforms in a geometrically similar manner as P = αp ch 2; for an elastic-plastic material p c is then the hardness and for an ideally plastic material is then related to the yield stress.
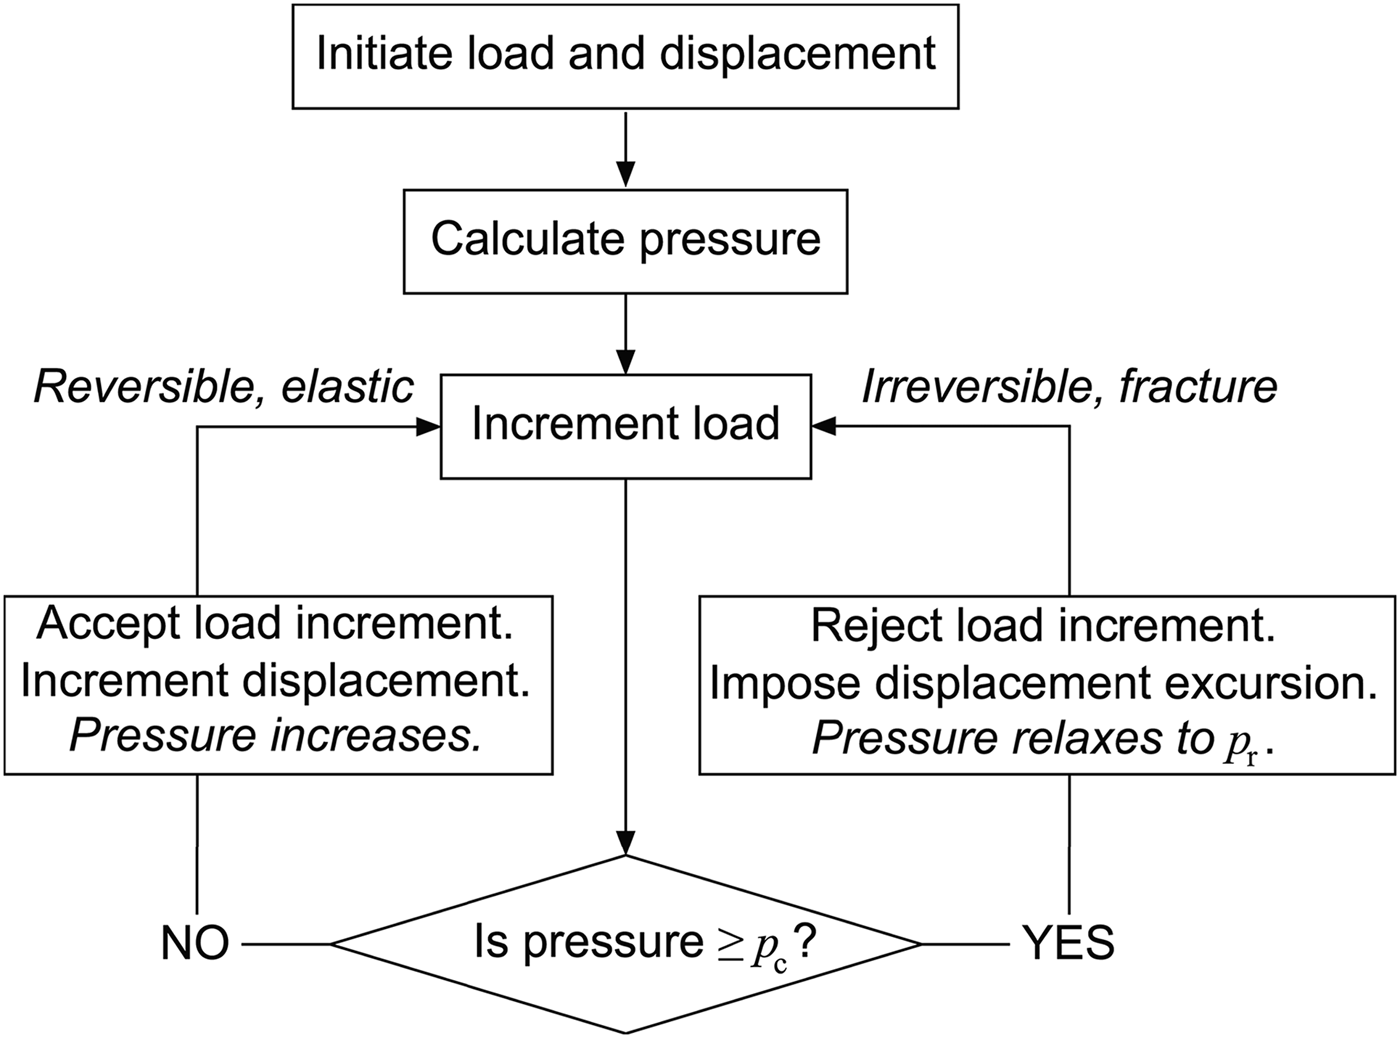
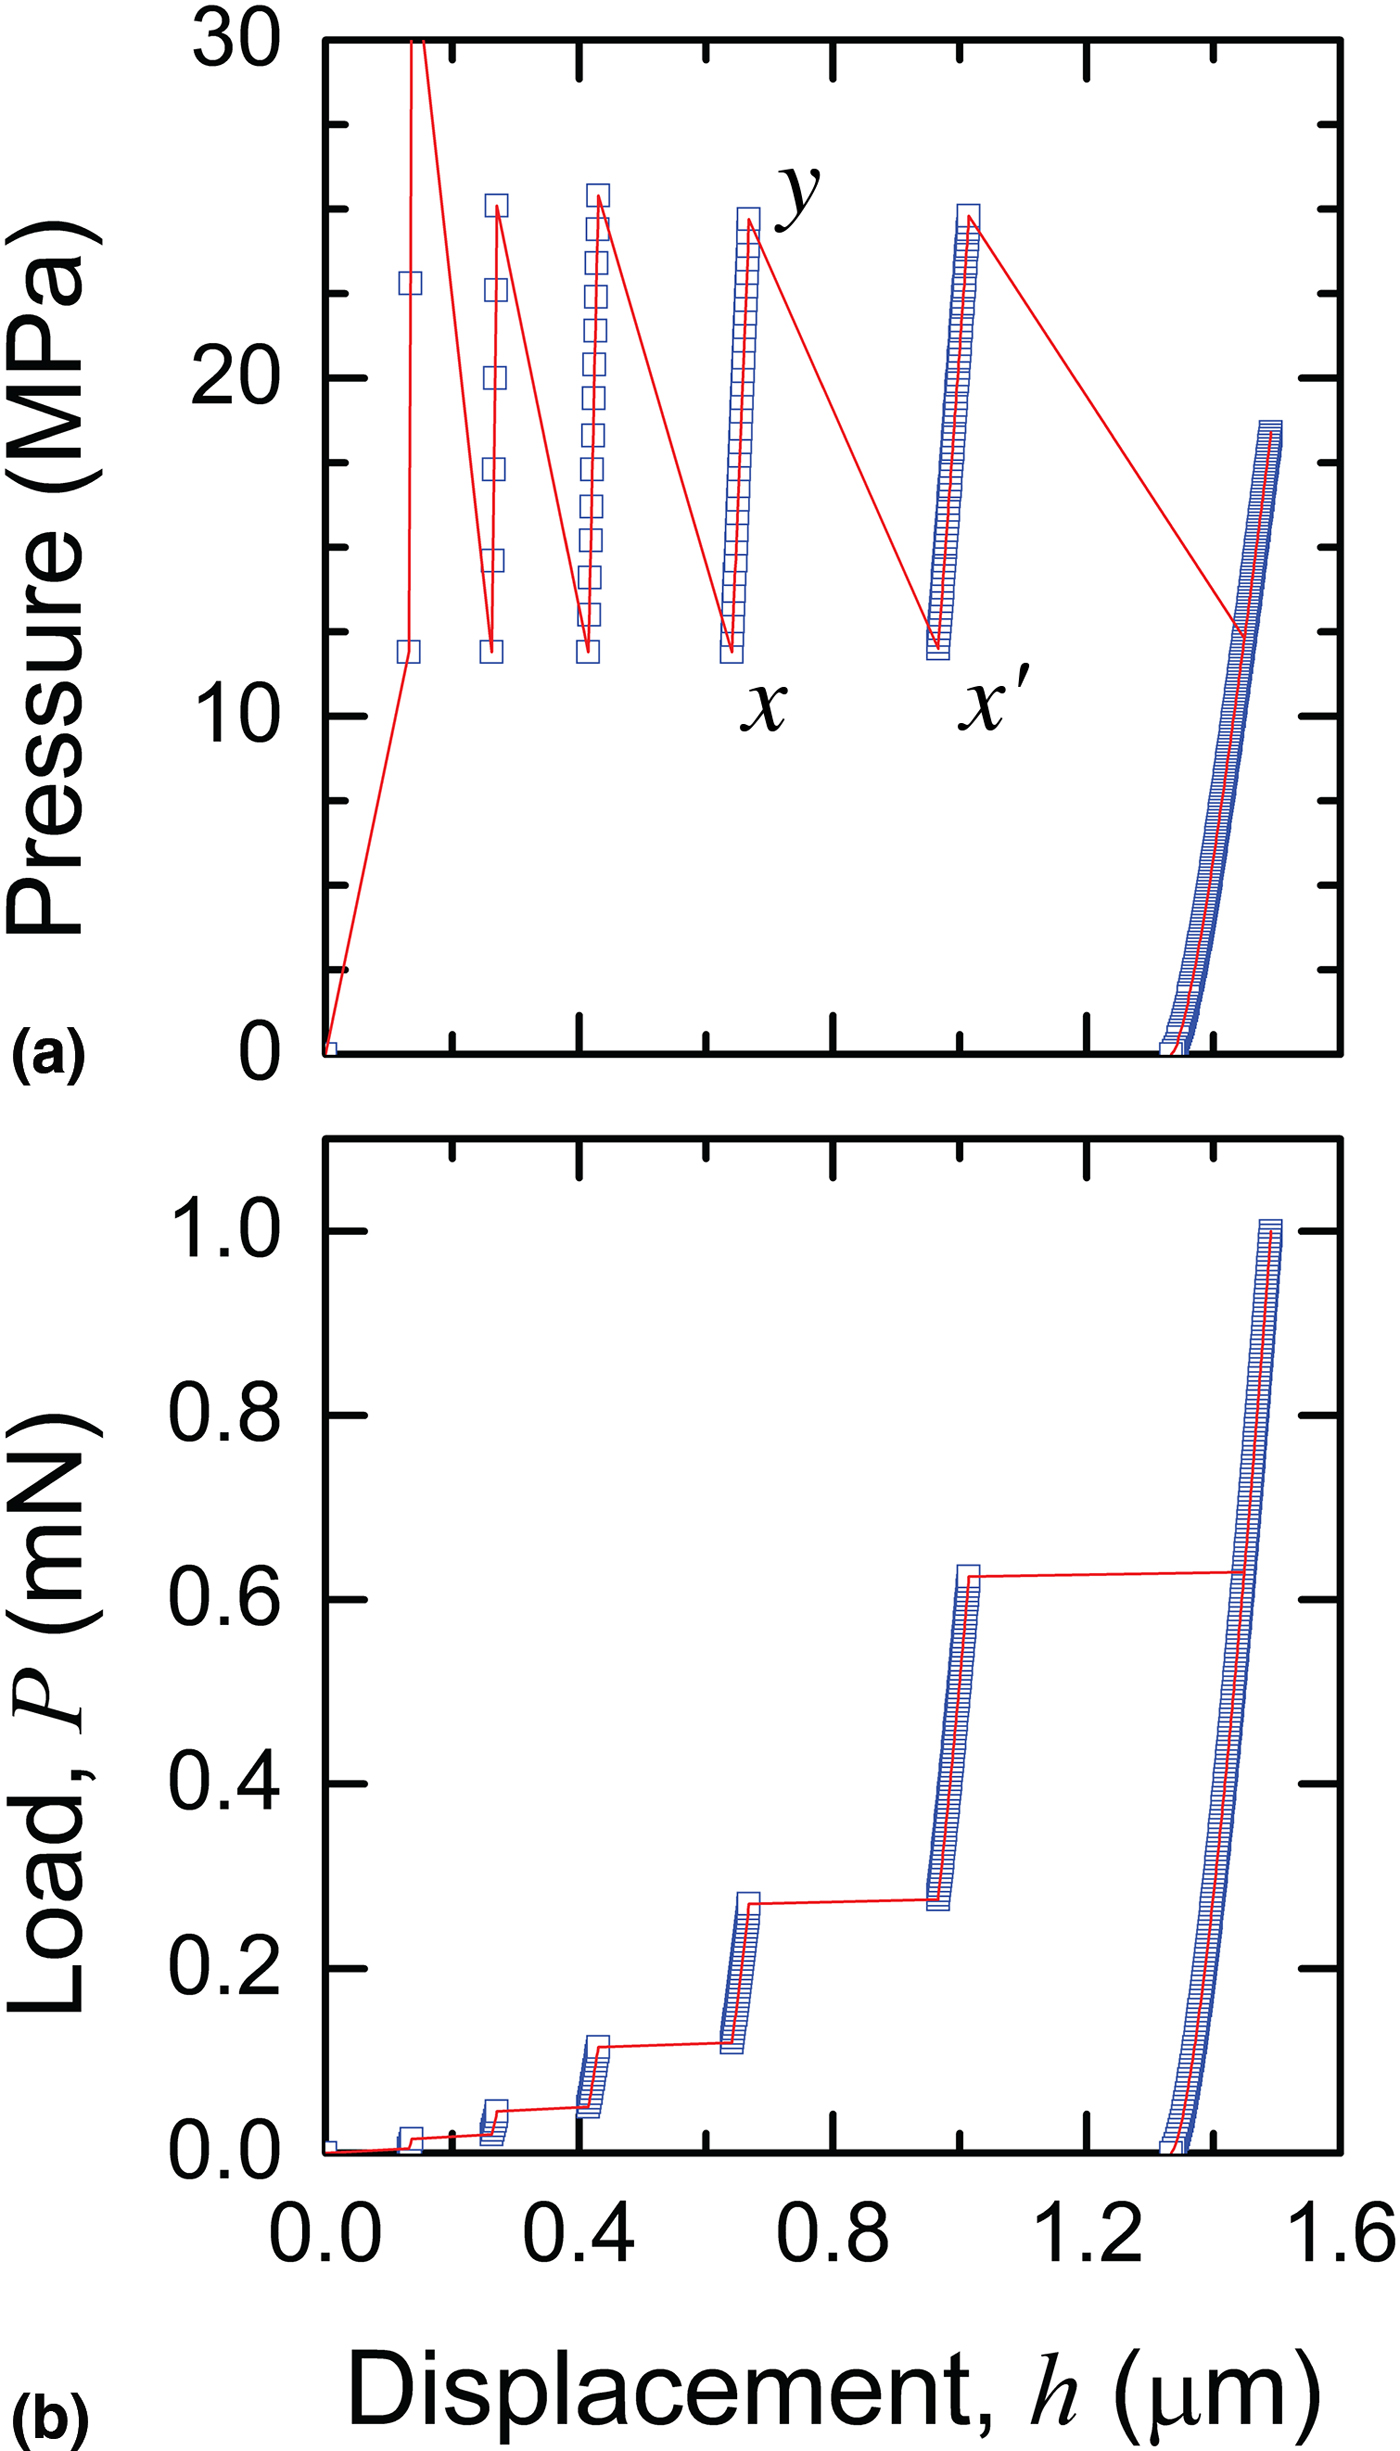
Figure 3 shows a block diagram of the foam indentation loading model sequence encapsulated in Eqs. (1), (2), (4), (5), and Fig. 1(a); the sequence is simply implemented numerically. Figure 4(a) shows the variation of pressure as a function of indentation displacement during an indentation sequence to P max = 1 mN modeled by Eqs. (1) to (5). Loading parameters p c = 25 MPa, Δp = 13 MPa, and P char = 20 mN, and unloading parameters h f/h max = 0.9 and m = 1.7 were used. The pressure exhibits an oscillation between the invariant upper critical value and lower relaxed values (convergence to the upper value as the indentation load and hence displacement increased were not observed here as P max ≪ P char.) The increasing pressure responses indicate the gradual elastic deformation processes (transitions x → y) and the decreasing pressure responses indicate the sudden fracture and crushing displacement excursions (transitions y → x′). Figure 4(b) shows the P-h response associated with the underlying pressure variation. The P-h response was sampled to give about 200 points, indicated by the symbols; the line is a guide to the eye. The loading response is staircase like and the unloading response exhibits little recovery. The modeled response is very similar to the observed response, Fig. 2(b).
Flow diagram of the algorithm used to model foam indentation. The load was varied as in Fig. 2 and displacement determined via a reversible elastic path (left) or an irreversible fracture path (right) according to a critical pressure condition.

(a) The oscillatory variation of pressure with indentation displacement as modeled for a foam: x and x′ are stable configurations separated by an unstable configuration y. (b) The load-displacement behavior for a foam conjugate to (a) showing the displacement excursions under load-controlled indentation.

At large indentation loads and displacements, the indenter penetrates the foam (2.7 µm thick in this case[Reference Toivola, Stein and Cook21]), h ≥ t f [Fig. 2(b)], and the P-h response begins to the reflect the increased indentation resistance of the underlying, dense, soda-lime glass substrate (i.e., greatly decreased indentation displacement). At h = t f, the indenter just reaches the substrate at indentation load  $P_{\rm t} = \alpha p_{\rm f}t_{\rm f}^2 $, where p f is the effective deformation pressure in the foam at this indentation depth, and p f ≈ p c is expected (giving P t ≈ 12 mN). For h > t f, or P > P t, the indenter extends into the substrate and the load is supported by a disc of substrate material deforming elastic-plastically at pressure p s in parallel with a surrounding annulus of foam material deforming at p f [Fig. 2(b)]. The load is given by
 $$P = p_{\rm s}(h - t_{\rm f})^2 + p_{\rm f}\left[ {h^2 - {(h - t_{\rm f})}^2} \right],h\, \gt \,t_{\rm f}$$
where the first term on the right side of Equation (6a) represents the substrate disc and the second term represents the foam annulus. Equation (6) is quadratic in h that is easily inverted to give the displacement on extension into the substrate as
 $$\hskip-1pc h = t_{\rm f} + \left\{ {t_{\rm f}p_{\rm f}{\rm /}p_{\rm s}} \right\}\{ [\left( {\,p_{\rm s}{\rm /}p_{\rm f}} \right)\left( {\left( {P{\rm /}P_{\rm t}} \right) - 1} \right)]^{1{\rm /2}} - 1\}, P \gt P_t,$$
noting that as p f ≪ p s, the displacement is greatly reduced from the extrapolated foam response for P > P t.
Results
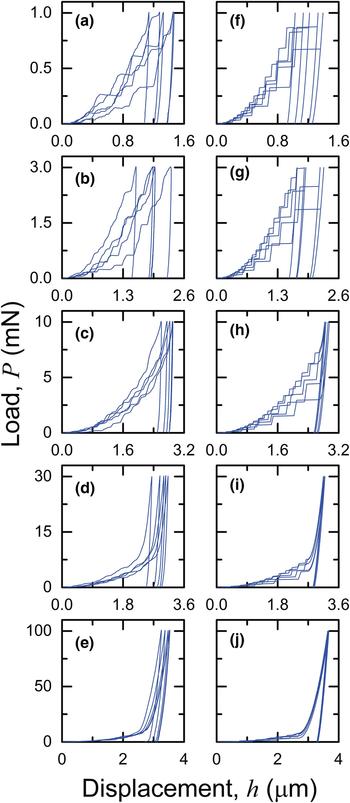
Figures 5(a)–5(e) show the observed P-h responses of the foam-substrate system for P max = 1 mN to 100 mN; five experimental responses from five different material locations are shown for each peak load. For the lowest peak loads, P max = 1 mN and 3 mN, the responses resemble staircases and there is considerable variability in both the loading response and the recovered displacement on unloading. At 10 mN, the staircase effect and the variability in both loading and unloading are decreased. At 30 mN, the variability is further decreased and it is clear that the indenter has encountered the substrate as the load increases significantly above the foam response for loads greater than about 12 mN at displacements greater than 2.7 µm. At 100 mN, the responses are completely affected by the substrate, exhibiting the two-stage behavior of initial large compliance (foam) followed by small compliance (substrate) and little variability in either loading or unloading.
Direct experiment-model comparison of load-displacement, P-h, traces: (a) to (e) experimental observations for an open-cell silica foam at various peak indentation loads; (f) to (j) results of the model developed here using a critical pressure criterion for displacement excursion and including substrate effects. The variation in experimental P-h responses is due to microstructural effects, included in the model by variations in critical pressure.

Figures 5(f)–5(j) show the modeled foam-on-substrate P-h responses for the same peak loads and number of tests stated above, using Equations (1)–(7). The soda-lime glass substrate deformation pressure of p s = 4 GPa and unloading parameters of h f/h max = 0.6 and m = 1.7 used in the modeled responses were invariant, as were the foam characteristic load and unloading parameters as given above. The key foam parameters giving rise to the variability in the modeled responses were contained in the selected ranges of the deformation pressures (p c, Δp), (44 MPa, 8 MPa) to (27 MPa, 13 MPa); the same sets of (p c, Δp) pairs were used within these ranges for each peak load to give the variation of modeled responses in Fig. 5. All model parameters were chosen to provide the best visual fit to the observations. The striking similarity of the modeled responses to the observations, both qualitatively and quantitatively, is clear,
Discussion and conclusions
The simple model developed here encapsulates many of the aspects of load-controlled instrumented indentation observed in brittle open-cell foams.[Reference Staub, Meille, Le Corre, Rouleau and Chevalier14, Reference Clément, Meille, Chevalier and Olognon18–Reference Chen, Wang, Brandon and Atkinson33] In particular, at small peak loads, the responses are characterized by intermittent displacement excursions, leading to “staircase”-like P-h responses that are variable from indentation to indentation (the underlying pressure variations were also observed in a previous model[Reference Fleck, Otoyo and Needleman43]). The excursions are related to localized cell crushing [Fig. 1(b)] and the variability reflects local effects of microstructural variation [Fig. 1(a)]; as the peak load increases the excursions and variability decrease, reflecting a discrete network to continuum solid transition (Fig. 5); and, at large peak loads, the responses are considerably stiffened by indenter interaction with the dense substrate (Fig. 5). The model was demonstrated here to provide agreement with the measured values of quantities observed on a silica foam, including the spatial scale of the excursions, of one or two cell diameters (about 600 nm), the contact pressure range (about 10–40 MPa), the foam thickness (2.7 µm), and the substrate hardness (about 4 GPa).[Reference Toivola, Stein and Cook21] The extent of the qualitative and quantitative agreement provides strong support for the underlying physical basis of the model.
It is important to note that the current work follows the same philosophy as that followed previously in consideration of viscoelastic-plastic (VEP) indentation.[Reference Cook48] That philosophy is to produce as a model output the indentation response in the most commonly encountered experimental form: the P-h trace. In VEP indentation, the analysis is most easily conducted in displacement-time space and experiments are best conducted at fixed peak load with variations in loading time. Experimental results are most often encountered in P-h space and modeling must accommodate this fact. Similarly, in foam indentation, the analysis is most easily conducted in pressure-load space and experiments are best conducted with variations in peak load. Once again, experimental results are most often encountered in P-h space and the modeling here is directed towards determining foam properties using such measurements.
Finally, the model could easily be extended and the analysis applied to other indentation cases. An obvious extension is to alter the contact geometry to conical or pyramidal indenters of different included angle or to spherical indenters of different radii. This extension would address many common experimental configurations (especially that for spherical indenters[Reference Chen, Wang, Bhakhri, Giuliani and Atkinson28–Reference Chen, Wang, Brandon and Atkinson33]) and is experimentally verifiable via alteration to Equation (1). Other extensions include tests of foams of different thickness or different microstructure, especially porosity, ϕ; the first of these is experimentally verifiable via Eq. (7), but the second requires a microstructure-based model of cell crushing. A re-formulation of the model in terms of displacement control would also address many common experimental configurations[Reference Ashby, Palmer, Thouless, Goodman, Howard, Hallam, Murrell, Jones, Sanderson and Ponter8–Reference Bouterf, Maire, Roux, Hild, Bajer, Gouillart and Boller17] and be amenable to macroscopic testing. The mathematical basis of the model could also be re-formulated to use the elements in the series approach used in VEP indentation models[Reference Cook48] by using elastic and fracture elements, or the binomial-based cells in parallel approach advocated in some of the early work,[Reference Ashby, Palmer, Thouless, Goodman, Howard, Hallam, Murrell, Jones, Sanderson and Ponter8] which uses stochastically distributed broken or intact cells.