INTRODUCTION
Marine protected areas (MPAs), in which exploitative activities such as fishing are partly or wholly prohibited, have garnered much attention recently among researchers and marine advocacy groups as a tool for fishery management, protecting biodiversity and ecosystem structure, or preserving unique marine ecosystems (Bohnsack Reference Bohnsack1998; Hastings & Botsford Reference Hastings and Botsford1999; Harmelin Reference Harmelin2000; Beattie et al. Reference Beattie, Sumaila, Christensen and Pauly2002; Blyth-Skyrme et al. Reference Blyth-Skyrme, Kaiser, Hiddink, Edward-Jones and Hart2006; Worm et al. Reference Worm, Barbier, Beaumont, Duffy, Folke, Halpern, Jackson, Lotze, Micheli, Palumbi, Sala, Selkoe, Stachowicz and Watson2007). While MPAs may offer promise for the conservation and management of marine ecosystems and fisheries (Farrow Reference Farrow1996; Sumaila et al. Reference Sumaila, Guénette, Alder and Chuenpagdee2000; Pauly et al. Reference Pauly, Cheristensen, Guenette, Pitcher, Sumaila, Walters, Watson and Zeller2002; Abesamis et al. Reference Abesamis, Alcala and Russ2006a; Stelzenmüller et al. Reference Stelzenmüller, Maynou and Martín2007; Wroblewski et al. Reference Wroblewski, Kryger-Hann, Methven and Haedrich2007), much remains unknown about their actual benefits, and the trade-offs among fishery, biodiversity and ecosystem goals and within the fishery sector (Sumaila & Armstrong Reference Sumaila and Armstrong2006).
Given the current international commitments to establish networks of MPAs, the effects of MPAs must be more fully understood. Ideally this understanding would be based on a thorough knowledge of the empirical effects of MPAs (see Murawski Reference Murawski2000; Halpern Reference Halpern2003; Abesamis et al. Reference Abesamis, Russ and Alcala2006b), however this is, and always will be, far from complete (Willis et al. Reference Willis, Millar, Babcock and Tolimieri2003). Modelling can play an important role in developing understanding of possible MPA effects, and generating guidelines for MPA design, shaping rational expectations and focusing empirical research efforts.
There is an increasing number of modelling studies examining aspects of MPA design and performance, however to date these have predominantly been conducted with single species and single fleet models (see reviews by Guénette et al. Reference Guénette, Lauck and Clark1998; Pelletier & Mahevas Reference Pelletier and Mahévas2005). In the light of the current moves towards an ecosystem approach to management it is desirable spatially explicit ecosystem modelling approaches of MPA effects are used to complement single species models. Ecosystem models can not only take account of the effects of spatial management on multiple species and the resulting trophic interactions, but also allow effects on fishing yields to multiple different fleets and whole ecosystem attributes, such as biodiversity and indicators of ecosystem status, to be calculated. This permits a more detailed examination of the trade-offs between fishery and conservation goals, and trade-offs within the fishery sector, than single species models.
This study uses an Ecospace spatial ecosystem model (Walters et al. Reference Walters, Pauly and Christensen1999; Christensen & Walters Reference Christensen and Walters2004a) parameterized for the East China Sea (ECS) to examine trade-offs between fishery and conservation goals, and within the fishery sector, resulting from existing MPAs within the ECS. The use of Ecospace simulations for quantitative predictions is still in its infancy, therefore in this study we emphasize how this approach can be used to gain a fuller understanding of the effects of MPAs, instead of making accurate quantitative predictions.
METHODS
System overview
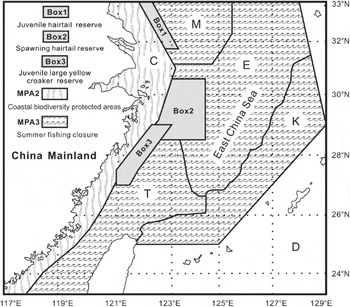
The ECS (Fig. 1) is an epicontinental sea bordered by China, South Korea and Japan. It covers an area of 770 000 km2, of which 65% is a broad continental shelf of < 200 m depth (Zheng et al. Reference Zheng, Chen, Cheng, Wang, Shen, Chen and Li2003). Large quantities of land-based nutrients and pollutants flow into the ECS along with large fresh water inputs, mainly from the Changjiang (Yangtze) river system (Gong et al. Reference Gong, Chen and Liu1996). The confluences of the alongshore current, the Yellow Sea cold water mass and the Kuroshio Current provide rich fishing grounds and support high biodiversity in the ECS (Zheng et al. Reference Zheng, Chen, Cheng, Wang, Shen, Chen and Li2003). In 2002 Chinese landings from the ECS were 6.244 Mt (FAO [Food and Agriculture Organization of the United Nations] 2006), accounting for over 7% of reported global landings and about 42% of marine landings of mainland China. Additionally, in the early 1990s, non-mainland Chinese vessels fishing in the ECS landed approximately 900 000 t yr−1 in Taiwan, 400 000 t yr−1 in the Republic of Korea and 200 000 t yr−1 in Japan (Chen et al. Reference Chen, Zheng, Chen and Mathews1997).
Study area, MPAs and habitats (C: alongshore current; M: ECS and Yellow Sea mixed water; E: ECS offshore water; T: Taiwan current; K: Kuroshio current; D: deep water) as defined in the ECS Ecospace model.

Economic development and population growth in China and peripheral countries over the last several decades has led to intensifying anthropogenic impacts on fishing stocks and biodiversity in the ECS. In response to this, a range of marine management strategies including establishment of a range of spatial management measures have been introduced by the regional and central government of China. The spatial management measures in the ECS range from small no-take zones of a few km2 established for conservation of specific features of interest, through to large seasonal gear restrictions covering several hundred thousand km2 established for large scale fishery management. For the sake of convenience, all these spatial management measures are referred to as MPAs throughout this paper. We selected three large MPAs, or MPA complexes, for simulation, smaller nature reserves and special marine reserves not being included in the simulations. A total of four sets of simulations were run; initially each of the three MPAs was simulated in isolation, then a fourth simulation was run including all three of the MPAs together.
Three offshore fishery boxes (seasonal spatial gear restrictions) were established in the 1980s and for the analyses these are considered together as ‘MPA 1’. The first box (Fig. 1, Box 1) was established in 1981 to protect juvenile hairtail (Trichiurus lepturus) from trawling August–October. The second box (Fig. 1, Box 2) was established in 1988, being closed to trawl and purse seine fleets from May and June to protect spawning hairtail. The third box (Fig. 1, Box 3) was established in 1981, and is closed to trawling during January and February to protect juvenile large yellow croaker (Larimichthys crocea). In total MPA 1 covers 6.5% of the modelled area.
MPA 2 is the shallow water fishing restricted area that covers 12.4% of the modelled area (Fig. 1). The alongshore current area on the ECS continental shelf provides natural spawning grounds for many fishery species with high economical value such as hairtail and large yellow croaker. MPA 2 was set inside the 50 m water depth contour in order to protect coastal fishery resources and spawning grounds (Fig. 1) and west of the boundary line is permanently closed to trawl, light-purse seine and entangling nets.
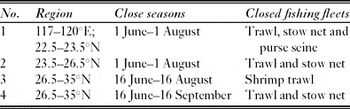
MPA 3 covers 61.6% of the modelled area (Fig. 1). Originally implemented by the Chinese government in 1995, the area between 27° 00′ N and 35° 00′ N is annually closed to trawl and stow net fleets from 1 July to 31 August. In 1998, the location was enlarged to 26° 00′ N–35° 00′ N, and the closure extended to shrimp trawls and prolonged from 16 June to 15 September. In summer 1998, closed fishing area was extended to the South China Sea, the Yellow Sea and Bohai Sea (Yan et al. Reference Yan, Ling, Li, Lin and Cheng2006) (Table 1). It has become generally recognized that the summer fishing closure has led to ecological, economic and social benefits, and is important for sustainable fisheries development in the ECS (Liu & Zhou Reference Liu and Zhou2000; Xu et al. Reference Xu, Liu and Zhou2003; Cheng et al. Reference Cheng, Lin, Ling, Li and Ding2004; Yan et al. Reference Yan, Ling, Li, Lin and Cheng2006).
Summer fishing closure in the ECS and Yellow Sea in 2006.

Modelling
We used an Ecospace model parameterized for the ECS. Ecospace is the spatial and temporal module of the Ecopath with Ecosim (EwE) software package (URL http://www.ecopath.org; Christensen et al. Reference Christensen, Walters and Pauly2005). Ecospace is a biomass-based dynamic model that represents an ecosystem as a two-dimensional grid of cells. The biological components of the ecosystem are defined as functional groups and the overall biomass dynamics of the functional groups controlled by biological rates, trophic relationships and fishing pressure. The dynamics of each functional group in each cell are dependent on feeding and predation rates, any losses to the fishery and movement between cells (Christensen et al. Reference Christensen, Walters and Pauly2005). Different habitats can be defined to occur across the basemap, the spatial distribution of functional groups and fishing fleets being then controlled by associating functional groups and fleets with specific habitats where they are known to occur.
In the model fishing pressure and landings are defined according to ‘fleets’, namely parts of the fishery that have similar characteristics in terms of targeted species and catch composition, frequently classified by gear types. In Ecospace, the time series of effort per fleet per year is a required user input. The spatial distribution of this fishing effort is then controlled by a ‘gravity’ model which allocates effort to each cell proportional to the relative profitability of fishing in each cell. The profitability of fishing in a cell is the product of the biomass, catchability and costs of fishing in each cell. Following MPA establishment, by excluding some, or all, gears from certain cells, the model redistributes fishing effort, rather than reducing it. The gravity model allows Ecospace to replicate realistic features of fishers' behaviour, such as concentration of fishing effort along MPA boundaries, a factor important for accurately predicting the effects of MPA establishment (Kellner et al. Reference Kellner, Tetreault, Gaines and Nisbet2007). For a full description of the EwE software package, see Christensen et al. (Reference Christensen, Walters and Pauly2005) and references within. We used Ecopath with Ecosim version 5.1.
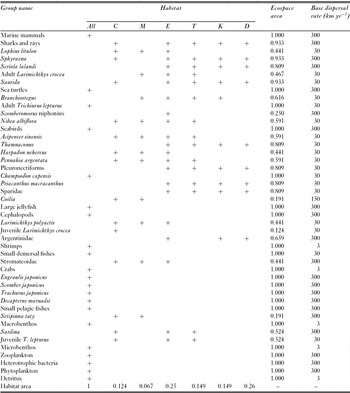
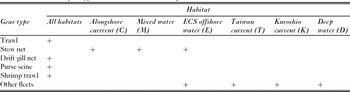
The ECS Ecopath model was composed of 45 functional groups (Table 2), some of them aggregates of several species whereas others represented only one species, or even just a life-stage of a single species. The selection of fish, and some invertebrate groups, was based on abundance and economic importance. Other invertebrate groups were selected due to their importance to fish diets. One heterotrophic bacteria group, one primary producer group (phytoplankton) and one detritus group were also included in the model. Six fleets were defined for the model. Five of them (trawl, stow net, drift gill net, purse seine and shrimp trawl) represent the main fishing fleets from mainland China grouped according to gear type. ‘Other fleets’ was also incorporated to represent landings into Taiwan district and Japan from the ECS (Table 3). The fishery landings by South Korean vessels were not included, as landings from the ECS could not be disaggregated from total fishery landings.
Habitat assignment (C, M, E, T, K and D represent habitat names, details in Fig. 1) and dispersal rate of ECS Ecospace model.

Allocation of gear types to habitats in the ECS Ecospace model.

Five habitats (Fig. 1) were defined in the ECS Ecospace model based on the distribution of water mass, water depth, bed sediment, water temperature, salinity and nutrient level. Functional groups/species preferences were assigned to these habitat types (Table 2) according to 1997–2000 and 1978–1981 fishery survey data (Zheng et al. Reference Zheng, Chen, Cheng, Wang, Shen, Chen and Li2003; Bureau of Aquaculture and the East China Sea Fishery Management Center, Ministry of Agriculture, Stockbreeding and Fishery of People's Republic of China 1987), and five final groups (sea birds, sea turtles, marine mammals, Seriola lalandi and Acipenser sinensis) were assigned to habitats according to fishery and survey records.
The basemap was defined on a 48 × 38 cell grid (latitude 23.5° N–33° N, longitude 117° E–129° E, four cells per degree). Each cell covered approximately 666 km2. Following Zeller and Reinert (Reference Zeller and Reinert2004), base dispersal rates were assumed to be of 3, 30 or 300 km yr−1, representing nondispersing, demersal and pelagic groups, respectively (Table 2). The only modification to this schedule was that the base dispersal rate for Coilia was set at 150 km yr−1, because this group is pelagic and its distribution is constrained to the coastal zone. The relative dispersal rate in non-preferred habitats was assumed to be five times the basic movement rate, and it was further assumed that groups were twice as vulnerable to predation in such habitats than in preferred habitats (Christensen et al. Reference Christensen, Walters and Pauly2005). Individual fishing gear types were allocated to available habitats (Table 3; Cheng et al. Reference Cheng, Zhang, Li, Zhen and Li2006). A full description of the model development and parameterization can be found in Cheng et al. (Reference Cheng, Jiang, Xu, Wu, Ding, Quesne, Arreguín-Sánchez, Quesne, Arreguín-Sánchez and Heymans2007) and Jiang et al. (Reference Jiang, Cheng, Xu, Arreguín-Sánchez, Zetina-Rejon, del Monte-Luna and LeQuesne2008).
MPA simulations
Initially MPA1, MPA2 and MPA3 were simulated individually. A fourth simulation simultaneously including all three MPAs was conducted, the combined MPAs (MPA4) covering 74% of the area that was modelled. A fifth simulation without the inclusion of any MPAs was conducted (no-MPA base run) to examine effects of the MPAs relative to it (see below).
To assess possible effects of the simulated MPAs, we conducted 21-year simulations starting with the ECS Ecospace model of the 1997 baseline. Fishing effort for each of the fleets was held constant during the simulations. For the MPA simulations, the MPA was introduced after the first year to allow the initial biomass distribution to occur in the first year. The results used in the analysis were the biomass and catch for the final year of the simulation. All EwE parameters were retained at default settings unless otherwise specified.
Analysis of results
Rigorous use of Ecospace simulations is still in its infancy. There are currently no established routines for testing and validating the Ecospace outputs against spatial reference data, and time series of forcing functions that can be used to drive Ecosim simulations are currently not incorporated in Ecospace simulations. This has substantial implications for the reliability of quantitative predictions, and the analysis therefore concentrates on qualitative effects of the MPAs relative to MPA 5.
All results are presented as the % change in the specified metrics between MPA5 and the simulation runs for MPA1–4. This concentrates the results on changes predicted to occur from the introduction of an MPA into the system, rather than on absolute predictions of the system status. For example there is no time series forcing function in any of the MPAs (MPA1–5), therefore the relative results highlight the differences between the simulations, rather than the lack of the forcing function. The per cent change was that compared to MPA5, thus a positive result indicates the metric increased as a result of MPA introduction. The results were calculated for the whole system, and for the areas inside and outside the MPA for each simulated scenario.
Changes in the fishery were measured as the change in catch (by weight) and profit. These were calculated for the whole fishery and by fleet. The profit was calculated as the difference between the value of the catch and the cost of fishing.
Although there is no consensus on what constitutes ecosystem overfishing or on what metrics can be used to assess concepts such as ecosystem ‘health’ and ‘integrity’ (Larkin Reference Larkin1996; Murawski Reference Murawski2000), several metrics have been proposed to track aspects of ecosystem functioning that are pertinent to describing the ‘condition’ of an ecosystem, including average trophic level of the catch or the whole system (Rochet & Trenkel Reference Rochet and Trenkel2003), indices of community diversity (Magurran Reference Magurran1988) and Odum's attributes of ecosystem maturity (Odum Reference Odum1971).
We selected three indices of ecosystem status for this study; average trophic level of system and catch, average longevity of the system and Kempton's biomass diversity index (BDI).
The average longevity is the biomass weighted average of the life-expectancy of an organism in the system. It is an index based on one of Odum's indices of ecosystem maturity. The assumption is that a mature ecosystem might contain a greater proportion of long-lived organisms, and thus share a greater index of average longevity (Odum Reference Odum1971). The average longevity of a group can be expressed in terms of the reciprocal of total mortality (Z) (Christensen Reference Christensen1995). Within the Ecopath modelling framework Z is expressed as production/biomass (P/B), the inverse of which (B/P) expresses average longevity (years). The average longevity is calculated according to:

where [B/P]i and Bi are the B/P and biomass of group i respectively. The average longevity was calculated by excluding groups with a trophic level of 1 (primary producers and detritus).
Kempton's Q statistic is a measure of species evenness (Kempton & Taylor Reference Kempton and Taylor1976). What is referred to as Kempton's BDI was developed by Christensen and Walters (Reference Christensen and Walters2004b) to express the relative change in species evenness between a simulation run and a base run, in this case the change in species evenness between MPA5 and MPAs1–4. Kempton's BDI was based upon Kempton's Q index according to:

where Qrun is the Kempton's Q statistic for the simulation of interest (in this case an MPA simulation) and Qbaserun is Kempton's Q for MPA5. A BDI > 1 indicates that there is a more even distribution of species in the MPA simulation than MPA5, and a BDI < 1 indicates a less even distribution.
The average trophic level of system and catch was measured on the basis of the biomass-weighted average trophic level and calculated according to:

where TLi refers to the trophic level and Mi to the catch or biomass of group i.
In all cases, the BDI, mean average longevity and trophic levels were calculated excluding groups with a trophic level < 2 in order to focus the metrics on the upper (exploited) trophic levels in the system. Further discussion of the indicators used can be found in Le Quesne et al. (Reference Le Quesne, Arreguín-Sánchez, Albañez-Lucero, Cheng, Escalona, Daskalov, Ding, Rodríguez, Heymans, Jiang, Lercari, López-Ferreira, López-Rocha, Mackinson, Pinnegar, Polunin, Wu, Xu and Zetina-Rejón2008).
RESULTS
Offshore fishery boxes (MPA1 and MPA2)
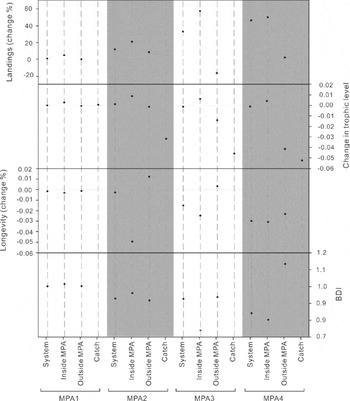
The introduction of the offshore fishery boxes (MPA1) led to a < 0.5% increase in total landings (Fig. 2), although there was a 2.5% increase in landings from the MPA itself. Similarly there was little impact on the whole system ecosystem metrics as a result of MPA1, although there was a slight increase in trophic level and BDI inside the MPA.
Response of fishery and ecosystem metrics to introduction of the MPAs for each of the four MPA simulations. Landings, trophic level and longevity changes are relative to the no-MPA base run. Landings and longevity changes are % differences and trophic level change is the absolute difference. Kempton's BDI is a relative index.

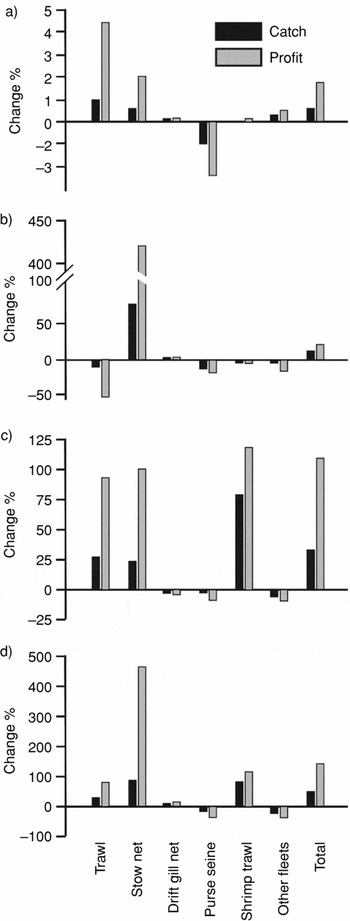
None of the individual fleets showed a more than ± 1% change in total landings or profits as a result of MPA1 (Fig. 3a). All of the fleets showed an increase in landings and profit apart from the drift gill net fleet, where landings and profit declined in response to the introduction of MPA1.
The % change in landings (by weight) and profit for the different fleets between the MPA and no-MPA simulations for (a) MPA1, (b) MPA2, (c) MPA3 and (d) MPA4.

Coastal fishery protected areas (MPA2)
The introduction of MPA2 led to a 4.5% increase in total landings. This was due to a 6.5% increase in landings from the area inside the MPA and a 3% decrease in landings from the area outside the MPA (Fig. 2). There was a slight (c. 0.001) increase in the whole system trophic level which reflected a small (c. 0.01) increase inside the MPA and a smaller decline in the rest of the system. The trophic level of the fishery declined very slightly (0.001) as a result of the introduction of MPA2. The average longevity showed an inverse pattern to the trophic level, with the longevity decreasing across the system and inside the MPA, but increasing outside the MPA. Species evenness declined across the whole system; there was a very slight decrease within the MPA, but an increase outside the MPA.
The landings and profitability of the whole fishery sector increased as a result of MPA2 (Fig. 3b). This was driven by a 45% and 60% increase in catch and profit by the stow net fleet, and a slight (1.46% and 2.10%) increase in catch and profit by drift gill net fleet. The landings and profitability of all the other fleets declined as a result of the coastal fishery protected area.
Summer fishing closure (MPA3)
MPA3 led to a 28% increase in the total landings, comprising a 48% increase in the area covered by the MPA and a 13% decrease in the area outside the seasonal gear closure (Fig. 2). Despite the large increase in landings there was almost no effect on the whole system average trophic level, with the increase in trophic level inside the MPA offset by a decline in trophic level outside the MPA. The trophic level of the catch declined by c. 0.02 as a result of the MPA (Fig. 2). The average longevity of the system and the species evenness declined both across the whole system and inside the MPA as a result of the MPA.
The shrimp trawl fleet gained the greatest benefits from the summer closure with landings and profits increasing by 91% and 98%, respectively (Fig. 3c). The trawl, stow net and purse seine fleets also showed moderate increases in profit (6–13%) owing to the summer closure, while the drift gill net and other fleets suffered slight declines in landings and profits.
Combined MPAs (MPA4)
The combined MPA led to a predicted 36% increase in total landings (Fig. 2), resulting from a 39% increase in landings from within the MPAs, and a 4% increase in landings in the areas outside of the MPAs. Despite this, there was a decrease in the longevity and species evenness of the system. The trophic level of the catch declined by over 0.02 trophic levels, but the overall trophic level of the system was unaffected.
The shrimp trawl fleet showed the greatest benefits of combined introduction of the MPAs, with the landings increasing by 96% and profitability increasing by over 104% (Fig. 3d). The stow net fleet also showed a 55% and 71% increase in landings and profit, respectively. The trawl and drift gill net fleets also benefited from the introduction of the combined MPAs, the purse seine and other fleets suffering a decline in profits as a result of the combined MPAs.
DISCUSSION
In all three cases, the large offshore MPA models predicted that the introduction of the MPAs would benefit the fisheries sector as a whole through an increase in total landings and profitability, although the increase in landings varied from 0.3 to 36% among the different simulations. Furthermore in all cases the increase in total landing reflected increases in landings both inside and outside the MPAs, apart from a decline in landings outside of the large-scale summer closure and inside MPA2. As the ECS is a highly-exploited region (Cheng et al. Reference Cheng, Zhang, Li, Zhen and Li2006) this result is consistent with spatial concentration of fishing effort leading to a reduction in fishing efficiency, and reduction of fishing mortality in an overfished system leading to increased catches (Maury & Gascuel Reference Maury and Gascuel1999; Botsford Reference Botsford2005; Hart Reference Hart2006).
In each case the MPAs benefited the fishery sector as a whole, although the extent of this benefit varied between simulations. The next question is whether this benefit to the fishery came with a simultaneous benefit to the conservation status of the ecosystem, or whether there was an associated conservation cost (Hatcher Reference Hatcher1998)? For each of the ecosystem metrics, it was implicitly assumed that an increase in the value indicates that the system has moved to a more natural less-impacted state. However, previous studies of spatial and temporal changes in such metrics against known gradients in impact have found no indicators even of the qualitative direction of change that consistently appoint to the system moving towards a less impacted state (Rice Reference Rice2000; Rochet & Trenkel Reference Rochet and Trenkel2003; Piet & Jennings Reference Piet and Jennings2005). For example, species evenness metrics can decline if a highly-exploited previously highly abundant species is allowed to return towards its unexploited biomass following a reduction in fishing (Bianchi et al. Reference Bianchi, Gislason, Graham, Hill, Jin, Koranteng, Manickchand-Heileman, Payá, Sainsbury, Sanchez and Zwanenburg2000). This confounds interpretation of the ecosystem metrics; without further specific information it tends to be assumed that the direction of change of an indicator inside an MPA implies the system is moving towards a more natural less-impacted state.
In all instances, the mean trophic level of the community within the MPAs increased (Fig. 2), whereas the whole system response was either a slight increase or decrease in mean trophic level. The changes in system and community mean trophic level were all < 0.04 trophic levels. There is little information on the ecological significance of changes in system trophic levels of this magnitude, however qualitative analysis of the direction of change of the indicators suggests that there was no net impact on the system from MPA1, MPA2 and the combined MPA4 led to a less impacted system and MPA3 led to a small net decline in ecosystem status. The response of the average trophic level of the catch showed a more consistent trend between MPA simulations. MPA1 led to a very small increase in the trophic level of the catch, whereas the other simulations led to predicted declines of 0.001–0.02. The magnitude of these changes can be viewed against 0.2 trophic level decline in global marine catch between the early 1950s and 1994 (Pauly et al. Reference Pauly, Christensen, Dalsgaard, Froese and Torres1998).
Average longevity and species evenness (Kempton's BDI) indicated qualitative system responses of the whole system that were similar to those of the MPAs. For the average longevity, in all instances the whole system response was in the same direction as the within MPA response, apart from MPA1. However, MPA1 had comparatively little effect on community evenness. In general, the metrics of ecosystem status displayed responses inside MPAs that differed from those outside the MPAs.
Using longevity and BDI as indicators of ecosystem response to MPA introduction, the fishery benefits of MPA2, MPA3 and MPA4 came at no cost to the conservation status of the ecosystem, and there was no trade-off between fishery and ecosystem status. The case is less clear with MPA1 as the whole system longevity showed a direction of change opposite to that of the within MPA longevity, but the whole system BDI and within MPA BDI changed in the same direction. However if trophic level of the system is taken as the main measure of ecosystem change, in the case of MPA3 there was a trade-off between the fishery and whole system status. MPA1 led to no net change in system trophic level, and MPA2 and MPA4 led to simultaneous benefits to the fishery and ecosystem status. Where there was a decline in whole system status, contrary to the improvement within MPA status, it appears that the net effect of effort relocation outweighed the benefits from effort reduction within the MPA.
The average trophic level of the community was the only community indicator in this study that showed a consistent response within the MPAs following establishment and in accordance with theoretical expectations. The other indicators measured a variable response of the within MPA community status, with some of the changes contradicting theoretical expectations. This is a conclusion similar to that for a suite of community indices inside and outside the North Sea plaice box before and after its establishment, however the only indicator that gave a consistent response in accordance with theoretical expectations was the slope of the biomass-size spectra; the community trophic level did not respond in accordance with expectations (Piet & Jennings Reference Piet and Jennings2005). Transparent and reliable indicators of the community effects of fishing that can be applied without specific knowledge of the past history of the area have yet to be found. It should also be noted when applying indicators to MPAs that the response of an indicator may be sensitive to the duration of protection as short-lived species with a short generation time are likely to be able to rebuild more rapidly than long-lived slow-growing species. For example, the decline in average longevity within MPAs in this study may merely reflect the simulations being run for only 20 years following MPA establishment. The trajectory that indicators follow in response to MPA establishment or a change in fishing pressure requires further investigation.
Examining the effect of MPA introduction on the fishery sector as a whole masks variability in the costs and benefits associated with the MPA for separate fleets and gears within the fishery (Fig. 3). For all of the MPA simulations conducted in this study there was a net increase in landings and profits as a result of MPAs, however in no cases were there consistent benefits to all fleets. For all fleets the qualitative effect of MPA introduction varied between simulations, apart from the stow net fleet which consistently benefited from all of the MPAs simulated. The potential fishery benefits of MPAs may come at the cost of trade-offs within the fishery sector and could lead to conflict within the fishery sector as a whole. The ecosystem based approach to management aims to take account of human needs from the ecosystem. Where an MPA is introduced to benefit sections of the fishing community, the design of the MPA must take account of which sectors of the fishing community are likely to benefit.
Effects of MPAs may be diverse in direction and magnitude (Halpern & Warner Reference Halpern and Warner2002). Biological responses have consistently increased within the MPAs over time (Russ & Alcala Reference Russ and Alcala1996), shown little change over time (Denny & Babcock Reference Denny and Babcock2004), or risen but then fallen back to original levels (Dufour et al. Reference Dufour, Jouvenel and Galzin1995). MPA effects vary between species and the length of protection (Mosqueira et al. Reference Mosqueira, Côté, Jennings and Reynolds2000). The present simulations indicate that large-scale MPAs across continental shelf waters can lead to benefits for both fisheries and ecosystem conservation status, however an outcome beneficial to all is not guaranteed, and there may be trade-offs between fishery and conservation benefits. Similarly overall benefits to the fishery may come at a cost to specific sectors of the fishing community, and this could lead to conflicts within the fishing community.
CONCLUSION
Although Ecospace alluringly simulates ecosystem dynamics, the quantitative outputs must be considered with caution until routines for formal validation are developed. The choice of base dispersal rates from general species characteristics is difficult to avoid given sparse information on the movement behaviour of species in the study region, although it is likely to have notable effects on the simulation outputs. There are several further ecological factors relating to MPAs that are not included in the present model; the model takes no effect of improvement in habitat quality (Rodwell et al. Reference Rodwell, Barbier, Roberts and McClanahan2003) and, apart from groups considered as multi-age stanza groups, the model takes no account of the variation in the age structure of populations (Roberts et al. Reference Roberts, Hawkins and Gell2005). Despite these limitations and the additional model uncertainty associated with complex models, the use of a complex ecosystem model allows for the analysis of MPA effects on ecosystem attributes that are beyond the scope of single-species simulations and can play a heuristic role in focusing the development of hypotheses that can be tested against empirical data.
ACKNOWLEDGEMENTS
We thank the INCOFISH program of the EU (contract no. 003739) and the Sino-Europe Science and Technology Cooperation Programme of the Ministry of Science and Technology of the People's Republic of China (contract no. 0710) for financial support.