Introduction
The theory of homeorhesis (Bauman and Currie, Reference Bauman and Currie1980; Bauman, Reference Bauman2000) proposes a coordinated response between the hormonal and nutritional environment, that controls partitioning of nutrients between tissues during lactation. Insulin plays an important role in regulating the partitioning of nutrients to the mammary gland (McGuire et al., Reference McGuire, Griinari, Dwyer and Bauman1995; Mackle et al., Reference Mackle, Dwyer, Ingvartsen, Chouinard, Ross and Bauman2000; Bequette et al., Reference Bequette, Kyle, Crompton, Anderson and Hanigan2002). These studies showed that a hyperinsulinaemic euglycaemic clamp (HEC) increased milk protein output in concentrate-fed ruminants, suggesting that amino acid (AA) partitioning to and/or AA utilisation within the mammary gland increased under HEC conditions.
There is evidence that the nutritional status of the animals might also affect their response to insulin (Bequette et al., Reference Bequette, Kyle, Crompton, Anderson and Hanigan2002). This is largely untested in early lactating ruminants fed fresh forage: the few existing studies reported no increase in milk protein concentration or yield in lactating dairy cows (Back et al., Reference Back, Mackenzie, Davis, Harris and Lee2003) and sheep with the HEC alone, or with supplemental protein (Back et al., Reference Back, Mackenzie, Davis and Harris1998). Proportionally more dietary protein was used per unit of milk protein produced in the HEC animals however (Back et al., Reference Back, Mackenzie, Davis and Harris1998 and Reference Back, Mackenzie, Davis, Harris and Lee2003), suggesting a change in nutrient partitioning and/or utilisation in the mammary gland.
A common observation in both concentrate- and grass-fed lactating ruminants is that the HEC decreased circulating AA concentrations (Back, Reference Back2002; Bequette et al., Reference Bequette, Kyle, Crompton, Anderson and Hanigan2002). Despite this, Bequette et al. (Reference Bequette, Kyle, Crompton, Anderson and Hanigan2002) showed, in well fed goats, an increase in mammary blood flow (MBF) and transport activity of essential AA (EAA) with the branched chain AA (BCAA) the most affected, as well as a 38% reduction in mammary leucine oxidation (LO). These data suggest that insulin might exert a differential effect on AA metabolism in the mammary gland, at least in concentrate-fed goats.
As there is limited data available on how insulin affects AA metabolism in the mammary gland in early lactating sheep fed pasture, a HEC was used to assess the effects of insulin on the net flux of AA and leucine kinetics in the mammary gland, and to relate these effects to whole body leucine kinetics in early lactating sheep fed fresh forage. An intravenous infusion of a labelled AA (13C-leucine) was given and arterio–venous (A–V) concentration differences of AA, and 13C-leucine and its metabolites were measured at the whole body level and across the mammary gland.
Material and methods
Animals
All experimental procedures for this trial were reviewed and approved by the Grasslands Animal Ethics Committee, Palmerston North, New Zealand, according to the New Zealand Animals Protection Act 1960 and Animals Protection Regulations 1987 and amendments.
Twelve pregnant 4- and 5-year-old Romney cross sheep underwent surgery under general anaesthesia (3 ml Alfaxan (10 mg/ml alphaxalone) and breathable halothane) around day 70 of gestation, where they were fitted with permanent aortic catheters custom made using the method of Huntington et al. (Reference Huntington, Reynolds and Stroud1989). Ten animals were also fitted with blood flow probes (Transonic Systems Inc., Ithaca, NY, USA) around the pudic artery. The catheter and probe cable were exteriorised through the skin near the hip bone, where they were placed in a waterproof pouch that had been glued and stitched to the skin. The sheep were housed in pens, indoors, for about 6 weeks after surgery to recover, and then returned to pasture until lambing. To protect and maintain the position of the pouch, the animals wore a full body stocking made from elastic netting (Setonet; Seaton Healthcare Group Plc, Oldham, UK). Care after surgery included antibiotic injections (Bomacillin LA, procaine penicillin 150 g/ml and benzathine penicillin 112.5 mg/ml) for 3 days and daily rectal temperature monitoring. Sutures were removed 10 days after surgery and there were no complications. The catheters were flushed weekly with heparinised saline (200 IU/ml; New Zealand Pharmaceuticals, Palmerston North, New Zealand) and antibiotics to maintain patency. The stitching and glue on the pouches containing the probe cable and aortic catheter were also checked weekly and replaced when necessary, and the flow probes were checked weekly to ensure they were working.
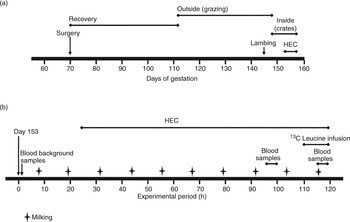
Three days after lambing, the lambs were removed and the sheep housed individually indoors in metabolism crates and fed fresh perennial ryegrass (Lolium perenne)/white clover (Trifolium repens) pasture, sufficient for ad-libitum intake, during the 3 day pre-experimental and 4 day experimental periods. This timeline is shown in Figure 1(a).
Timeline diagram showing major trial events. (a) shows the overall trial timeline and (b) is an expanded view of days 153 to 158 around the experimental period.

Animals were offered approximately 3 kg dry matter (DM) per animal per day of pasture, cut daily, stored in a chiller at 4°C until fed, and offered every 6 h at 1200, 1800, 0000 and 0600 h, with water available ad libitum. Refusals from each feed were collected, bulked, weighed and sampled for analysis. DM was measured on both feed offered and feed refused, and daily DM intake calculated. Sheep were machine milked at 0730 and 1930 h, after administration of oxytocin (1 IU/animal, Oxytocin V; Vetpharm, Auckland, New Zealand) via a jugular catheter to stimulate milk let down.
Four jugular catheters (two in each side) and a subcutaneous abdominal vein catheter (1.2 mm outer diameter (OD) × 0.8 mm inner diameter (ID) single-lumen polyvinylchloride tubing; Critchley Electrical Products Pty Ltd, Auburn, NSW, Australia) were implanted under local anaesthesia (Lignocaine hydrochloride USP 20 mg/ml; Ethical Agents Ltd, Auckland, New Zealand) 2 days before the HEC. One catheter in the right jugular vein was used for the constant insulin infusion and the other for infusing the variable amount of glucose during the HEC. One catheter in the left jugular vein was used for monitoring blood glucose and the other for the 13C-leucine infusion.
Design and treatments
The experiment was run as a single infusion period, with animals blocked on lambing date to ensure the experimental period was within 3 weeks after lambing. The 12 sheep were allocated to two treatment groups (± insulin) in a randomised block design and subjected to a HEC for 4 days. Animals were blocked in groups of four (two with insulin and two without insulin) so that infusions began 7 to 10 days after lambing. Insulin from bovine pancreas (1 μg/kg body weight0·75 per hour; about 1.2 μg/ml; Sigma Chemicals, St Louis, MO, USA) was infused into the jugular vein in sterile filtered 5 g/l bovine serum albumin (BSA; ICPbio Ltd, Auckland, New Zealand). The animals’ blood glucose concentrations were monitored using an Advantage blood glucose meter (Boehringer Mannheim Ltd, Auckland, New Zealand). This allowed determination of blood glucose concentrations within 2 min of adjusting the glucose infusion rate via variable speed pumps, to maintain euglycaemia during the insulin infusion. The glucose solution was 300 g/l food grade dextrose monohydrate (Pure Chem Co. Ltd, Bangkok, Thailand) and was autoclaved before use. Control sheep were infused with an equal volume of the BSA solution.
Infusion and sampling
On the day before starting the HEC, background blood samples were taken at 1200 and 1400 h. On the 4th day of the HEC, l-[1-13C] leucine (99 AP; MassTrace, Woburn, MA, USA) was infused into all animals via the jugular vein, from 0230 until 1100 h as a primed (equivalent to 26.5 min of infusion) constant infusion (2.5 mg/ml, 0.74 ml/min). Leucine was chosen because of the large (up to 64%) decrease in circulating concentration seen during earlier HEC studies (Griinari et al., Reference Griinari, McGuire, Dwyer, Bauman, Barbano and House1997; Mackle et al., Reference Mackle, Dwyer, Ingvartsen, Chouinard, Ross and Bauman2000; Bequette et al., Reference Bequette, Kyle, Crompton, Buchan and Hannigan2001) and because its metabolism is known to be regulated by insulin. Five minutes before each blood sample collection began, the animals were primed with 1 ml of 1000 IU/ml sodium heparin in sterile saline to prevent blood clotting in the sampling lines. On day 4 of the HEC, blood samples were collected (continuously on ice) for 45 min from the aortic artery (A) and the subcutaneous abdominal vein (V) during the afternoon feeding period starting at 1200, 1400 and 1600 h, and during the final feeding period the next morning at 0730, 0900 and 1030 h. This experimental period timeline is shown in Figure 1(b).
By the beginning of the HEC, only six of the ten implanted flow probes (three from each treatment group) were still providing useful data. These were used to compare blood flow estimates by probe with that calculated using the Fick principle. MBF in six sheep (three from each treatment) was measured every day of the HEC, with transit time ultrasonic blood flow probes, during the A and V blood collections. Each measurement was for 2 min on alternate animals, so that over the three 45 min collections in each blood sampling period, each animal had twenty, 2 min measurements. These were averaged and the daily blood flow for that half of the udder calculated. This flow was adjusted to the whole gland by correcting by a ratio of the milk production from each half of the gland over 1 h. It was assumed that the venous blood sample was representative of blood from both sides of the gland.
Analytical methods
Daily feed and refusal samples were analysed for CP and metabolisable energy by near-infrared spectroscopy using a model 6500 NIR (NIR Systems Inc., Silver Spring, MD, USA) with software by Infrasoft International (version 3.1; State College, PA, USA) calibrated for pasture.
Milk was weighed at each milking and a sample stored at −20°C for analysis. A second sample was centrifuged (1000 × g, 15 min, 4°C) and the skim milk frozen at −85°C until analysed for individual milk proteins using a nephelometric assay (Collin et al., Reference Collin, Prosser, Mclaren, Thomson and Malcom2002). Milk composition was determined by near-infrared spectroscopy in transmission mode with Infrasoft International software calibrated for sheep milk. Milk AA composition (excluding methionine) was determined in freeze-dried skim milk samples after HCl hydrolysis (Association of Official Analytical Chemists (AOAC), 1990) using post column derivatisation with ninhydrin (PCX 3100 Post Column Reaction Module; Pickering Laboratories, Mountain View, CA, USA), and a Shimadzu LC10Ai HPLC system (Shimadzu Scientific Instruments Ltd, Columbia, MD, USA). Methionine concentrations were determined on samples oxidised with performic acid, before acid hydroysis (AOAC, 1990), using the same analytical system.
Plasma cysteine concentrations were determined by a modified automated method using acid ninhydrin (Gaitonde, Reference Gaitonde1967). Samples were prepared by taking 1 ml of blood, adding 0.5 ml 300 g/kg trichloroacetic acid, centrifuging (3270 × g, 15 min, 4°C), filtering the supernatant through a 0.45 μm cellulose acetate syringe filter, and storing at −85°C until analysed. The remaining blood was centrifuged (3270 × g, 15 min, 4°C) and the plasma harvested and stored at −85°C. AA concentrations (excluding cysteine) were measured on 0.5 ml plasma samples mixed with 25 μl of 3 mmol/l norleucine as an internal standard, and 25 μl of 80 mmol/l dithiothreitol in 0.2 mol/l Na2PO4 buffer (pH 8.0). This was ultrafiltered (Centrisart, 10 000 molecular weight cut off; Sartorius AG, Gottingen, Germany) and the ultrafiltrate stored at −85°C until analysed by reverse phase HPLC on a Shimadzu LC10A with a Waters PicoTag column (3.9×300mm; Millipore Corporation, Waters Chromatography Division, Milford, MA, USA) using the method of Bidlingmeyer et al. (Reference Bidlingmeyer, Cohen and Tarvin1984). AAs are grouped as EAA and non-EAA (NEAA).
To measure the concentration and isotopic enrichment (IE) of leucine and keto isocaproic acid (KIC), 0.1 ml of 1 mmol/l α-keto n-caproic acid was added as internal standard to 1 ml plasma, mixed and 0.5 ml of 0.79 mol/l sulfosalicylic acid added to precipitate the protein. The sample was centrifuged at 12 000 × g for 5 min and the supernatant separated into leucine and KIC fractions on an SCX (H+) ion exchange column. Both fractions were derivatised using N, O-+-B and the derivatised leucine (ions of mass 302.2 and 303.2) and KIC (ions of mass 259.1 and 260.1) peaks monitored (Bequette et al., Reference Bequette, Metcalf, Wray-Cahen, Backwell, Sutton, Lomax, MacRae and Lobley1996a). Analysis of both fractions was done on a Shimadzu GC-17A gas chromatograph (GC) with a Shimadzu QP5050A MS detector. One μl of sample was injected, with a 1 : 20 split ratio, using helium as the carrier gas and the column was a DB-5MS (ID 0.25 mm, film thickness 25 μm, 30 m length; J&W Scientific (now part of Agilent Technologies), Santa Clara, CA, USA). Results are presented as moles percent excess with respect to the pre-infusion natural abundance of 13C in plasma leucine and KIC. The KIC concentration was determined from the gas chromatographic and mass spectrometric peak areas, corrected for the known addition of the standard.
Plasma insulin concentrations were measured on arterial samples using a double antibody radioimmunoassay (Flux et al., Reference Flux, Mackenzie and Wilson1984). Intra- and inter-assay coefficients of variation (CV) were 8.7% and 12.9%, respectively, and the mean sensitivity was 22.7 pg insulin/ml.
Plasma glucose, β-hydroxybutyrate and triacylglyerol concentrations were measured on A and V samples by enzymatic colorimetric methods adapted for a Cobas Fara II autoanalyser (Hoffman-La Roche Ltd, Basel, Switzerland). Glucose was measured using the method of Trinder (Reference Trinder1969). The β-hydroxybutyrate method was based on that of Williamson and Mellanby (Reference Williamson and Mellanby1974) with intra- and inter-assay CV being 4.7% and 2.1%, respectively. The triacylglycerol method was based on that of Fossati and Prencipe (Reference Fossati and Prencipe1982) and the intra- and inter-assay CV were 2.4% and 2.7%, respectively.
Plasma concentrations of acetic, propionic and butyric acids were measured in A and V samples. Two ml of 0.6 mol/l HClO4 was added to 1 ml of blood to precipitate the protein, and centrifuged (3270 × g, 15 min, 4°C). The supernatant was neutralised using 300 μl of 3 mol/l KOH and placed on ice for 15 min to allow the KClO4 to precipitate. The supernatant was poured off and stored at −85°C until analysed. Immediately before analysis, 1 ml of supernatant was acidified with 10 μl of 7.3 mol/l H3PO4 and centrifuged (9500 × g, 10 min). The sample was analysed on a Shimadzu GC with an acidified polyethylene glycol column (DB-FFAP, ID 0.53 mm, 30 m length; J&W Scientific). One μl was injected with a 1 : 5 split in carrier gas (helium, 1 ml/min mixed with air, 400 ml/min) at an initial temperature of 100°C. After 5 min, the temperature was increased by 10°C/min until it reached 250°C, where it was held for 12 min. Detection was done by flame ionisation.
To monitor animal stress levels, urinary cortisol and creatinine concentrations were determined on samples collected directly after the morning milking. Cortisol was measured using a competitive enzyme immunoassay developed by Munro and Stabenfeldt (Reference Munro and Stabenfeldt1985). The assay was validated for ovine urine by demonstrating (i) parallelism between serial dilutions of ovine urine and the standard curve, and (ii) recovery of cortisol added to ovine urine. The creatinine concentration of each urine sample (diluted 1 : 10 in saline) was determined using a Hitachi 717 auto analyser (Hitachi High-Technologies Corporation, Tokyo, Japan) and a Roche Diagnostics test (Jaffe method; Roche package insert, 1997). To control for variations in urine volume, cortisol concentrations were corrected for creatinine and are expressed as ng cortisol/mg creatinine.
Calculations
Mammary blood flow was calculated for all sheep on day 4 of the HEC, based on the method of Davis et al. (Reference Davis, Collier, McNamara, Head, Croom and Wilcox1988), using AA A–V concentration difference and the Fick principle:

AA output in milk was calculated assuming 84% of ovine milk protein is synthesised in the mammary gland (Davis and Bickerstaffe, Reference Davis and Bickerstaffe1978).
The IE of leucine was calculated using the formula:
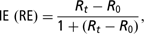
where R is the ratio of the abundance of the 13C enriched fragment to the unlabelled molecule. Subscript t indicates the ratio at time t and subscript 0 is the background ratio from arterial samples before infusion. RE is relative enrichment. If the infusate is >99% enriched, then RE is equivalent to moles percent excess (MPE) (Bequette et al., Reference Bequette, Backwell, Calder, Metcalf, Beever, MacRae and Lobley1997).
Leucine whole body irreversible loss rate (ILR) was calculated with arterial leucine as the precursor pool (MPEALeu) using the following formula:

where 0.99 is the infusate enrichment ratio.
Leucine ILR was converted from mmol/h to g/day by

where 131.17 is the molecular weight of leucine.
The equivalent daily protein flux (protein synthesis plus oxidation; g protein/day) is the protein equivalent of the ILR and an estimate of the minimum whole body protein synthesis. Protein flux was calculated as:

where 0.0669 is the ratio of leucine to whole body protein ILR (66.9 g of leucine/kg protein ILR; Bequette et al., Reference Bequette, Backwell, MacRae, Lobley, Crompton, Metcalf and Lomax1996b).
Leucine partitioning ratio to the mammary gland (gross net uptake : whole body flux) was calculated as:

where L A and L V are arterial and venous concentrations of leucine, and E LA and E LV are their IE (Bequette et al., Reference Bequette, Metcalf, Wray-Cahen, Backwell, Sutton, Lomax, MacRae and Lobley1996a).
Net uptakes for leucine and KIC by the mammary gland were calculated as:

The equations used for net leucine retention, leucine for protein synthesis and LO in the mammary gland, are from the model used for the sheep hind limb by Harris et al. (Reference Harris, Skene, Buchan, Milne, Calder, Anderson, Connell and Lobley1992). Net leucine retention (mmol/h) was calculated as the difference between L A and L V corrected for changes in net output of KIC to CO2.
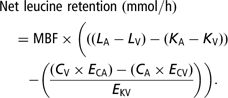
Here, K is the A and V concentration (mmol/l) of KIC in plasma and C is the A and V concentration (mmol/l) of CO2 in the blood. E is the enrichment of the metabolites above background. E KV is the enrichment of KIC in V and was taken as the most representative IE at the site of branch chain 2-oxo-acid dehydrogenase in the tissues.
Leucine available for protein synthesis was calculated as:
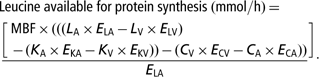
Different pools label to different extents, so the calculated protein synthesis values depend on which pool is chosen. In these calculations, the IE of arterial leucine (E LA in the denominator) was used as most representative of the true precursor (the appropriate aminoacyl-t-RNA) (Harris et al., Reference Harris, Skene, Buchan, Milne, Calder, Anderson, Connell and Lobley1992).
Leucine oxidation was calculated using the equation:

Total mammary gland protein synthesis (MPS) was estimated using the equation:
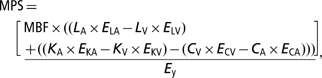
where E y is the enrichment of either leucine or KIC in V plasma (Bequette et al., Reference Bequette, Backwell, MacRae, Lobley, Crompton, Metcalf and Lomax1996b).
Statistical analysis
The data were analysed as a randomised block design. Preliminary analysis on block one data showed there were no significant differences in AA concentrations between the two feeding periods, so only the samples from the final feeding period were analysed for blocks two and three. As the sheep were blocked according to lambing date, analyses included HEC as a fixed treatment effect with block as a random effect and time as a repeated factor. Analyses were performed using the GLM procedure from the Statistical Analysis Systems (SAS, 1988) statistical package. The model used for the analyses was:

where μ is the mean, αi is the fixed effect due to the treatment i, βj is the fixed effect due to the period j, δk is the random effect due to the group k, π(l)k is the l th sheep in group k, and εijkl is the error term. A covariate was added for intakes to correct for pre-experimental period differences between groups. All treatment and period effects and their interactions were tested, and probability values were generated to compare treatments. Normality of the data was tested by plotting the standardised residuals against the standardised predicted values. No plots showed a pattern indicating that the normality assumption of the ANOVA model should be questioned. Results are shown as least squares means ± s.e. and differences were considered significant at P < 0.05, and a trend if 0.05 < P < 0.1.
Results
Plasma insulin concentrations in the HEC and control sheep were similar before the start of the insulin infusion (HEC 185; Control 154 ± 20 pg/ml). On day 4 of the HEC, plasma insulin concentrations had increased (P < 0.001) in the HEC sheep (399 ± 20 pg/ml) compared to the control sheep (179 ± 20 pg/ml). While the amount of glucose infused to maintain euglycaemia increased from day 1 to day 4 of the HEC, this increase was not significant (day 1, 4.9; day 4, 5.7 ± 0.4 g/h).
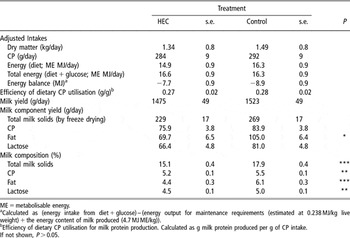
Intake data are presented in Table 1. These were adjusted with a covariate determined from the average of intakes for the 2 days preceding the HEC. There were no differences in any adjusted intakes between the insulin-treated and control sheep on day 4 of the HEC.
Adjusted intakes, milk yields and milk composition on day 4 of the hyperinsulinaemic euglycaemic clamp (HEC) for HEC (n = 6) and control (n = 6) sheep

ME = metabolisable energy.
aCalculated as (energy intake from diet + glucose) – (energy output for maintenance requirements (estimated at 0.238 MJ/kg live weight) + the energy content of milk produced (4.7 MJ ME/kg)).
bEfficiency of dietary CP utilisation for milk protein production. Calculated as g milk protein produced per g of CP intake.
If not shown, P > 0.05.
On the 2 days before the HEC, yields of milk and milk components were higher for the control than for the HEC animals. As there was no change in milk yield in both groups during the HEC, the average of these 2 days was used as a covariate for each component; the adjusted data are presented in Table 1. There were no differences in the adjusted yields of milk, CP or lactose. Milk fat yield, however, was lower in the HEC sheep (P < 0.05). Percentage composition of total milk solids, CP, lactose and fat were lower (P < 0.01) in the HEC sheep on day 4 of the HEC (Table 1). The HEC had no effect on the concentrations (g/l) of β-casein (28.9 ± 1.9), β-lactoglobulin (6.9 ± 0.6), κ-casein (0.9 ± 0.07) and immunoglobulins (4 ± 0.3) in skim milk on day 4 of the HEC.
For acetic acid, there were no differences between HEC and control animals in arterial concentrations (HEC 2.4; Control 2.0 ± 0.3 mmol/l), A–V difference (HEC 1.8; Control 1.3 ± 0.3 mmol/l) or percentage extraction efficiency (HEC 61; Control 52 ± 4) on day 4 of the HEC. Similarly, there were no differences for triacylglycerol in arterial concentrations (HEC 0.15; Control 0.17 ± 0.01 mmol/l), A–V difference (HEC 0.003; Control 0.015 ± 0.01 mmol/l) or percentage extraction efficiency (HEC 2; Control 5 ± 8). Not enough samples had measurable amounts of propionic or butyric acid to allow statistical analysis. The β-hydroxybutyrate arterial concentration (HEC 0.48; Control 0.72 ± 0.03 mmol/l), A–V difference (HEC 0.22; Control 0.37 ± 0.02 mmol/l) and percentage extraction efficiency (HEC 44; Control 51 ± 2) were reduced (P < 0.05) in the HEC group.
Creatinine and cortisol concentrations were measured in urine samples on each of the 4 days of the HEC and there were no treatment effects. On day 4, creatinine concentrations were 0.13 ± 0.03 mg/ml in the HEC sheep and 0.15 ± 0.03 mg/ml in the controls. Cortisol concentrations were similar between treatments (HEC 221 ± 76; Control 289 ± 76 ng cortisol/mg creatinine).
For the three animals from each group with working flow probes during the HEC, there was no significant difference in MBFs on day 4 of the HEC (HEC 714; Control 712 ml/min ± 167) using the flow probe measurement. Similarly, there were no differences in MBF, using the Fick principle, on day 4 of the HEC with methionine (HEC 743; Control 713 ± 167 ml/min) or with phenylalanine + tyrosine (HEC 1007; Control 810 ± 167 ml/min). The regression equations were Blood flow (ml/min) = 1.22 × flow probe – 142.2 (R 2 = 0.64) for methionine v. flow probe and Blood flow (ml/min) = 1.21 × flow probe + 47.5 (R 2 = 0.53) for phenylalanine + tyrosine v. flow probe.
Using all animals (HEC = 6; Control = 6), there was no difference in MBF on day 4 of the HEC, using the Fick principle, with methionine (HEC 633 ± 51; Control 692 ± 48 ml/min), or in the ratio of MBF to milk yield (HEC 562 ± 39; Control 605 ± 34).
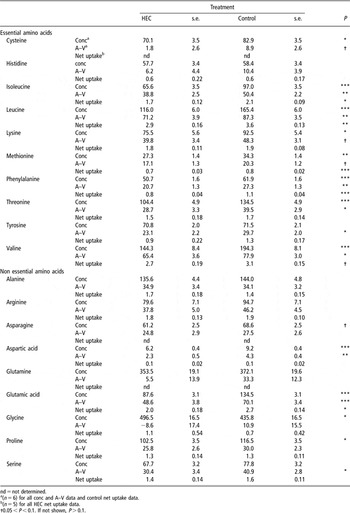
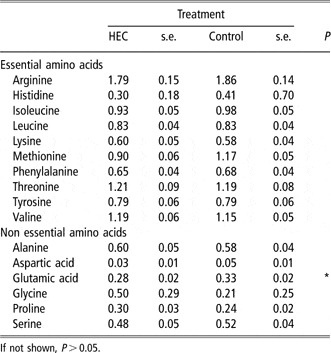
Amino acid plasma arterial concentrations, A–V differences and net uptake data are presented in Table 2. There were no differences between the HEC and control sheep in plasma AA concentrations measured on the pre-infusion day (data not shown). With the exceptions of histidine and tyrosine, the arterial concentrations of all EAA were lower (P < 0.05) in the HEC sheep on day 4 of the HEC. The concentrations of the BCAA (leucine, isoleucine and valine) decreased by 29% and the remaining EAA (excluding histidine and tyrosine) by 18%. The concentrations of the NEAA were 13% lower in the HEC sheep, with aspartic acid, glutamic acid and proline significant (P < 0.05) and asparagine showing a similar trend (P < 0.10). Plasma glycine concentrations, however, were 14% higher (P < 0.05) in the HEC animals. The HEC decreased (P < 0.05) the A–V differences of phenylalanine, threonine and tyrosine and the BCAA by 22%, with a similar trend for cysteine, lysine and methionine. From the NEAA, the HEC decreased (P < 0.05) the A–V differences for aspartic acid, glutamic acid and serine. Net mammary uptake of isoleucine and leucine was increased (P < 0.05) with a similar trend for valine, the BCAA increasing by 17%. Net methionine and phenylalanine uptakes also decreased by 22% (P < 0.001). From the NEAA, only glutamic acid had a different extraction efficiency (P < 0.05); 25% lower for the HEC animals on day 4 of the clamp. The ratio of the mammary net uptake of AA to the AA secreted in milk protein is shown in Table 3. Except for glutamic acid, which was lower in the HEC sheep (P < 0.05), there were no treatment differences in these ratios for EAA and NEAA.
Plasma arterial concentration (conc; μmol/l), arterial–venous difference (A–V; μmol/l) and net uptake (mmol/h) for amino acids on day 4 of the hyperinsulinaemic euglycaemic clamp (HEC) for HEC and control sheep

nd = not determined.
a(n = 6) for all conc and A–V data and control net uptake data.
b(n = 5) for all HEC net uptake data.
†0.05 < P < 0.1. If not shown, P > 0.1.
Ratio of mammary amino acid (AA) net uptake: AA secreted in milk protein during day 4 of the hyperinsulinaemic euglycaemic clamp (HEC) for HEC and control sheep

If not shown, P > 0.05.
Glucose A–V difference (HEC 0.81; Control 0.95 ± 0.4 mmol/l) and glucose extraction efficiency (HEC 23%; Control 27 ± 1%) were lower (P < 0.05) in the HEC animals. There were no differences in arterial plasma glucose concentrations, mammary gland glucose net uptake or lactose output.
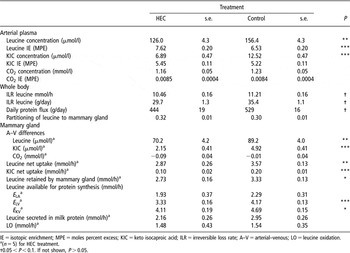
Whole body leucine ILR was calculated using arterial leucine as the precursor pool and is shown in Table 4. Mammary gland leucine concentrations, IE and kinetics calculations are shown in Table 4. On day 4 of the HEC the arterial concentrations of leucine and KIC were lower (P < 0.01) for the HEC sheep. The IE of arterial leucine was higher (P < 0.001) in the HEC sheep, but there was no difference in IE for KIC and CO2 or CO2 concentration. Leucine and KIC A–V differences across the mammary gland, net mammary uptakes of leucine and KIC and the amount of leucine retained in the mammary gland were lower (P < 0.05) in the HEC sheep.
Comparison of isotopic enrichments and leucine kinetics in the mammary gland on day 4 of the hyperinsulinaemic euglycaemic clamp (HEC) between HEC and control sheep

IE = isotopic enrichment; MPE = moles percent excess; KIC = keto isocaproic acid; ILR = irreversible loss rate; A–V = arterial–venous; LO = leucine oxidation.
a(n = 5) for HEC treatment.
†0.05 < P < 0.1. If not shown, P > 0.05.
There was a trend (P < 0.1) for the whole body ILR to be lower in the HEC sheep compared to the controls. There were no differences between the HEC and control sheep in leucine partitioned to the mammary gland, secreted in milk protein or used for oxidation. Mammary gland leucine available for protein synthesis was lower (P < 0.05) in the HEC animals when calculated using V leucine or KIC as precursor pools, but this was not the case if arterial leucine was used.
Discussion
In this study, the HEC did not increase milk protein output in pasture-fed sheep in early lactation. This is consistent with earlier experiments in pasture-fed sheep (Back et al., Reference Back, Mackenzie, Davis and Harris1998) but contrasts with the studies of McGuire et al. (Reference McGuire, Griinari, Dwyer and Bauman1995) and Mackle et al. (Reference Mackle, Dwyer, Ingvartsen, Chouinard, Ross and Bauman2000) with concentrate-fed cows, and (Bequette et al., Reference Bequette, Kyle, Crompton, Buchan and Hannigan2001) with goats, where there was a significant increase in milk protein output in response to the HEC. The intravenous insulin infusion in this study only doubled arterial plasma insulin concentrations, and this could explain the difference between this study and the concentrate-fed cow and goat studies, where the range of increases in insulin concentrations were 3.3- to 4-fold. The lower insulin concentrations in this study may reflect a higher whole body insulin clearance rate and/or lower insulin production in early lactation (Lucy, Reference Lucy2004). In this study, the sheep were in early lactation (between 10 and 20 days post partum), whereas the cows (McGuire et al., Reference McGuire, Griinari, Dwyer and Bauman1995; Griinari et al., Reference Griinari, McGuire, Dwyer, Bauman, Barbano and House1997; Mackle et al., Reference Mackle, Dwyer, Ingvartsen, Chouinard, Ross and Bauman2000) and goats (Bequette et al., Reference Bequette, Kyle, Crompton, Buchan and Hannigan2001) in earlier studies were in mid lactation, the cows ranging from 127 to 232 days and the goats, 142 ± 20 days post partum.
The lower increase in plasma insulin concentration in this study may have affected the DM intake and AA utilisation responses to the HEC. Supporting this, there was no increase in exogenous glucose use (as measured by the glucose infusion rate) over the 4 days of the HEC and no effect on DM intake. While exogenous insulin decreases feed intake (Deetz and Wangsness, Reference Deetz and Wangsness1981), the data from Back et al. (Reference Back, Mackenzie, Davis and Harris1998) indicates that this effect is more pronounced when there is a larger increase in insulin concentration and glucose use. As a result of feed intake (and hence CP intake) not changing in this study, there was no change in the efficiency of dietary CP utilisation for milk protein production, contrasting with Back et al. (Reference Back, Mackenzie, Davis and Harris1998), where the DM intake of early lactating sheep differed (HEC 0.97; Control 1.21 ± 0.02 kg/day; P < 0.001).
Milk-fat concentration and yield were reduced in the HEC sheep compared to the controls. The HEC reduced the arterial concentration of β-hydroxybutyrate but not acetic acid in the HEC sheep, as would be expected if the HEC affected ketone body production, as demonstrated by Brockman (Reference Brockman1993). Although milk fatty acid (FA) composition was not determined, the net uptake of acetic acid and β-hydroxybutyrate has accounted for 81% of short and medium chain FAs synthesised de novo by the sheep mammary gland (King et al., Reference King, Gooden and Annison1985). In addition, although β-hydroxybutyrate is considered a relatively minor milk fat precursor, contributing less than 10% by weight to milk FAs, it may initiate approximately half of the C4 to C12 FAs synthesised in the mammary gland (Davis and Collier, Reference Davis and Collier1985). The total weight percent of C4 to C12 FAs in sheep is 24% compared to 12% for cows (Fox and McSweeney, Reference Fox and McSweeney1998), possibly indicating a larger role for β-hydroxybutyrate in sheep. A decrease in the supply of β-hydroxybutyrate might, therefore, be expected to affect milk fat composition and yield.
The apparent lack of triacylglycerol (TAG) uptake in this study is puzzling, as TAG is essential to supply the C18 FA component in milk. Bequette et al. (Reference Bequette, Kyle, Crompton, Buchan and Hannigan2001) reported that, in goats, total FA yield (g/day FA) decreased during a HEC by 31%, with C18 FA down 51%, and the yield of C8 to C17 down by only 18%. The percentage of C18 FA to total fell from 40% in the controls to 28% in the HEC. As we did not measure FA composition in this study, we do not know if this changed in our study during the HEC, but it seems likely. Even with the very small TAG uptakes reported here, there are enough total fat precursors (acetic acid, β-hydroxybutyrate and TAG) to account for all of the milk fat secreted in the control animals and most of that in the HEC, particularly given the high variability in the TAG uptake data. It is also possible that heparin reduced the reliability of our assay, as it can remove the enzyme lipoprotein lipase from the capillary endothelium, preventing the hydrolysis and net uptake of blood triacylglycerols by the mammary gland. This enzyme’s activity is higher during early lactation (Azzara and Dimick, Reference Azzara and Dimick1989). The data presented here, however, shows no discernible pattern of lower milk fat concentration or yield after administration of heparin for blood collection, and heparin administered to lactating goats did not compromise milk fat production (McCarthy and Coccodrilli, Reference McCarthy and Coccodrilli1975) as there was no difference in milk volume, fat concentration or FA composition. Overall, it would appear that the changes in precursor supply caused by the HEC are the most likely cause of the reduction in milk fat.
There was no increase in MBF in the HEC animals, contrasting with the studies of Mackle et al. (Reference Mackle, Dwyer, Ingvartsen, Chouinard, Ross and Bauman2000) and Bequette et al. (Reference Bequette, Kyle, Crompton, Buchan and Hannigan2001) where MBF increased by 42%. In those studies, however, the HEC had a galactopoietic effect and glucose net uptake increased at a similar rate to the increase in blood flow. In addition, Bequette et al. (Reference Bequette, Kyle, Crompton, Buchan and Hannigan2001) reported that the increase in blood flow paralleled the increase in milk yield and milk protein yield, whereas the increase in milk protein yield seen by Mackle et al. (Reference Mackle, Dwyer, Ingvartsen, Chouinard, Ross and Bauman2000) was proportionally greater. It appears that, under HEC conditions, the galactopoietic effect and increase in blood flow are related, although what regulates this is not known. Prosser et al. (Reference Prosser, Davis, Farr and Lacasse1996) reviewed a number of locally produced vasoactive compounds in the mammary microvasculature, that could potentially regulate MBF. These could provide mechanisms for the mammary gland to control its own blood supply and thereby regulate precursor supply for milk synthesis.
The decrease in arterial concentrations of most EAA during the HEC is consistent with that seen in studies by Mackle et al. (Reference Mackle, Dwyer, Ingvartsen, Chouinard, Ross and Bauman2000), using concentrate-fed cows, and Bequette et al. (Reference Bequette, Kyle, Crompton, Buchan and Hannigan2001), using goats fed hay/concentrate. There is a difference in the amount of the reduction in arterial concentrations, with BCAA concentrations in this study decreasing by 29%, compared to 55% or more in the studies by Mackle et al. (Reference Mackle, Dwyer, Ingvartsen, Chouinard, Ross and Bauman2000) and Bequette et al. (Reference Bequette, Kyle, Crompton, Buchan and Hannigan2001). The other EAA decreased by 18%, similar to the 23% reduction reported by Mackle et al. (Reference Mackle, Dwyer, Ingvartsen, Chouinard, Ross and Bauman2000). The size of this effect may, however, depend on the change in circulating insulin concentration, and in this study, the lower insulin level may explain the smaller decrease in arterial BCAA concentrations. Changes in A–V differences, extraction efficiencies and net uptakes of all AA were similar to those reported by Mackle et al. (Reference Mackle, Dwyer, Ingvartsen, Chouinard, Ross and Bauman2000), except for the BCAA. In this study, the HEC animals showed an increased BCAA extraction efficiency of 17%, contrasting with the results of Mackle et al. (Reference Mackle, Dwyer, Ingvartsen, Chouinard, Ross and Bauman2000) where the increase was 40%.
Increased mammary gland blood flow and AA uptake (A–V) are two ways by which the AA supply for milk protein synthesis could be maintained or increased. In this study, the HEC resulted in a reduction in the net uptake of isoleucine, leucine, methionine, phenylalanine and valine, and there was no increase in MBF to compensate for this. This contrasts with the results of Bequette et al. (Reference Bequette, Kyle, Crompton, Buchan and Hannigan2001) where, although the HEC reduced uptakes of histidine, isoleucine, leucine, valine, lysine, threonine and several NEAA, MBF increased by 42%. As there was no change in MBF in the HEC group, a ratio of AA uptake relative to output in milk protein was calculated (Davis et al., Reference Davis, Bickerstaffe and Hart1978). These ratios show insufficient uptake of histidine, leucine, lysine, phenylalanine, tyrosine (and isoleucine marginally) and all the NEAA to account for their output in milk protein. While it is possible that the shortfall in the EAA could be met by an increase in mammary gland protein degradation, this is not viable long term. The required NEAA can be synthesised in the mammary gland.
It is generally accepted that EAA are taken up in balance or in excess of their output by the mammary gland. Insufficient uptake of isoleucine and leucine seen in this study suggests that the methionine based blood flow calculations may be underestimating the contribution of the plasma free AA to milk protein output, and that plasma flow was underestimated using this method. Some of this apparent deficit could be reduced by the use of alternative sources of AA, such as erythrocytes and peptides, and there is evidence of AA supply from these sources in studies by Bequette et al. (Reference Bequette, Backwell, Kyle, Calder, Buchan, Crompton, France and MacRae1999) and Pacheco-Rios et al. (Reference Pacheco-Rios, Treloar, Lee, Barry and McNabb1999). Pacheco-Rios et al. (Reference Pacheco-Rios, Treloar, Lee, Barry and McNabb1999) demonstrated that AA uptake from plasma was insufficient for milk protein output of histidine, lysine, phenylalanine and tyrosine in pasture-fed cows in early lactation. When blood AA uptake was used instead of plasma, however, the uptakes of lysine, phenylalanine and tyrosine were sufficient to account for the output of these AA in milk protein, and the contribution of erythrocytes was between 5% and 15%. For histidine, there was a deficit in both plasma and blood, and it appears that for this AA, the blood supply may not be the only precursor pool (Pacheco-Rios et al., Reference Pacheco-Rios, Treloar, Lee, Barry and McNabb1999). In lactating goats, Bequette et al. (Reference Bequette, Backwell, Kyle, Calder, Buchan, Crompton, France and MacRae1999) showed that between 5% and 25% of the supply of lysine, methionine, phenylalanine and tyrosine for casein synthesis came from circulating peptides. These may be some of the mechanisms that support milk protein output when precursor supply is insufficient, such as in early lactation or with restricted feed. Errors in estimates of blood flow, due to incompetence of the valves in the external pudic vein (see discussion in Davis et al., Reference Davis, Bickerstaffe and Hart1978), seem unlikely, given the accord between the ‘Fick principle’ and arterial probe measurements. Such incompetence can occur in older animals in dairy breeds of sheep, goats and cattle, leading to contamination of the mammary venous sample with non-mammary blood, but this was not evident in an earlier study of non-dairy sheep (Davis et al., Reference Davis, Bickerstaffe and Hart1978). Contamination would be expected to lead to a substantial overestimation of MBF, using the Fick methodology, by reducing the AA A–V difference (and this would, of course, have no impact on the arterial probe measures).
It appears that insulin altered whole body leucine utilisation (or ILR) in the HEC sheep, suggesting either that leucine available for protein synthesis and/or oxidation was reduced. The BCAA catabolic pathway has a rate-limiting enzyme, the branched chain keto acid dehydrogenase, catalysing deamination of leucine to KIC. The activity of this enzyme in the presence of high insulin concentrations, or low concentrations of BCAA and its intermediates (as in this study: 20% lower leucine and 48% lower KIC), is reduced or inhibited, sparing the BCAA (Block et al., Reference Block, Richmond, Mehard and Buse1987). Despite this, there was no difference in CO2 concentration, suggesting no change in LO.
Insulin did not appear to influence the proportion of the whole body leucine flux partitioned to the mammary gland. The values calculated in this study (about 0.3; Table 4) are similar to those reported in lactating dairy cows (0.40, 0.42; Bequette et al., Reference Bequette, Metcalf, Wray-Cahen, Backwell, Sutton, Lomax, MacRae and Lobley1996a) and in lactating goats (0.20 to 0.30; Bequette et al., Reference Bequette, Backwell, Calder, Metcalf, Beever, MacRae and Lobley1997). Earlier studies (Back, Reference Back2002) showed that milk protein production was maintained in the lactating sheep during a HEC when there was a reduction in CP intake. Many AA that are taken up in excess of requirement by the mammary gland have been shown to be catabolised (Wohlt et al., Reference Wohlt, Clark, Derrig and Davis1977). Although the catabolism of AA fulfils a number of functions, it has not been established whether catabolism occurs in response to excess uptake of AA (passive response) or because the oxidation process is required for milk protein synthesis (regulated response). Leucine net uptake by the mammary gland was not limiting for milk protein synthesis (Table 4). As shown in Table 4, while arterial leucine concentration in the HEC sheep was reduced, net uptake was greater than the net output in milk protein in both HEC and control sheep.
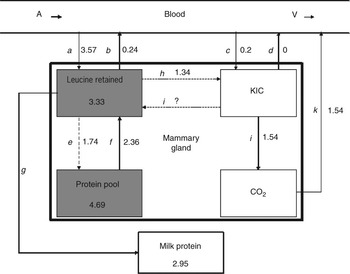
The fate of leucine in the mammary gland was modelled in Figure 2 using the fluxes presented in Table 4. Those fluxes that were not measured were estimated.
Model showing leucine fluxes (mmol/h) in the sheep mammary gland for the control animals. Values with solid arrows were measured, while those with dashed arrows were calculated (or assumed). Grey boxes indicate significant differences between control and hyperinsulinaemic euglycaemic clamp (HEC) sheep. A = arterial; V = venous; KIC = keto isocaproic acid. a = uptake of leucine; b = uptake of leucine – leucine retained; c = uptake of KIC; d = uptake of KIC – KIC retained (not determined and assumed to be 0); e = leucine entering the protein pool in the gland by the difference (gland protein synthesis – milk protein output); f = leucine leaving protein pool in the gland, assuming steady state by the difference (e + (net uptake of leucine – leucine secreted in milk protein )); g = leucine output in milk protein; h = leucine being deaminated to KIC, calculated by the difference (leucine oxidised – KIC net uptake); i = KIC transaminated back to leucine (not determined); j = KIC to CO2; k = CO2 released into subcutaneous abdominal vein blood supply.

Flux f is an estimate of leucine released from the mammary protein pool to the intracellular leucine pool, and calculations showed that an extra 0.62 mmol/h was required from protein degradation. This is approximately 13 g/day of intracellular protein and assuming a 1.5 kg ovine mammary gland containing 20% protein (300 g), this is unsustainable. If the values calculated for MBF based on methionine uptake were underestimated as suggested previously, the corresponding leucine net uptakes would also be underestimated. A 20% underestimate of leucine net uptake (a in Figure 2) would be sufficient to account for the apparent net degradation of the mammary intracellular proteins.
Perhaps the most interesting result is that LO did not decrease in the HEC animals. This is in marked contrast with the only other study of LO in the ruminant mammary gland during a HEC (Bequette et al., Reference Bequette, Kyle, Crompton, Buchan and Hannigan2001), where oxidation was reduced in the HEC animals by 40%. Possible reasons for this are the stage of lactation, negative energy balance and species differences. In this study, the sheep were in early lactation (11 to 14 days post partum), whereas the goats in Bequette et al. (Reference Bequette, Kyle, Crompton, Buchan and Hannigan2001) were in mid-lactation (142 ± 20 days post partum). Mammary LO has been seen to increase with the stage of lactation (Oddy et al., Reference Oddy, Lindsay and Fleet1988) and with protein supplementation (Bequette et al., Reference Bequette, Metcalf, Wray-Cahen, Backwell, Sutton, Lomax, MacRae and Lobley1996a) in goats. Perhaps the goats had the potential to decrease mammary LO, whereas the sheep did not. A negative energy balance alone might be expected to increase AA oxidation (including that of leucine), but the combination of HEC (probable decrease in oxidation) and negative energy balance (probable increase in oxidation) could explain the lack of change in LO in this study.
Although the HEC decreased total protein synthesis in the mammary gland, the ratio of leucine secreted in milk protein : gland protein synthesis was similar between the insulin treated and control sheep (0.65 and 0.71, respectively), suggesting that insulin did not alter the transfer of leucine into milk protein. In addition, MPS being greater than milk leucine output (35% in the insulin treated animals and 29% in the controls), suggests substantial synthesis of proteins other than milk and/or the degradation of synthesised mammary proteins. This is in agreement with Bequette et al. (Reference Bequette, Metcalf, Wray-Cahen, Backwell, Sutton, Lomax, MacRae and Lobley1996a) who reported 20% to 59% greater gland protein synthesis than milk protein output in lactating dairy cows.
Conclusion
This study shows that infusing insulin using the HEC technique in sheep fed fresh forage in early lactation reduced mammary protein synthesis, and this is likely to be related to the decreased plasma EAA concentrations and mammary EAA net uptakes. While the changes in mammary AA fluxes observed in this study did not translate to increased milk protein production in the HEC sheep, the results do demonstrate that the mammary gland was able to maintain milk protein output despite a decrease in arterial AA supply, net AA uptakes and mammary protein synthesis due to the HEC. This supports the theory that the mammary gland has the ability to directly respond to modified precursor supply, although how this occurs remains unclear and deserves further study.
Acknowledgements
Many thanks to Dean Corson, Yvette Cottam, Jason Johnston, Sarah Johnston, Arturo Luque, Willy Martin, David Pacheco, Jason Peters, Gordon Reynolds, Bryan Treloar and Garry Waghorn for their help with animal studies and analyses and to Denise Martin for checking and formatting. This work was funded by the Foundation for Research, Science and Technology, New Zealand (C10627, C10X0227). Penny Back was supported by an AgResearch PhD fellowship.