





The Publisher apologises for omitting an affiliation number for two authors but this has been corrected in the published article.
In addition, the Publisher apologises for the omission of two Appendices from the article. These are given below.
Appendix A
Canonical Correlation Analysis
To further examine whether risk taking and information search are predicted by distinct combinations of variables, we conducted a canonical correlation analysis (CCA) examining the relationships between the set of predictor variables (confidence, empowerment, decisiveness, and openness to information) and the two behavioral outcomes (risk taking and information search).
Method
The analysis was conducted using the yacca package in R with complete cases (n = 997). The first set of variables consisted of confidence, empowerment, decisiveness, and openness to information. The second set consisted of risk taking and information search.
Results
The canonical correlation analysis revealed two significant canonical variates. The first canonical variate had a squared canonical correlation of .045, χ2(8) = 55.60, p < .001. The second canonical variate had a squared canonical correlation of .010, χ2(3) = 10.09, p = .018.
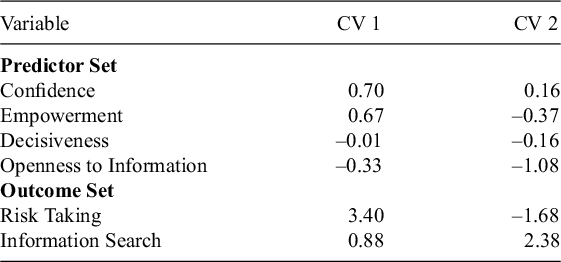
Standardized Canonical Coefficients for Predictor and Outcome Variables

Table A1 Long description
The table consists of three columns: Variable, C V 1, and C V 2. C V stands for Canonical Variate.
Predictor Set:
* Confidence: C V 1 is 0.70, C V 2 is 0.16.
* Empowerment: C V 1 is 0.67, C V 2 is minus 0.37.
* Decisiveness: C V 1 is minus 0.01, C V 2 is minus 0.16.
* Openness to Information: C V 1 is minus 0.33, C V 2 is minus 1.08.
Outcome Set:
* Risk Taking: C V 1 is 3.40, C V 2 is minus 1.68.
* Information Search: C V 1 is 0.88, C V 2 is 2.38.
Note. CV = Canonical Variate.
Interpretation
The pattern of canonical coefficients reveals distinct predictive relationships for our two behavioral outcomes:
-
1. First Canonical Variate: This variate primarily captures the relationship between confidence/empowerment and risk taking. High loadings for confidence (0.70) and empowerment (0.67) on the predictor side correspond with a strong loading for risk taking (3.40) on the outcome side, while information search shows a weaker loading (0.88).
-
2. Second Canonical Variate: This variate primarily captures the relationship between openness to information and information search. Openness to information shows the strongest loading(-1.08) on the predictor side, corresponding with a strong loading for information search (2.38) on the outcome side, while risk taking shows a negative loading (-1.68).
These findings corroborate the multiple regression analyses reported in the main text, providing converging evidence that risk taking and information search are predicted by distinct combinations of psychological variables. Risk taking is primarily associated with confidence and empowerment, while information search shows a unique relationship with openness to information. This pattern of distinct predictors supports our conclusion that confidence does not have uniform effects across different decision-related behaviors, and that understanding the consequences of confidence requires consideration of behavior-specific pathways.
Appendix B
Alternative Definitions of Accuracy for the KCA and FCA
In our primary analyses, accuracy on the KCA and FCA was defined as whether participants selected the team that ultimately won the game. However, because many game outcomes were uncertain or unexpected, we explored whether alternative definitions of accuracy might better reflect participants’ actual knowledge or forecasting ability.
We first examined whether participants would have appeared more accurate if “correct” answers were defined as selecting the better-ranked team at the time of survey completion (based on official NCAA rankings from the week of 9/18/21). This definition yielded an average accuracy of 52.36%, nearly identical to the accuracy rate based on actual game outcomes (52.45%).
Next, we defined “correct” as selecting the team that was favored to win based on Moneyline betting odds — a widely used metric in sports prediction markets. This approach also led to only a modest increase in accuracy, with an average of 54.17% correct.
Importantly, only 12 of the 40 games in the forecasting condition had different outcomes from the team that was favored by odds, and these discrepancies did not consistently align with especially low or high participant accuracy. These results suggest that the overall difficulty of the task—rather than the method of accuracy calculation—likely contributed to the low percent correct across conditions. We therefore retained the original outcome-based definition of accuracy, as pre-registered, for all main analyses.


 Open access

