I. INTRODUCTION
Miniaturization of electronic packages has emerged as one of the key technologies in the electronic industries. It can provide abundant functionality into small and thin devices. This rapid growth has highlighted the need to ensure that these devices meet certain minimum criteria for reliability. One of the critical reliability issues is the influence of the miniaturization of electronic devices. Interconnections required in these devices keep becoming smaller, resulting in significant increase of current density within each solder joint. Moreover, owing to the difference in the electrical resistance and the feature size between each solder and its adjacent trace, there arises a drastic increase in the current density at the solder joint area. This increased current density will cause an increased massive migration of metal atoms in the direction of electron flow, which is a phenomenon known as electromigration (EM). Directional atomic migration can induce significant microstructural changes in a solder joint, such as voids formation, crack propagation, phase separation, solder extrusion/whiskers, the growth of intermetallic compounds (IMC), and the dissolution of under bump metallization (UBM).Reference Tu1–Reference Chan and Yang4 Severe microstructural changes result in an early electrical failure of solder joints. Recently, numerous investigations have been performed regarding to the EM behavior in various solder joints, i.e., Sn–Pb,Reference Hu, Lin, Kao and Tu5 Sn–Ag–Cu,Reference Lee, Kim, Yamanaka, Tsukada, Kuritani, Ueshima and Suganuma6, Reference Yamanaka, Tsukada and Suganuma7 Sn–Zn,Reference Kuo and Lin8, Reference Hung and Chen9 and Sn–BiReference Chen, Chen and Lin10, Reference He, Xu and Guo11 solder alloys. From the previous literature, the rapid consumption of UBM has been found to pose a critical problem during EMReference Hu, Lin, Kao and Tu5, Reference Yamanaka, Tsukada and Suganuma7, Reference Shao, Mhaisalkar, Sritharan, Vairagar, Engelmann, Aubel, Zschech, Gusak and Tu12, Reference Yeh, Choi, Tu, Elenius and Balkan13 and the dissolution rate of UBM layers such as Ni and Cu was also dependent on the crystallographic orientation of Sn,Reference Lee, Kim, Yamanaka, Tsukada, Kuritani, Ueshima and Suganuma6, Reference Lu, Shih, Lauro, Goldsmith and Henderson14 which has highly anisotropic properties. Numerous reliability problems caused by the anisotropic behavior of Sn have been reported and researchers studied the importance of controlling the crystallographic orientation of Sn.
Another important issue in the electronic packaging industry is the lowering of the melting temperature of the lead-free solder to prevent heat damage of electronic devices during reflow process. Sn–Ag–Cu solder is widely used as a reliable lead-free solder. Nevertheless, its melting temperature is approximately 34 °C higher than that of eutectic Sn–Pb solder, and the adaptation of lower melting temperature lead-free solders is still a necessity. Among several low temperature solders that have been used, Sn–In solder alloy is one of the leading candidates owing to its good mechanical properties and reliability. In-based solder alloys have advantages of superior ductility, good wetting properties, low melting temperature, low substrate dissolution, and excellent fatigue life.Reference Shimizu, Nakanishi, Karasawa, Hashimoto and Niwa15–Reference Sharif and Chan19 Additionally, Sn–In solders have been used in various applications such as step soldering and heat sensitive devices, especially when low temperature soldering is required. However, only a limited number of studies concerning the EM behavior of InReference Reddy and Prasad20, Reference Yamanaka, Tsukada and Suganuma21 and eutectic Sn–InReference Daghfal and Shang22 solders have been reported; moreover, it is necessary to understand the effect of additional In on EM behaviors. In this study, Cu/Sn–In/Cu solder strip models of various In compositions were adopted to verify EM behaviors.
II. EXPERIMENTAL
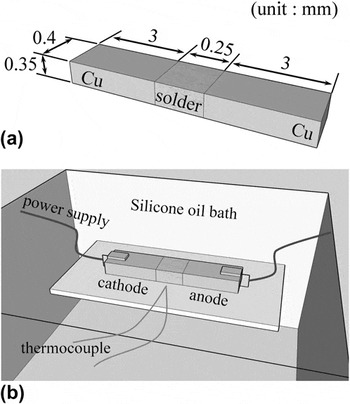
Solder alloys, Sn–xwt%In (where x = 0, 4, 8, and 16 wt%) were prepared by melting pure Sn (99.99%, Senju Metal Industry Co., Tokyo, Japan) and pure In (99.99%, Nilaco Co., Tokyo, Japan) in an oven at 300 °C for 30 min. In this article, the composition unit “wt%” is hereafter omitted. Prior to soldering, Cu cubes of height 3 mm, width 6 mm, and length 8 mm were carefully polished to form smooth surfaces. Two Cu cubes were aligned and fixed at a distance of approximately 230 μm. Reflow process was performed on the hot plate at 250 °C for 60 s, and the joints were then cooled to room temperature. After cutting and polishing, the joint had a cross-sectional area of approximately 350 μm × 400 μm and solder layer thickness of approximately 250 μm [see Fig. 1(a)].
Schematic of (a) test sample and (b) current stressing equipment setup.

The EM test for the sandwich-structure sample was performed by applying a direct current to both ends of samples by using Cu sheets as electrical leads, as shown in Fig. 1(b). Using clamps, the sample and Cu sheets were then fixed together with the slide glass. The entire sample was immersed in a silicone oil bath to reduce temperature rise that may occur during current stressing because it may induce thermomigration in the solder joint.Reference Chuang and Liu23 The solder joint temperature was monitored using a K-type thermocouple, which was placed close to the solder joint. During current stressing, the monitored temperature of the solder joint was 140 ± 3 °C. A direct electric current of 14 A was supplied by a power supply (PK6-130; Matsusada, Tokyo, Japan). The current density was calculated by dividing the applied electric current by the area of the solder joint interface and was found to be 10 kA/cm2. In-situ observation of the total electrical resistance change was also performed to monitor the failure time of test samples.Reference Wu and Sun24 To investigate microstructural changes in solder joints, joints were mounted in epoxy and polished mechanically followed by an argon ion beam polishing by using a cross-section polisher (SM-09010; JEOL Ltd., Tokyo, Japan). To examine microstructural changes and the crystallographic orientation, scanning ion microscopy (SIM; FB-2100, Hitachi, Tokyo, Japan), backscattered scanning electron microscopy (BS-SEM; JEOL-5510S, JEOL), an electron backscattered diffraction system (EBSD; TSL crystallography, EDAX, Kanagawa, Japan), and an electron probe microanalyzer (EPMA; XM-Z70391, JEOL) were used.
III. RESULTS AND DISCUSSION
A. Electrical resistance change
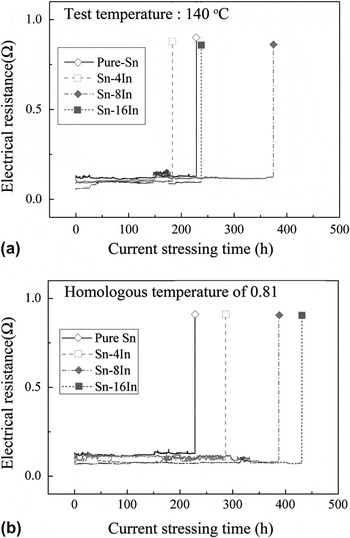
Figure 2 shows real-time electrical resistance changes of Sn–xIn (where x = 0, 4, 8, and 16 wt%) solder alloys with a current density of 10 kA/cm2 at 140 °C and at various temperature conditions. Plotted figures show the variation in the current stressing time versus the total electrical resistance change. The formation of voids during current stressing did not have a significant impact on the total electrical resistance change although voids propagated over a large area of the solder joint interface.Reference Choi, Yeh and Tu25 Therefore, the time taken for significant changes to be made in the total electrical resistance could be considered to be the lifetime of test samples. According to Fig. 2(a), lifetimes of test samples are approximately 228 h (pure Sn), 183 h (Sn–4In), 374 h (Sn–8In), and 237 h (Sn–16In) at a test temperature of 140 °C. This result clearly indicated that lifetimes of Sn–8In and Sn–16In are longer than those of pure Sn and Sn–4In. Although the lifetime of Sn–16In is approximately 10 h longer than that of pure Sn, the reason for this is the melting temperature of the Sn–16In alloy that is relatively lower than those of other solder alloys. The homologous temperature which refers to the ratio of the experimental temperature to melting temperature of pure Sn (melting temperature of 232 °C) is approximately 0.81 at 140 °C. However, for Sn–16In (melting temperature of 200 °C), the homologous temperature is approximately 0.87 at 140 °C. Therefore, the test temperature of 140 °C is relatively higher for Sn–16In than for pure Sn. With such a high homologous temperature, electrical failure occurs more quickly during EM because more atoms are thermally activated and the diffusivity of metal atoms is increased.Reference Wu and Sun24, Reference Lee, Tu and Frear26, Reference Agarwal, Ou and Tu27 Therefore, their lifetimes should be compared at the same homologous temperature. Figure 2(b) shows electrical resistance changes of samples at the same homologous temperature of 0.81 (Sn–4In: 129 °C, Sn–8In: 124 °C, and Sn–16In: 110 °C), approximately. In Fig. 2(b), it is observed that the Sn–16In alloy has a lifetime (447 h) much longer than that of other solder alloys. And the lifetime of the solder alloys are dependent to the In composition.
Electrical resistance changes of test samples during current stressing (10 kA/cm2): (a) at 140 °C and (b) at homologous temperature of 0.81.

B. Initial microstructure of solder joints
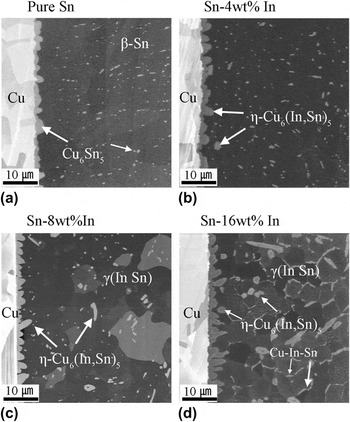
Figure 3 shows cross-sectional SIM images of joint interfaces between the Cu substrate and various Sn–In solder alloys after the reflow process at 250 °C. Figure 3(a) shows the cross-sectional SIM image of the Cu/pure-Sn interface. A scallop type η-Cu6Sn5 IMC layer of a thickness of approximately 4 μm was uniformly formed at the interface of Cu and the solder. There was also random distribution of submicron sized η-Cu6Sn5 IMCs in the β-Sn matrix.Reference Laurila, Vuorinen and Kivilahti28 Additionally, a small quantity of additional In (i.e., Sn–4In) does not significantly affect the distribution of IMCs when compared to the Cu/Sn solder interface. The Sn–4In/Cu solder interface is shown in Fig. 3(b).
Cross-sectional scanning ion microscopy (SIM) images of the solder joint after reflow at 250 °C for 30 s: (a) Pure Sn, (b) Sn–4In, (c) Sn–8In, and (d) Sn–16In.

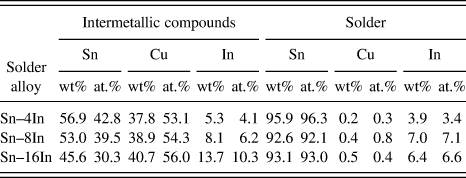
Obvious differences in the microstructure were observed when the In composition in solder alloys exceeded 8 wt%. In Figs. 3(c) and 3(d), a layer of scallop type η-Cu6(Sn, In)5 IMCs was formed at the Cu/solder interface as opposed to η-Cu6Sn5. This was caused by the additional In present. Additionally, η-Cu6(Sn, In)5 IMCs that were a few microns in size were observed in the solder matrix. Table I shows the average chemical composition of solder alloys after reflow at 250 °C, which were obtained by EPMA analysis. As the In composition of the solder alloys increased, the In composition within IMCs also increased and the size of IMCs also increased. In the binary In–Sn phase diagram,Reference Massalski29 a γ-(InSn) phase (Sn-rich phase) of a large compositional homogeneity (73 ∼ ? wt% Sn) was observed in the hypereutectic area, and there still seems to be considerable uncertainty regarding the phase equilibrium that exists between the γ-(InSn) and β-Sn phases. In this work, average (three analysis points) In compositions in the Sn matrix were 3.9 wt% in the Sn–4In alloy, 7.0 wt% in the Sn–8In alloy, and 6.4 wt% in the Sn–16In alloy. Hence, both the γ-(InSn) and β-Sn phases may exist in Sn–In solder alloys. It was also observed that Cu atoms dissolved from the Cu substrate during the reflow process formed a primary η-Cu6(In, Sn)5 phase in both the solder matrix and the joint interface with Cu at 218.5 °C.Reference Liu, Liu, Ohnuma, Kainuma, Ishida, Itabashi, Kameda and Yamaguchi30 However, Cu–In–Sn IMCs precipitated at grain boundaries in the Sn–16In alloy were not yet confirmed. It is possible that the remaining Cu, In, and Sn atoms may transform to a ternary compound such as Cu2In3Sn IMC during the cooling process.Reference Liu, Liu, Ohnuma, Kainuma, Ishida, Itabashi, Kameda and Yamaguchi30 Further investigations are needed to better understand and identify the phase formed at grain boundaries.
Average chemical compositions of solder alloys after reflow by electron probe micro analyzer analysis.

C. Microstructural changes after EM
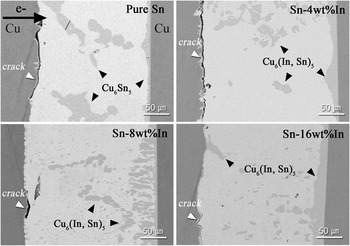
Figure 4 shows cross-sectional BS-SEM images of test samples after current stressing for 110 h at 140 °C. As indicated by arrows, electrons flow from the left (cathode) to the right (anode). The propagation of large cracks at the cathode interface was observed in pure Sn and Sn–4In alloys. Additionally, large η-Cu6Sn5 IMCs were formed at the interface between Cu and the anode side of the Sn solder as well as within the solder matrix. The propagation of cracks at the cathode became smaller with the addition of In. In the case of Sn–16In, only small cracks were found at the cathode IMC/Sn interface.
Cross-sectional backscattered scanning electron microscopy images of the solder joint after current stressing of 10 kA/cm2 for 110 h at 140 °C.

Orders of diffusivity for both In and Sn are almost equal. At 140 °C, the diffusivity of In in the Sn matrix ranges from 3.5 × 10⁻¹³ to 7.6 × 10⁻¹³ cm2/s with regards to the axis direction of SnReference Sawatzky31 while the self-diffusivity of Sn ranges from 2.2 × 10⁻¹³ to 4.1 × 10⁻¹³ cm2/s at the same temperature.Reference Huang and Huntington32 However, in the ternary Cu/Sn–In system, the diffusivity of Cu atoms is much greater than that of both In and Sn and it ranges from 7.6 × 10⁻⁶ to 1.5 × 10⁻⁷ cm2/s.Reference Dyson, Anthony and Turnbull33 Therefore, the Cu atom is considered to be the primary mover as it migrates along the preferred direction; in this case, Cu atoms migrated from the cathode to the anode while Sn atoms displaced in the opposite direction.Reference Chan and Yang4–Reference Yamanaka, Tsukada and Suganuma7 Therefore, η-Cu6Sn5 and η-Cu6(In, Sn)5 IMC layers formed at the cathode were decomposed, and IMCs formed at the anode because of diffused Cu atoms from the cathode interface migrate to the anode owing to the fast migration rate.Reference Tseng, Lu, Hsiao, Liao, Chuang, Chung and Liu34 Although a previous study reported that there is segregation of In at the cathode of the eutectic Sn–In solder under current stressing,Reference Daghfal and Shang22 this study did not observe that phenomenon owing to different test conditions and different solder alloys used.
Based on results presented above, the electrical failure of the test sample is caused by the propagation of cracks at the cathode IMC and solder interface because of the migration of Cu atoms. During EM at high temperature, the migration of Cu atoms often exhibits anisotropic behaviors in the Sn matrix.Reference Lee, Kim, Yamanaka, Tsukada, Kuritani, Ueshima and Suganuma6, Reference Lu, Shih, Lauro, Goldsmith and Henderson14 At high temperatures, lattice diffusion is considered to be a primary diffusion mechanism for Cu atoms.Reference Chen and Liang3 Owing to highly anisotropic diffusion characteristics of Sn,Reference Huang and Huntington32, Reference Dyson, Anthony and Turnbull33, Reference Yeh and Huntington35 the c-axis provides a very fast interstitial diffusion site for Cu atoms as opposed to the a-axis and b-axis. Therefore, during EM tests, the crystallographic orientation of Sn is important factor in Sn-based lead-free solders.
D. Crystallographic orientation of Sn
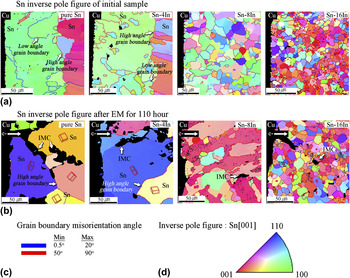
The EBSD analysis was adopted to investigate the crystallographic orientation of Sn. Figure 5 shows the Sn inverse pole figure before and after current stressing for pure Sn, Sn–4In, Sn–8In, and Sn–16In solder joints. Figure 5(a) indicates the inverse pole figure of Sn and Sn grain boundaries with respect to the misorientation angle before current stressing. Black areas located on the left of each image indicate the Cu substrate, while various colors on the right indicate the Sn inverse pole figure. In Fig. 5(a), pure Sn and the Sn–4In solder joint solidified into a few large randomly orientated Sn grains having high-angle grain boundaries. Large Sn grains comprise small subgrains with a low-angle grain boundary. The general expression for the average grain size is A = A s/N s, where A s is the sum of the Sn grain area in the selected dimension area and N s is the number of Sn grains in the selected dimension area. Based on the above equation, the average Sn grain size for pure Sn, Sn–4In, Sn–8In, and Sn–16In solder alloys before current stressing are approximately 810, 386, 122, and 54 μm2, respectively. A reduction in the Sn grain size was clearly observed with regards to the In composition in solder alloys, i.e., Sn–8In and Sn–16In.
Cross-sectional electron backscattered diffraction system analysis of the solder joints before and after current stressing of 10 kA/cm2 at 140 °C: (a) Sn inverse pole figure of initial samples, (b) Sn inverse pole figure after EM for 110 h, (c) grain boundary misorientation angle, and (d) inverse pole figure of Sn [001].

Figure 5(b) shows the Sn inverse pole figure and grain boundaries after current stressing of 10 kA/cm2 for 110 h at 140 °C. The black area located on the left of each map indicates the Cu substrate at the cathode. Additionally, the black area and black spots dispersed in the middle of the Sn matrix were η-Cu6Sn5 in the case of pure Sn and η-Cu6(In, Sn)5 IMCs in the case of In-contained alloys. Unit cells located in each Sn grain indicated the crystallographic orientation of Sn. After current stressing for 110 h at 140 °C, crystallographic orientation changes were observed in all solder alloys. Most low-angle grain boundaries merged and subsequently disappeared. Also, numerous IMCs, which were indicated by black areas and spots in Fig. 5(b), were formed. In pure Sn and Sn–4In alloys, numerous η-IMCs of a size of approximately a few hundred microns formed inside the Sn matrix. Contrarily, for Sn–8In and Sn–16In, small η-IMCs were formed and dispersed in the Sn matrix. Average Sn grain sizes of pure Sn, Sn–4In, Sn–8In, and Sn–16In solder alloys after current stressing were approximately 2125, 1700, 369, and 81 μm2, respectively. From above results, it was found that the Sn grain size decreases as the In composition in solder alloys is increased. However, after current stressing, it was found to increase.
Sn grains normally have a preference for misorientation angles (i.e., 22.5, 43, 59, 62, 70, and 80°), which are low-energy boundaries present in bulk Sn.Reference Telang, Bieler, Lucas, Subramanian, Lehman, Xing and Cotts36 During thermal aging, there are fewer grain boundaries having peaks at 45, 60, and 70°, and most low-energy boundaries disappear. Additional Cu atoms in pure Sn provide a favorable heterogeneous nucleation site during the solidification of liquid Sn-rich solder, and they also increase the randomness of the crystallographic orientation of Sn. Additionally, the coarsening of β-Sn grains occurred naturally during thermal aging and most small grains with a misorientation angle less than 5° merge into large grains.Reference Seo, Cho and Lee37
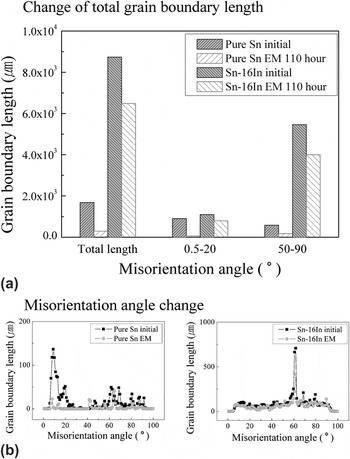
In this work, the crystallographic orientation of Sn in a Cu/Sn solder joint was found to be similar to that of the Sn–0.5Cu solder jointReference Seo, Cho and Lee37 because Cu atoms dissolved into the Sn matrix during the reflow process. The distribution of grain boundaries with regards to misorientation angles, both before and after current stressing, is shown in Fig. 6. The total grain boundary length of Sn was approximately 1680 μm and low-angle grain boundaries accounted for more than 50% of the total grain boundaries having a length of approximately 900 μm. For convenience, in this study, we defined the low-angle grain boundary as the case when the misorientation angle was less than 20°. After current stressing, with the exception of some preferred high-angle grain boundaries (i.e., 40 and 64°), 80% of the grain boundaries disappeared, including both low- and high-angle grain boundaries. In the Cu/Sn–16In joint, preferred misorientation angles of approximately 60° were observed. However, the length of the preferred grain boundary was only 10% of the total grain boundary. The other 90% of grain boundaries do not show any preferred misorientation angle. Therefore, the Cu/Sn–16In solder joint exhibits more random misorientation angles than those of the Cu/Sn solder joint. After EM, the total grain boundary length decreased by only 66% but a similar tendency was also observed with the initial sample.
Distribution of grain boundary and misorientation angle of Sn and Sn–16In before and after current stressing: (a) total grain boundary length and (b) misorientation angle change.

Previous literature has reported that the grain growth occurred because of the release of interfacial energy between grain boundaries and the anisotropic elastic modulus of Sn during thermal aging.Reference Park, Dhakal, Lehman and Cotts38, Reference Telang, Bieler, Zamiri and Pourboghrat39 Unstable low-angle boundaries are first merged into large grains during grain growth, but high-angle grain boundaries are not.Reference Telang, Bieler, Lucas, Subramanian, Lehman, Xing and Cotts36, Reference Seo, Cho and Lee37 However, during current stressing at high temperatures, the coarsening of Sn grains was observed at both the low- and high-angle grain boundaries. This abnormal Sn grain behavior appears to result from anisotropic resistance properties of Sn. The difference in the electrical resistivity is more than 50% (13.25 μΩ along the a- and b-axes, and 20.27 μΩ along the c-axis).Reference Wu, Tu, Lloyd, Tamura, Valek and Kao40 High-resistance grains may realign themselves to the low-resistance grain to minimize the energy dissipation caused by resistance.Reference Wu, Tu, Lloyd, Tamura, Valek and Kao40–Reference Wu and Hsieh43 Therefore, the grain growth and reorientation of Sn grains occurred simultaneously, regardless of the misorientation angle existing between them.
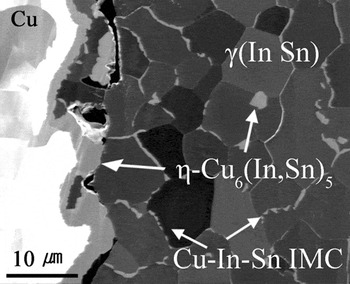
Another important result is the location of η-IMCs, which formed after current stressing. In Section III.C, for Cu/Sn and Cu/Sn–In systems, Cu atoms are defined as primary movers with a fast diffusion rate in the Sn matrix. The migration of Cu atoms from the cathode to the anode results in the serious dissolution of IMCs at the cathode and the significant growth of IMCs at the anode. Figure 4 shows that there was an extensive dissolution of IMCs at the cathode in the Cu/Sn–(0,4)In joint. However, large η-IMCs formed in the middle of the Sn matrix and no significant growth was observed in IMCs at the anode. Most IMCs, which formed in the middle of the solder alloy, were located at high-angle grain boundaries [see Fig. 5(b)]. These IMCs clearly demonstrate that Cu atoms had diffused mainly through the interstitial site of the Sn lattice, and it was difficult for them to pass through grain boundaries. Hence, grain boundaries effectively interrupt the migration of Cu atoms during EM. In Cu/Sn–16In joints, which had a longer lifetime than other solder alloys, numerous small η-IMCs were formed and were well dispersed in the solder matrix. Figure 7 shows a cross-sectional SIM diagram for the Cu/Sn–16In joint after current stressing for 110 h. The formation of a few voids and the dissolution of IMCs caused by the migration of Cu atoms were partially observed. However, IMCs formed a network at the grain boundary after the reflow process and did not change much even after current stressing.
Cross-sectional SIM images of the Cu/Sn–16In solder joint after current stressing of 10 kA/cm2 for 110 h.

Differences in the behavior of IMCs were because of the crystallographic orientation of Sn. Solder alloys comprise large grains (i.e., pure Sn and Sn–4In) and exhibit the massive dissolution of Cu atoms at the cathode with regards to the direction of the c-axis of Sn. This is because the c-axis of Sn provides a fast interstitial diffusion for Cu atoms. Cu atoms that were diffused from the cathode IMC migrated along the interstitial site of Sn grains and formed large IMCs at both grain boundaries and the anode. When the solder alloy has a fine grain, depending on the direction of the axis of each grain, partial Cu dissolution occurred at the cathode interface. IMCs formed are also smaller. Additionally, numerous grain boundaries and IMCs network can possibly interrupt the migration of Cu atoms and reduce the dissolution rate of Cu. Therefore, solder alloys, which have small Sn grains, show increased EM resistance and have longer EM lifetimes than other solder alloys.
IV. CONCLUSION
The EM behavior of various Sn–xIn solder alloys (x = 0, 4, 8, and 16 wt%) was investigated, and we found remarkable differences depending on the composition of In. Upon the addition of In, the size of the Sn grain is substantially reduced. For Sn–16In, the grain size reduced by 93.3% when compared to pure Sn grains. The in-situ observation of the electrical resistance of samples during current stressing revealed that Sn–16In and Sn–8In, which have fine Sn grains, have longer lifetimes than pure Sn and Sn–4In. The primary reason for the electrical failure of solder joints was determined to be the propagation of cracks between cathode IMCs and solder alloys because of the migration of Cu atoms. Finer Sn–8In and Sn–16In grains can improve EM resistance because the interstitial diffusion of Cu along the Sn lattice was suppressed both by uniaxial fine grains and by grain boundary IMCs.
ACKNOWLEDGMENT
This work was supported by KAKENHI (Grant No. 21246109): Grant-in-Aid for Scientific Research (A). And the authors would like to thank the electron probe microanalyzer analysis for this research by Institute of Science and Industrial Research Comprehensive Analysis Center of Osaka University.