Introduction
The bauxite beneficiation process produces large amounts of tailings in the Amazon (Negrão et al., Reference Negrão, da Costa and Pöllmann2022a). These tailings are filled with large amounts of mud residue, generated by the washing of clay from bauxite to increase the ore grade. Close to 0.35 tons of clayey material is generated per 1.0 ton of ore (Negrão et al., Reference Negrão, da Costa and Pöllmann2022a). Norsk Hydro’s Mineração Paragominas S.A. in the Amazon recently implemented the Dry Backfill technology, where the washing residue is dried before being placed in the rehabilitated mining sites (https://www.hydro.com/en/global/about-hydro/stories-by-hydro/novel-bauxite-tailings-concept-a-success-in-full-operation/). The mineralogical composition of this material varies and includes minerals rich in Al2O3 (gibbsite and kaolinite (main mineral)), SiO2 (kaolinite), Fe2O3 (hematite and goethite), and TiO2 (anatase) (Negrão et al., Reference Negrão, da Costa and Pöllmann2022b).
The predominance of kaolinite (Al₂Si₂O₅(OH)₄) in this material, a 1:1 clay mineral composed of Si-O tetrahedral and Al-O2(OH)4 octahedral sheets (Albach et al., Reference Albach, Vianna dos Santos, da Silveira Rampon and Barbosa2019), suggests its potential for various applications, as the use of kaolinite as the principal source of aluminosilicates for geopolymer production (Sun et al., Reference Sun, Lin and Vollpracht2018; Filipponi et al., Reference Filipponi, Masi and Bignozzi2021; Liu et al., Reference Liu, Hu, Zhang, Wang and Ma2023b; Wang et al., Reference Wang, Wang and Zhang2024).
Geopolymers are amorphous/crystalline inorganic polymers synthesized from the reaction of aluminosilicates with a highly alkaline solution (Davidovits, Reference Davidovits1991; Rożek et al., Reference Rożek, Król and Mozgawa2019; Khalifa et al., Reference Khalifa, Cizer, Pontikes, Heath, Patureau, Bernal and Marsh2020; da Silva Godinho et al., Reference da Silva Godinho, Pelisser and Bernardin2022). This type of material is characterized by various properties and features, including high compressive strength, low shrinkage, fast or slow curing, acid resistance, fire resistance, and low thermal conductivity (Duxson et al., Reference Duxson, Fernández-Jiménez, Provis, Lukey, Palomo and Van Deventer2007; Junaid et al., Reference Junaid, Khennane, Kayali, Sadaoui, Picard and Fafard2014; Colangelo et al., Reference Colangelo, Roviello, Ricciotti, Ferrándiz-Mas, Messina, Ferone, Tarallo, Cioffi and Cheeseman2018; Statkauskas et al., Reference Statkauskas, Vaičiukynienė, Grinys and Paul Borg2023a). The primary distinction of geopolymer materials compared with others with similar properties lies in their synthesis process, which occurs at low temperatures (typically room temperature) and within a brief time frame. This process reduces energy requirements significantly, and consequently minimizes CO₂ emissions into the atmosphere (Belmokhtar et al., Reference Belmokhtar, Ammari, Brigui and Ben Allal2017; Kamseu et al., Reference Kamseu, Beleuk à Moungam, Cannio, Billong, Chaysuwan, Melo and Leonelli2017; Lemougna et al., Reference Lemougna, Wang, Tang and Cui2017; Hajimohammadi et al., Reference Hajimohammadi, Ngo and Kashani2018; Koshy et al., Reference Koshy, Dondrob, Hu, Wen and Meegoda2019; Samarakoon et al., Reference Samarakoon, Ranjith, Rathnaweera and Perera2019; Silva et al., Reference Silva, Kim, Aguilar and Nakamatsu2020; Zannerni et al., Reference Zannerni, Fattah and Al-Tamimi2020; Petrus et al., Reference Petrus, Fairuz, Sa’dan, Olvianas, Astuti, Jenie, Setiawan, Anggara, Ekaputri and Bendiyasa2021; Gomes Silveira et al., Reference Gomes Silveira, Figueiredo Martins, Bezerra and Gabriel da Silva Araújo2022; Liu et al., Reference Liu, Hu, Zhang, Wang and Ma2023b).
Identifying a sustainable and economically viable application for tailings is one of the key challenges faced by companies that produce them. Based on the mineralogical characteristics of the bauxite mined in northern Brazil and the large amount of availability, this study proposes an alternative application for Amazon bauxite mining tailings in geopolymer production by testing a novel synthesis route that eliminates the need for thermal pre-treatment (i.e. converting kaolinite to metakaolinite at 750°C) (Kwakye-Awuah et al., Reference Kwakye-Awuah, Abavare, Sefa-Ntiri, Nkrumah, Von-Kiti and Williams2021).
There are several possible applications for geopolymers. Geopolymers can be used an alternative to Portland cement (Qu et al., Reference Qu, Qin and Wang2024). In addition, they are suitable for fabricating foamed ceramics (Dong et al., Reference Dong, Guo, Jiang, Shao, Zhang, Wang, Lu, Huang and Cheng2023). The utility of geopolymers extends to the removal of heavy metals (Khaksar Najafi et al., Reference Khaksar Najafi, Jamshidi Chenari and Arabani2020; Liu et al., Reference Liu, Feng, Wang, Lyu, Liu, Dai and Bai2023a). Furthermore, geopolymers can capture phosphate (PO₄³⁻) and ammonium (NH₄⁺) ions effectively (Salam et al., Reference Salam, Mokhtar, Albukhari, Baamer, Palmisano, AlHammadi and Abukhadra2021). These diverse applications emphasize the broad functionality and adaptability of geopolymers in various industrial and environmental contexts.
Materials and methods
Raw material
The material utilized in this study is a sample of bauxite mining tailings (ALB-1) obtained from Mineração Paragominas S.A. (Hydro), located in the municipality of Paragominas, Pará, Brazil. The sample was collected directly from the ‘waste tailpipe’ with the aid of a hose that transported the sample to the collection container. In addition to ALB-1, a commercial microsilica sample (MCR-1) from Ecopower was used to achieve the desired Si/Al ratio, as established in the geopolymer synthesis section of this study.
Sample characterization
Mineralogical identification by X-ray diffraction
The mineralogical phases of the in natura and calcined samples were identified with powder X-ray diffraction (XRD) using a Bruker (Billerica, MA, USA) D2 Phaser diffractometer, equipped with copper anode and operated at 300 W (30 kV×10 mA). The XRD scans were collected from 5 to 70°2θ, using a step size of 0.01°. The analyses were performed at the Laboratory of Mineralogy, Geochemistry and Applications (LAMIGA-UFPA) of the Institute of Geosciences of UFPA, Belém, Pará, Brasil.
SEM images
The scanning electron microscopy (SEM) images of the bauxite washing clay were collected using a Zeiss Gemini 300 (Oberkochen, Germany) field emission electron microscope located at the Zentrum für Werkstoffanalytik Lauf, Germany. The sample was heated to 35°C for 24 h, and carbon-metallised prior to the analysis.
Quantification of the mineral phases
The quantification of the mineral phases was obtained from XRD Rietveld refinements, performed in the HighScore suite (version 4.9) from Malvern Panalytical. The crystallographic information files used in the refinements were obtained from the Inorganic Crystal Structure Database (ICSD) from FIZ Karlsruhe (Table 1).
Phases and ICSD codes used in the Rietveld refinements

The amorphous contents were quantified using the external standard method (Snellings et al., Reference Snellings, Bazzoni and Scrivener2014). For this quantification, a pure, single crystal of hyaline quartz was ground to powder, XRD-measured under the same conditions as the samples, refined with the Rietveld method, and used as an external crystalline standard. The amorphous content here includes amorphous phases (i.e. ‘low-crystallinity’ phases) that result in misfits in the Rietveld refinements, or identified phases present in minor amounts.
Chemical analysis
Chemical analysis of the samples was performed by X-ray fluorescence (XRF) spectrometry through the preparation of fused pellets. The tablets were prepared with a sample/flux ratio (lithium tetraborate) established according to the XRF79C_10 method. The analyses were performed in the chemical analysis laboratory of the company SGS GEOSOL, located in Vespasiano, Minas Gerais, Brasil.
The loss on ignition (LOI) of all samples was determined by the gravimetric method by calcination at 1000°C of previously dried samples.
Determination of reactive silica and available alumina
The percentage of reactive silica and available alumina was determined in the chemical analysis laboratory of the company SGS GEOSOL according to the method established by the company (ICP05V), which consists of dissolving the sample in concentrated NaOH solution in a system with controlled pressure and temperature (150°C). From the solution obtained, the usable aluminum concentration was determined by an Agilent Technologies 700 Series inductively coupled plasma optical emission spectrometer (ICP-OES). The solid phase resulting from the dissolution step was dissolved in an HCl solution, which allowed the determination of the percentage of reactive silica by ICP-OES. The analyses were performed in the chemical analysis laboratory of SGS GEOSOL, located in Vespasiano, Minas Gerais, Brazil.
Material characterization by Fourier-transform infrared spectroscopy
Fourier-transform infrared spectroscopy (FTIR) was used to complement the XRD results for the samples and geopolymer. This technique was also used to characterize the ‘white powder’ that was observed mainly on the surface of the geopolymer. The analyses were performed using approximately 0.0015 g of sample that was mixed and homogenized with 2 g of potassium bromide (KBr; Merck). Pellets were then formed in steel molds in the form of discs with a diameter of 14 mm, and pressed under a pressure of 8 kbar in a Specac 8 manual press. The analyses were performed in a Vertex 70 instrument (Bruker) in the spectral range of 400–4000 cm–1. This procedure was performed at LAMIGA-UFPA of the Institute of Geosciences of UFPA, Belém, Pará, Brasil.
Thermogravimetry/differential scanning calorimetry analysis
Thermogravimetry/differential scanning calorimetry (TG/DSC) analysis was performed to understand the thermal behavior and possible reactions during the heating process of the investigated samples. Samples were analyzed in an STA 449 F5 Jupiter instrument (NETZSCH; Trockenmahltechnik GmbH, Hanau, Germany) with a simultaneous thermal analyzer equipped with a vertical cylindrical oven under N2 flow of 50 mL s–1, a heating rate of 10°C min–1, and temperature range of 30–1100°C. This procedure was performed at LAMIGA-UFPA of the Institute of Geosciences of UFPA, Belém, Pará, Brasil.
Synthesis and characterization of geopolymer
Synthesis of geopolymer
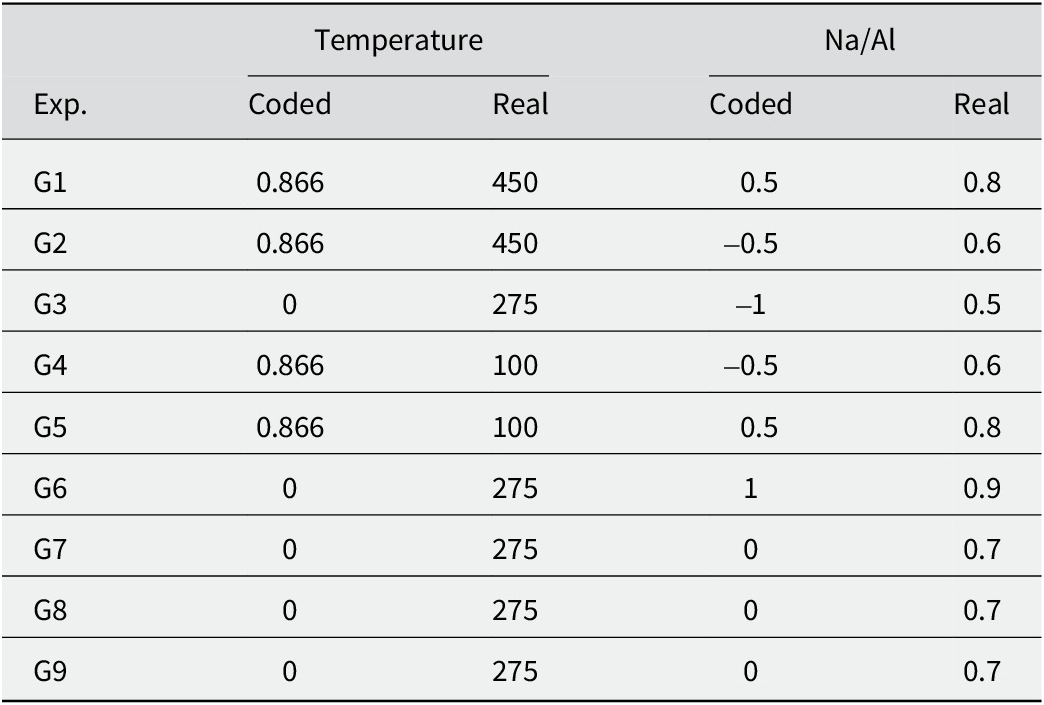
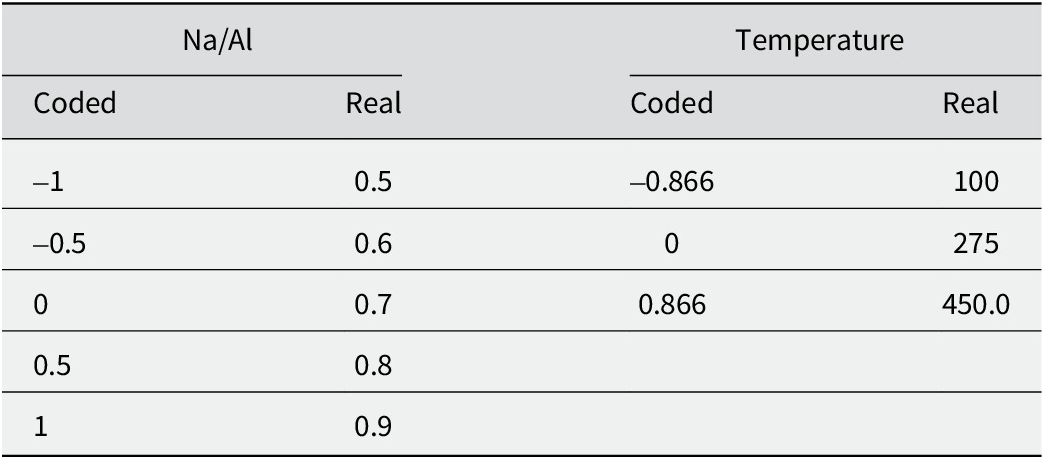
The geopolymer synthesis was performed with response surface methodology (RSM) based on a Doehlert design (Balti et al., Reference Balti, Boudenne, Yahya and Hamdi2024), with six experiments and three replicates at the central point (Table 2). In this type of planning, the influence of two variables about a given response is evaluated: one variable is evaluated at five different levels, and the other is analyzed at three levels. The dependent variables chosen in the study were temperature and Na/Al ratio (Table 3). The independent variable was compressive strength.
Experimental matrix and real and coded values of the independent variables

Independent variables with their real and coded values used in the Doehlert statistical design

For geopolymer synthesis, ALB-1 was dried for 48 h at room temperature and then transferred to an oven for another 2 h at 105°C to accelerate the loss of moisture in the sample. To form the specimens, a mixture of 23 g of ALB-1 and 7 g of MCR-1 were weighed to reach a molar Si/Al ratio of 3.5. This mixture was transferred to a porcelain vessel. NaOH solution (4.6 ml) was gradually added to the mixture and homogenized using a pestle for approximately 5 min. The volume of the NaOH solution was maintained at 4.6 mL to ensure consistency in the pressing time of the specimens. The mass of NaOH in solution was established by the molar ratio of Na/Al pre-defined in Table 3. The geopolymer paste formed was reserved in polyethylene pots, which were then capped and held at room temperature for 90 min. After this period, the geopolymer paste was molded in steel molds (dimensions: 50×20×30 mm) with uni-axial pressing under a pressure of 15 kgf cm–2 in a hydraulic press (Karl Kolb, model PW-40). The shaped specimens were sealed in film paper (for moisture control) and placed in an oven at 40°C for 24 h. The temperature was then increased by 10°C h–1 until reaching the final temperature established in the experiments. The cure time was defined as 120 h for all specimens cured at 100°C and 1 h for all specimens cured at 275°C and 450°C.
Mechanical compressive strength
Compressive strength testing of the specimens was performed in a universal testing machine (300/15 kN, Servo-plus evolution, MSTEST) with a test speed of 0.1 MPa s–1, initial test value of 1 N and final load of 30%. The test was performed in the concrete laboratory of the Architecture School of UFPA, Belém, Pará, Brasil.
SEM images
The surface of the geopolymer was investigated using a SU-8020 high-resolution field-emission SEM (HITACHI/TM 3000) coupled to an Oxford SwiftED3000 (Oxford Instruments, Abingdon, UK) energy dispersive system (EDS), with an accelerating voltage of 15 kV and the 30 s image acquisition time. The SEM-EDS analyses were performed in the concrete laboratory of the Architecture School of UFPA, Belém, Pará, Brasil.
Results and Discussion
Sample characterization
Mineralogy by XRD and SEM image
The mineralogy of the ALB-1 sample consisted of kaolinite (45 wt.%), gibbsite (34 wt.%), goethite (11 wt.%), hematite (10 wt.%), anatase (2 wt.%), and amorphous phase (1 wt.%) (Fig. 1), a mineralogical composition very similar to the bauxite clay cover (Barreto and Lima, Reference Barreto and Lima2021). The kaolinite present in the sample had low structural order (low ‘crystallinity’), showing anomalous peaks in the diffractogram that resulted in misfits in the Rietveld refinement; similar behavior was also observed in the refinement of kaolinite in bauxites of the Amazon and in their corresponding cover (Belterra clay) (Paz et al., Reference Paz, Angélica and Kahn2017; Negrão et al., Reference Negrão, da Costa and Pöllmann2018b; Negrão et al., Reference Negrão, Alves and Pöllmann2021). In addition, kaolinites were composed of very small nanometric crystallites (Fig. 2), as usually occurs for low-ordered minerals with defects in their crystal structure (Negrão et al., Reference Negrão, Costa, Pöllmann and Horn2018a). The low structural order of kaolinite, along with its nanoscale crystallite size, is thought to enhance the mineral’s reactivity, which favors the use of the sample in the synthesis of geopolymer without thermal pre-treatment. The higher reactivity of low-ordered kaolinite, compared with the high-ordered one, can be related to its greater specific surface area (of its nano-sized crystallites), and the structural defects in the Si-Al layered structure of this mineral. This behavior indicated that the Al and Si from the low-ordered kaolinite of the studied material were dissolved by NaOH similarly as it happens for metakaolin, due to the greater reactiveness of this phase and high disorder that made the structure less stable. The formation of zeolites directly from kaolinites under NaOH attack using similar lower temperatures was previously documented (Peng et al., Reference Peng, Qi, Vogrin, Huang, Wu and Vaughan2021). The formation of both zeolites (zeolite Na-K-4 and hydrosodalite) and amorphous phases in the products suggests that geopolymerization or alkali activation serves as a precursor to zeolite formation, and that hybrid materials containing both phases are common (Król et al., Reference Król, Rożek, Chlebda and Mozgawa2019).
Rietveld-refined XRD results for ALB-1: GOF, 1.61; Rwp, 11.87. (GOF, goodness-of-fit; Rwp, weighted profile R-factor.)

SEM image of used clay residue (from tailing) consisting mainly of nano-sized crystallites of kaolinite.

The large amounts of gibbsite present in the material reacted with NaOH, similar to that occuring in the Bayer process. Al-goethite, hematite, and anatase minerals were inert under the studied synthesis conditions, but the presence of these minerals can influence both the synthesis mechanism and the final properties.
Chemical composition
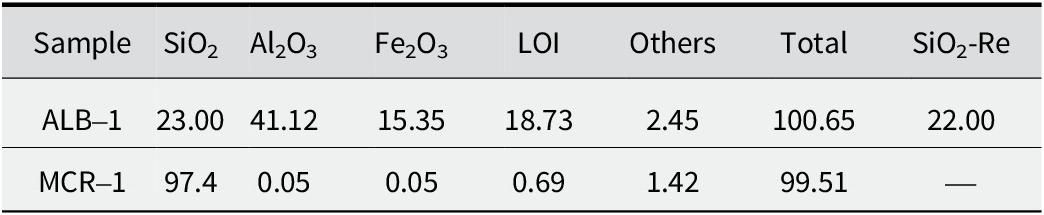
ALB-1 major oxides (Table 4) are Al2O3 (41.12 wt.%), SiO2 (23.00 wt.%), and Fe2O3 (15.35 wt.%). The percentages of SiO₂ and reactive silica are associated with kaolinite. Stoichiometric calculations indicate kaolinite contents of 48.45 wt.% based on total SiO₂ and 47.26 wt.% based on reactive SiO₂. These results align closely with those obtained from the semiquantitative analysis of Rietveld-refined XRD data (Fig. 1). The Al₂O₃ content is attributed to kaolinite and gibbsite, as well as to Al-substituted goethite present in the sample. Fe₂O₃ is attributed to goethite and hematite.
Chemical composition of the samples.

SiO2-Re, reactive SiO2.
The MCR-1 sample consists mainly of SiO2 (97.4 wt.%) and contains 1.42 wt.% of other compounds (Table 4). The chemical analysis results allowed calculation of the Si/Al and Na/Al ratios used in the syntheses of the geopolymer.
FTIR spectra of raw samples
The FTIR spectrum of ALB-1 shows characteristic bands of kaolinite, with absorption bands at 3620 and 3695 cm⁻¹ corresponding to O-H bonds. The bands at 3437 and 3525 cm⁻¹ are associated with H₂O. The absorption at 1635 cm⁻¹ was attributed to the vibration of water molecules. The band at 1100 cm⁻¹ was attributed to the stretching of Si-O bonds of kaolinite. The symmetric stretching of the Si-O-Si bonds of kaolinite was indicated by the absorption band at 1010 cm⁻¹. The bands at 912 and 796 cm⁻¹ were related to the angular deformation vibration of Al-OH bonds and the translational vibration of -OH (Al-OH) bonds of gibbsite. The bands at 468 and 750 cm⁻¹ were characteristic of the symmetric stretching of Al-O bonds. The absorption band at 538 cm⁻¹ was related to the angular deformation of Fe-O bonds. These results agree with those obtained by Zhu et al. (Reference Zhu, Qi, Zhang, Bisson, Xu, Fan and Sun2019), Roudouane et al. (Reference Roudouane, Mbey, Bayiga and Ndjigui2020), Sazali et al. (Reference Sazali, Harun, Azhar, Bahri, Ahmad, Hussinisa and Misdan2020), Kaze et al. (Reference Kaze, Lecomte-Nana, Adesina, Nemaleu, Kamseu and Chinje Melo2021) and Li et al. (Reference Li, Luo, Qin, Liu, Duan, Jing, Zhang and Liu2022).
The FTIR spectra of MCR-1 presented a wide band at 3452 cm⁻¹ and a band at 1620 cm⁻¹, characteristic of physically adsorbed water on the sample surface (González-García et al., Reference González-García, Téllez-Jurado, Jiménez-Álvarez, Zarazua-Villalobos and Balmori-Ramírez2022). A band in the range of 1000–1250 cm⁻¹ was observed, attributed to Si-O bonds in amorphous aluminosilicates. The bands at 806 and 478 cm⁻¹ were related to Al-O bonds (Si, Al-O) (Sazali et al., Reference Sazali, Harun, Azhar, Bahri, Ahmad, Hussinisa and Misdan2020). See Fig. 3.
FTIR spectra of the samples: (a) ALB-1, (b) MCR-1.

Thermogravimetry-differential scanning calorimetry curves
The thermal behavior of ALB-1 (Fig. 4) consisted of three endothermic events and one exothermic event. The first endothermic event, at 293°C, was attributed to the dehydroxylation of gibbsite. The second endothermic event, at 358°C, was related to the structural water loss of goethite. The third endothermic event, observed at 510°C, was related to the structural water loss of kaolinite. The only exothermic event occurred at 980°C and was attributed to the formation of a new crystalline phase (mullite/spinel).
Thermogravimetry-differential scanning calorimetry curves of ALB-1.

The dehydroxylation of the kaolinite started at a temperature of 437.6°C (onset). This temperature guided the selection of the maximum geopolymer curing temperature of 450°C, considering that at this temperature only some kaolinite has undergone complete dehydroxylation.
Characterization of geopolymer
Mineralogy obtained by XRD
The phase assembly of the synthesized geopolymer included all the minerals originally present in ALB-1, plus zeolite and hydrosodalite, formed by the reaction of the sample with NaOH (Fig. 5).
(A) XRD patterns of the geopolymer. (B) Same patterns overlapped with the pattern of ALB-1, demonstrating the higher background of the former.

The kaolinite and gibbsite contents decreased in all geopolymers compared with their percentages in the raw sample (Table 5 and Fig. 6), indicating that at least part of the kaolinite was transformed (zeolite and/or hydrosodalite) in the course of the reaction.
XRD-Rietveld semiquantitative results of the mineral and other crystalline phases in ALB-1 and the produced geopolymer

* GOF, goodness-of-fit; Rwp, weighted profile R-factor.
XRD-Rietveld semiquantitative results for the mineral phases in G4-1 geopolymer.

A simple comparison between the XRD patterns of ALB-1 and the geopolymer shows a greater background in the diffractograms of the geopolymer (Fig. 5b), characteristic of a high percentage of amorphous compounds (Mendes et al., Reference Mendes, Elyseu, Nieves, Zaccaron, Bernardin and Angioletto2021; Zhang et al., Reference Zhang, Yu, Guo, Chen, Liu and Yuan2022; Liu et al., Reference Liu, Feng, Wang, Lyu, Liu, Dai and Bai2023a; Thapsamut et al., Reference Thapsamut, Punsuvon and Areeprasert2023). According to the semiquantitative results, the amorphous percentage ranged from 30 to 39% in the geopolymer. This percentage of amorphous material can be attributed to both the formation of geopolymer, and to the formation of other components from the dehydroxylation of kaolinite and gibbsite.
In the diffractograms of geopolymers G1 and G2, cured at the highest temperature (450°C), the characteristic peaks of gibbsite and goethite were not present. On the other hand, the amorphous percentage was greater than those of the G4 and G5 geopolymers, which were produced at the same Na/Al ratio but cured at 100°C. This difference in the amorphous percentage explained the decomposition of gibbsite and goethite (loss of structural water), at 270°C and 340°C, respectively. The dehydroxylation of goethite resulted in the formation of hematite (Schulze and Schwertmann, Reference Schulze and Schwertmann1984), while gibbsite decomposed to amorphous ρ-Al2O3 (Colombo and Violante, Reference Colombo and Violante1996), as shown by the high percentage of amorphous phases in the G1 and G2 geopolymers cured at 450°C (Table 5).
Comparing the mineralogical composition of geopolymers G1, G2, G4, and G5 (Table 5), the formation of hydrosodalite was favored at a Na/Al ratio of 0.8 (highest Na/Al ratio), regardless of the curing temperature used. In contrast, the formation of zeolite (zeolite Na-ZK-4) was only observed at a Na/Al ratio of 0.6 (geopolymers G2 and G4).
FTIR spectra
The FTIR results for the geopolymer (Fig. 7) revealed the permanence of the bands exhibited in the raw sample (3622–3620 cm–1, 370–3695 cm–1, 3525 cm–1, 3464–3452 cm–1, 1660–1652 cm–1, 1116–1100 cm–1, 1006–1004 cm–1, 914–910 cm–1, 702–696 cm–1, 543–540 cm–1, 470–468 cm–1). These bands were associated with the presence of O-H (3622–3620 cm–1, 370–3695 cm–1, 3525 cm–1, 3464–3452 cm–1), H-OH (1660–1637 cm–1), Si-O-Si (1006–1004 cm–1), Al-OH (914–910 cm–1), Si-O-Al (702–696 cm–1 and 470–468 cm–1), and Fe-O (543–540 cm–1) groups.
FTIR spectra of the geopolymer samples.

The absorbance of the OH band in the 3622–3420 cm⁻¹ region was associated with the increase in temperature, attributed to the structural decomposition of gibbsite, goethite, and kaolinite. The same behavior is observed in the region 1660–1637 cm⁻¹, which corresponds to the presence of surface water.
The difference in band intensity at 1004 cm⁻¹ was a result of the increased dissolution of aluminosilicates, confirming the activation of the geopolymer/alkali-activated (Gomes Silveira et al., Reference Gomes Silveira, Figueiredo Martins, Bezerra and Gabriel da Silva Araújo2022). The absorbance intensity changes among the geopolymers. The band at 794 cm⁻¹ is slightly shifted compared with that of ALB-1 in nature, in addition to exhibiting a change in intensity, which is indicative of the formation of the geopolymers (González-García et al., Reference González-García, Téllez-Jurado, Jiménez-Álvarez, Zarazua-Villalobos and Balmori-Ramírez2022). In addition, in ALB-1, the broad bands at 538 cm⁻¹ and at 468 cm⁻¹ were also in the geopolymer spectra. The thinning of the 538 cm⁻¹ band, along with its shift to 543–540 cm⁻¹, and the shift of the 468 cm⁻¹ band to 468–470 cm⁻¹, compared with the spectrum of the raw sample, indicate the formation of hydrosodalites/zeolites (Salam et al., Reference Salam, Mokhtar, Albukhari, Baamer, Palmisano, AlHammadi and Abukhadra2021), agreeing with the XRD results. The absorption band in the region of 1035–1031 cm⁻¹ corresponds to the vibration of Si-O-T bonds (Li et al., Reference Li, Luo, Qin, Liu, Duan, Jing, Zhang and Liu2022).
FTIR spectra of the ‘white spot’ formed in the geopolymer
The FTIR spectrum of the ‘white spot’ that appeared in the geopolymer (Fig. 8) presented an absorption band at 1413 cm⁻¹. This is attributed to the asymmetric stretching of C-O-C bonds, resulting from the formation of Na₂CO₃ or NaHCO₃ due to the reaction of CO₂ from the environment with excess NaOH that remained unreacted during the synthesis process (Baran et al., Reference Baran, Nazarko, Włosińska, Kanciruk and Zarębska2021; dos Santos et al., Reference dos Santos, Pontin, Ponzi, Stepanha, Martel, Schütz, Einloft and Dalla Vecchia2021; Vafaei et al., Reference Vafaei, Allahverdi, Dong, Bassim and Mahinroosta2021 Thapsamut et al., Reference Thapsamut, Punsuvon and Areeprasert2023; Statkauskas et al., Reference Statkauskas, Vaičiukynienė, Grinys and Paul Borg2023a). The presence of the band at 1637 cm⁻¹ can be attributed to O-H bonds from physically adsorbed water on the sample surface, which may interact with the C-O-C bond of sodium bicarbonate (Belin et al., Reference Belin, Mve Mfoumou, Mignard and Pouilloux2013; Huang et al., Reference Huang, Ji, Li, Hou and Jin2018; Bekhti et al., Reference Bekhti, Boucheffa, Blal and Travert2021). Absorption in the 3465 cm⁻¹ region is characteristic of the stretching of O-H bonds, related to the presence of sodium bicarbonate (NaHCO3) (Fiore et al., Reference Fiore, Scalici, Nicoletti, Vitale, Prestipino and Valenza2016).
FTIR spectrum of the white spot.

Visual inspection, SEM image, and EDS of the ‘white spot’ formed in the geopolymer
The white spots observed in the geopolymer were further investigated with SEM-EDS. The microscopic images showed that these samples had moderate internal cracks and an irregular surface. The EDS results showed the percentage of element C (13.44%) attributable to sodium bicarbonate. See Fig. 9.
Macroscopic and microscopic images, and EDS result.

Compressive strength
The compressive strength results for the geopolymer (Fig. 10; see also Table SI in the Supplementary material) varied from 8.99 to 41.89 MPa. The data error was estimated as ±0.51 by the replicates of the central point as a recommendation on Doehlert design (experiments 7, 8, and 9). The lowest strength (8.99 MPa) was obtained at a Na/Al ratio of 0.9 and curing temperature of 275°C (G6), while the highest value was achieved at a Na/Al ratio of 0.6 and curing temperature of 100°C (G4).
Compressive strength of the geopolymer samples.

The compressive strength results followed a trend inversely proportional to the Na/Al molar ratio and the percentage of hydrosodalite formed in the geopolymer. For example, the lowest strength values were obtained at ratios of 0.8 and 0.9 (8.99, 19.51 (G6), and 23.08 MPa (G5)), corresponding to the highest percentages of hydrosodalite (Table 5). Based on these results, the formation of a considerable percentage of hydrosodalite deteriorated the internal structure of the geopolymer samples and affected their strength (Hui-Teng et al., Reference Hui-Teng, Cheng-Yong, Yun-Ming, Abdullah, Pakawanit, Bayuaji, Yong-Sing, Zulkifly, Wan-En, Yong-Jie and Shee-Ween2022). The increasing formation of hydrosodalite and the expansion of this crystalline phase disturbed the internal structure of the geopolymer, and deteriorated the geopolymer’s compressive strength (Lee et al., Reference Lee, Koh, An and Ryu2017). Another factor that may have contributed to lower resistance was the carbonatization process (Fig. 8). This occurred primarily at the highest ratios studied (0.8 and 0.9) due to the excess NaOH that remained unreacted during the synthesis process (Mendes et al., Reference Mendes, Elyseu, Nieves, Zaccaron, Bernardin and Angioletto2021; Statkauskas et al., Reference Statkauskas, Vaičiukynienė, Grinys and Paul Borg2023a).
The highest compressive strength values were obtained at the lowest ratios (0.5, 0.6, and 0.7). At these ratios, the percentage of all hydrosodalite types was much lower than that at ratios of 0.8 and 0.9, which favored strength gain.
Statistical parameters
Regression analysis was performed to evaluate the effect of Na/Al ratio and temperature on the compressive strength of the geopolymer (Table SI). From the analysis of variance (ANOVA) results (Table SII in the Supplementary material), the regression model fails the lack of fit test because the ratio of the calculated pure error F-value (9.34)/tabulated F-value (18.48) was <1. The model also showed a good regression according to the ratio of the model F-value (192.15)/tabulated F-value (9.03). The correlation coefficient (explained variation, 0.99) and adjusted R 2 (maximum explained variation, 0.99) values were close to 1, reinforcing the suggestion that the studied model was statistically adequate.
Considering the points highlighted above, the coefficients of the model were calculated based on the squared sum of the residuals (0.98) and a t-value of 4.3027, with 95% confidence.
Coefficients of the RM (regression model)
The coefficients of the model were calculated: X0, X1, X2, X12, X22, and (X1×X2) (Fig. SI in the Supplementary material). Among the calculated coefficients and their confidence intervals, the coefficients X12 (T2) and (X1×X2) ((Na/Al)×T) were not significant for the model.
New regression model with only significant coefficients
The ANOVA results (Table SIII in the Supplementary material) for the recalculated model, which includes only the significant coefficients, indicated that the model failed the lack-of-fit test (calculated F (0.26)/tabulated F (19.19) is less than 1) and presented a good regression. The R 2 value (0.98) shows that the regression equation is satisfactory for predicting the mechanical compressive strength within the experimental parameters studied. The R 2 value implies that 98% of the variation in mechanical strength was described by the independent variables.
The coefficients of the model were calculated based on the squared sum of the residuals (2.36) and a t-value of 2.7764 with 95% confidence.
Coefficients of the new regression model (RM)
The coefficients of the new model (Fig. SII in the Supplementary material) presented four calculated coefficients: X0, X1, X2, and X22. All coefficients of the model were significant. The model equation can be described as follows:
Mechanical strength RM = 33.44 – 2.70X1 – 16.42X2 – 9.17X12.
Response surface and optimization of mechanical strength
The response surface for mechanical compressive strength as a function of the two experimental factors studied (Na/Al ratio and temperature) (Fig. 11) indicates that the optimal experimental region (40–45 MPa) is achieved within Na/Al ratios ranging from 0.5 to 0.6 and temperatures between 100 and 275°C. The optimal region includes conditions that have already been tested in experiments 3 (Na/Al 0.5, 275°C) and 4 (Na/Al 0.6, 100°C); however, considering energy costs, the conditions of experiment 4 are preferable, as the resulting material exhibits high resistance at low temperature.
Response surface plot for compressive strength.

Conclusions
The bauxite mine tailings consist mainly of kaolinite (~70%), along with minor mineral phases. The poorly ordered crystalline structure of kaolinite from the clay tailings performed better in the geopolymer synthesis than kaolin with highly crystalline kaolinite.
The specified parameters examined for geopolymer synthesis facilitated the formation of new crystalline phases, amorphous compounds, and sodium carbonate/sodium bicarbonate. This phase assemblage influenced significantly the mechanical strength of the resulting geopolymers. Geopolymers with high compressive strengths were produced at Na/Al ratios of 0.5–0.6 (40.56–41.89 MPa) and temperatures ranging from 100 to 250°C using the bauxite clayey residues.
This research shows that geopolymers with good mechanical strength were produced using the clay tailing residues at lower temperatures and with lower NaOH concentration when compared with usual geopolymers. In summary, this research paves the way for producing geopolymers from bauxite tailings as a sustainable approach, offering innovative solutions for eco-friendly geopolymer development.
Supplementary material
The supplementary material for this article can be found at http://doi.org/10.1017/cmn.2024.43.
Author contributions
Igor Alexandre Rocha Barreto: Conceptualization, Methodology, Validation, Investigation, Formal analysis, Data curation, Writing - original draft, Writing - review & editing, Visualization; Marcondes Lima da Costa: Conceptualization, Methodology, Investigation, Writing - review & editing, Visualization, Funding acquisition, Project administration; Leonardo Boiadeiro Ayres Negrão: Methodology, Investigation, Writing - review & editing, Visualization; Hélcio J. Prazeres Filho: Review, Visualization, Funding acquisition, Project administration.
Acknowledgements
We thank ‘Coordination for the Improvement of Higher Education Personnel’ (CAPES) for providing scholarship assistance, the Hydro Company for providing the raw materials used in this study and financial support with the field work, and the Dean of Research and Graduate Studies (PROPESP) of the Universidade Federal do Pará (UFPA) for financial supporting the translation of this manuscript.
Financial support
This research was supported by Hydro Company and the Dean of Research and Graduate Studies (PROPESP) of the Universidade Federal do Pará (UFPA).
Competing interest
The authors declare none.
Data availability statement
The data supporting this study are included within the article and/or supporting materials