I. INTRODUCTION
Surface roughness defect has been proved as a main factor Reference Farzad, Mohamadreza and Jamshid1–Reference Wang, Zhang, Sun, Liu, Shi and Lu4 causing the high-cycle fatigue failure that can’t be neglected in the real engineering practice, especially for the high strength metal FV520B-I. Roughness index value R a has numerous advantages: it can reflect not only the surface micro geometry, but also the profile peak of the surface morphology, whose information make the data process easy. Therefore, the R y can be regarded as the deepest groove depth at the minimum cross-section of the specimen, the probability of R y appearing at the minimum cross-section of a specimen was small. And it has been widely accepted that R a is more representative than the other estimated values, like R y, so R a is widely used as the quantitative expression of the surface roughness defect to establish the high-cycle fatigue life model of FV520B-I, involving R a as a main variable.
FV520B-I possesses numerous good mechanical properties: high strength, corrosion resistance, abrasive resistance, good welding characteristics, etc. Reference Zhang, Wang, Wang, Liu and Li5 These properties lead to FV520B-I’s wide adoptions in the manufacturing of all different kinds of large-scale mechanical equipment. Reference Wang, Zhang, Liu, Sun and Lu3,Reference Wang, Zhang, Sun, Liu, Shi and Lu4 In normal working conditions, fatigue failure is irreversible. Also, the failure happens instantaneously without ‘warning’ that can cause accident, personal injury, and unexpected economic loss. Reference Mao, Liu, Li, Wei, Zhang, Zou, Tian and Wu6–Reference Jiang, Liu, Li, Wu and Ding10 Many real failure cases show that the fatigue failure also occurs on mechanical parts with smooth surface without obvious surface defects. The fatigue failure, in such care, is actually caused by a deep groove mark due to machining process that can be quantitatively expressed as the surface roughness. Reference Wang, Zhang, Sun, Liu, Shi and Lu4 According to fracture mechanics, the high extent of surface roughness results in deep groove mark, and small radius of bottom grain leads to high stress concentration, which will weaken the ability to resist fatigue failure and therefore specifically decline the fatigue strength of the material. The fatigue crack initiation and fatigue failure prefer a place with low fatigue strength and propagates rapidly until failure. Reference Wang, Zhang, Liu, Sun and Lu3 So it is essential to study the mechanism of high-cycle fatigue behavior because of surface roughness to model the high-cycle fatigue life and failure prediction.
Quite a few theories have been proposed based on the investigation of fatigue failure caused by surface roughness. Murakami Reference Murakami, Kodama and Konuma11–Reference Murakami13 proposed a conditional fatigue strength model for high strength, and this model has been widely adopted in the fatigue strength and life prediction research. Sun Reference Sun and Qian14 put forward that the effect of the surface roughness would promote the fatigue failure that the fatigue crack initiation life was shortened and the fatigue failure would occur without the crack initiation stage. Tveten Reference As, Kallerud, Tveten and Holme15 treated surface roughness as micro-crack to investigate the relationship among crack initiation location, stress concentration factor, and stress field, based on the experiment and finite element analysis. Andrews Reference Andrews and Sehitoglu16 put forward that surface roughness was equivalent to the micro-crack in the investigation of the influence of surface roughness on fatigue life. It is clear that these theories are beneficial to the study of the fatigue property affected by surface roughness.
Moreover, Zhang Reference Zhang, Wang, Wang, Liu and Li2 and Wang Reference Wang, Zhang, Sun, Liu, Shi and Lu4 have proposed two very-high-cycle fatigue life models of FV520B-I with surface roughness based on the Paris formula and Tanaka & Mura’s dislocation model These models has been used to predict the very high-cycle fatigue life, but they are not suitable for the high-cycle fatigue status due to the difference of failure mechanism between the common fatigue and very high-cycle fatigue, so it is essential to establish a NEW high-cycle fatigue life model for FV520B-I considering the surface roughness which is critical to the application and remanufacturing engineering of FV520B-I.
Main research in this paper focuses on analysis of the HCF behavior and the establishment of high-cycle fatigue life model with surface roughness, through designed fatigue experiment of FV520B-I specimen with different surface roughness. The fracture surface and evolution are observed with time and the mechanism of the fatigue behavior is analyzed based on the observations of the microstructure and morphology of crack in initiation and crack propagation region. A NEW high-cycle fatigue life model with surface roughness is proposed with the combination of the Murakami conditional fatigue strength model and the classic Basquin formula, which is different with the reported models. The model parameters are estimated with the experimental data and the relationship between the fatigue strength coefficient and stress amplitude has been determined for FV520B-I. The proposed model for FV520B-I has also been validated by a comparison between theoretical model results and the laboratory experiment data. A frame work has been done in establishing the analytical model of fatigue property of FV520B-I affected by surface roughness, which will enhance the accuracy of the fatigue life prediction in engineering practice. This experimental study is valuable in engineering and also very supportive to future theoretical development of FV520B-I fatigue life model.
II. THE FATIGUE EXPERIMENT
A. Material
The chemical composition of FV520B-I specimen used in the experiment is shown in Table I. The heat treatment process of the specimen is: solution treatment for 1–1.5 h, air cooling; intermediate treatment in the range of 750–850 °C for 3–3.5 h, oil cooling; aging treatment in the range of 470 ± 10 °C for 4–5 h and air cooling.
Chemical composition of specimen (wt%).

The mechanical property of FV520B-I are shown in Table II.
Mechanical property of FV520B-I.

B. The specimen
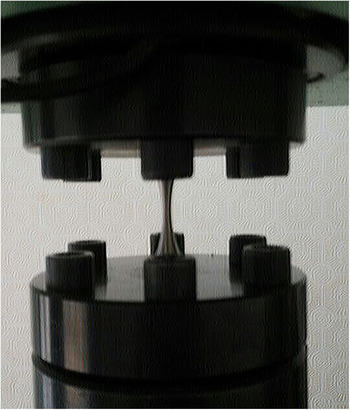
The fatigue experiment was carried out in PLG-100 fatigue test system with an operating loading frequency of 140 Hz, this is different from the reported models (20 kHz), Reference Zhang, Wang, Wang, Liu and Li2,Reference Wang, Zhang, Sun, Liu, Shi and Lu4 the procedure followed the ASTM (American Society for Testing Material) standard. The design of the specimen should be such that failure occurs in the test section (reduced area as shown in Fig. 1). The standard also indicates that the test machines should have a force-monitoring system, such as a transducer mounted in series with the specimen, or mounted on the specimen itself, unless the use of such a system is impractical due to space or other limitations. And continue the tests until the specimen failure criterion is attained or until a predetermined number of cycles has been applied to the specimen. Failure may be defined as complete separation, as a visible crack at a specified magnification, as a crack of certain dimensions, or by some other criterion.
The test system.

The main working principles of PLG-100 are the magnetic resonance and the optimization of LC oscillation circuit, with the advantage of low energy consumption and no abrasion. This system can provide both dynamic load and static load respectively, without mutual interference. It has been widely used in the conventional fatigue test and the test accuracy and reliability have been recognized. The test system used in this paper is shown in Fig. 1.
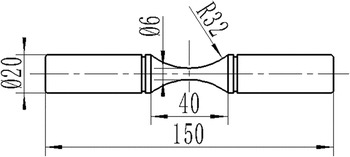
The specimen with different surface roughness were used, the experiments were carried out under room temperature (20 °C) and the mean stress was set to zero which presented that the stress ratio r = −1. Standard hourglass type fatigue test specimen with a minimum diameter of 6 mm was used in the experiment. The details of the geometrical shape are shown in Fig. 2.
The specimen.

III. RESULTS
A. The experimental data
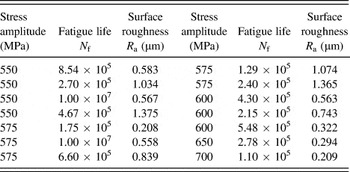
The data including the stress amplitude σa, fatigue life N f, and the surface roughness R a as shown in Table III. The maximum stress amplitude is 700 MPa and the minimum one is 550 MPa, the interval is 25 MPa. The experimental fatigue life mainly concentrated in the HCF (105 < N f < 107), only two fatigue life data are more than 107 cycles. All the cracks initiated from the surface.
Experimental data.

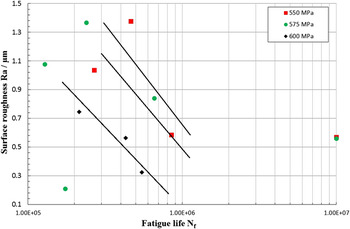
It is clear that each determined load amplitude will correspond to a certain curve relationship between fatigue life and surface roughness. The data obtained from the experiment in Table III show a big discreteness, so the appropriate experimental data with the stress amplitude of 550, 575, and 600 MPa (650 and 700 MPa, each has one set experimental data, so these are ignored) are used to establish high-cycle fatigue life model for FV520B-I, taking surface roughness as a main variable. The distribution of the surface roughness and fatigue life are displayed in Fig. 3.
Distribution of surface roughness and fatigue life under different stress amplitude.

The experimental data in Table III and Fig. 3 show that the fatigue life declines with the increase of the surface roughness under the same stress amplitude, and the correlation moves downward with the increase of stress amplitude. The straight line in Fig. 3 only shows the distribution trend of the experimental data. It doesn’t mean the surface roughness and the fatigue life satisfy a linear relation statistically.
Another phenomenon is observed that the dispersion of the correlation between fatigue life and surface roughness is large, but the experimental data with high stress amplitude (600 MPa) will have a smaller discreteness than the other two stress amplitude situations (575 and 550 MPa), which implies that the stress amplitude will have an influence on the fatigue life model of FV520B-I as a function of surface roughness. But this influence may not affect the relationship between the surface roughness and high-cycle fatigue life directly, it will have a significant influence on the fatigue strength coefficient. This assumption will be analyzed and proved in the follow up study.
B. Observations of crack initiation sites
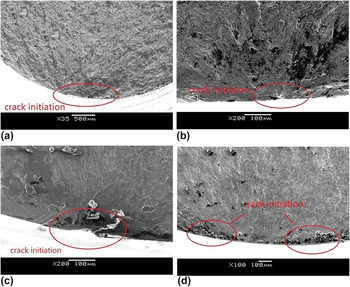
Surface roughness is an important index of evaluating the surface quality and microcosmic error of geometrical shape of an FV520B-I specimen. The essence of the surface roughness is a groove due to the machining process, which can be treated as a “fatigue crack”. High surface roughness means the “big crack” and severe stress concentration, which will result in the decrease of fatigue resistibility and easiness of fatigue failure. Therefore, the fatigue crack initiation always prefers the sites with high surface roughness. The observations of fracture surface under 575 MPa are chosen as examples to describe the effect of surface roughness on the high-cycle fatigue property of FV520B-I. Figures 4(a)–4(d) show the morphology characteristics around the crack initiation sites.
Crack initiation sites: (a) 575 MPa, 0.208 μm; (b) 575 MPa, 0.839 μm; (c) 575 MPa, 1.074 μm; (d) 575 MPa, 1.65 μm.

It has been mentioned above that the difference between the specimens used in the experiment is the surface roughness, and no obvious defects exit in the surface. The figures above also show that neither GBF (Granular Bright Facet) nor the “fish-eye” is observed in the fracture section of the specimen, which implies that failure occurs only because the surface roughness is the fracture allocated as the primary factor, resulting in the high-cycle failure of FV520B-I in the study. Another point from Figs. 4(a)–4(d) show that the morphology of the matrix material around the crack initiation site become more and more corrupt with the increase of the surface roughness, from 0.208 to 1.65 μm.
Also, the morphology of the fatigue crack, caused by the surface roughness, can be observed more clearly with the progress from Figs. 4(a)–4(d). When R a is 0.208 and 0.839 μm, only one crack initiation site is observed as shown in Figs. 4(a) and 4(b). With the surface roughness continuous increasing to 1.074 and 1.65 μm, the crack initiation morphology are more obvious, two fatigue crack initiation sites are located as shown in Figs. 4 (c) and (d). This phenomenon is the result of the increase in the surface roughness value, then the stress concentration on the specimen surface also increases, so the surface crack more easily initiates.
These observations are caused by the effect of the surface roughness increasing. On the crack initiation stage, the plastic deformation of the matrix material around the crack initiation sites progresses faster and faster, and the crack initiation procedure is promoted. The matrix material has less reaction time to rapid crack initiation and after a short crack initiation stage. So the fatigue crack initiated from the surface roughness defect and the large surface roughness will have more opportunities to cause the fracture.
C. Observations of crack propagation region
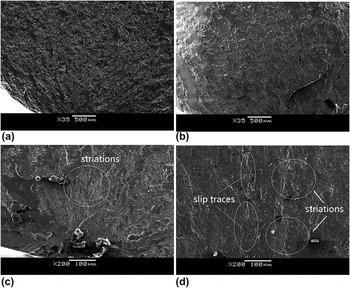
Figures 5(a)–5(d) are the observed examples of crack propagation regions.
Crack propagation regions: (a) 575 MPa, 0.208 μm; (b) 575 MPa, 0.839 μm; (c) 575 MPa, 1.074 μm; (d) 575 MPa, 1.65 μm.

Some different observations of the fatigue fracture section are obtained. Figures 5(a) and 5(b) are the observations of the macro morphology of the crack propagation region. It has the same macro morphology of crack propagation with the normal fracture surface, caused by the significant surface defect that the crack propagates from the crack initiation site to the other side of the specimen as the radial striation. But no obvious fatigue striations appear in the fracture sections. With the increase of the surface roughness in Figs. 5(c) and 5(d), the characteristics of the inter-granular fracture are observed evidently in the fracture section, including the discontinuous short fatigue striations, irregular fracture characteristics, and several slip band characteristics. But no common “river-like” long fatigue striations are detected.
IV. HIGH-CYCLE FATIGUE LIFE OF FV520B-I AFFECTED BY SURFACE ROUGHNESS
A. The life prediction model
The current existing models have been limited to their own specific application areas. There is not an authoritative model that can be used for fatigue life prediction of all different kinds of materials and working conditions. Especially, there is not a particular model for the high-cycle fatigue life prediction of FV520B-I with surface roughness.
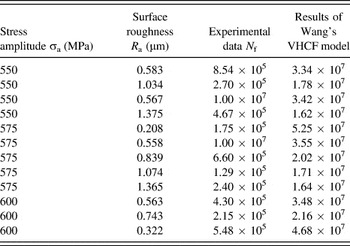
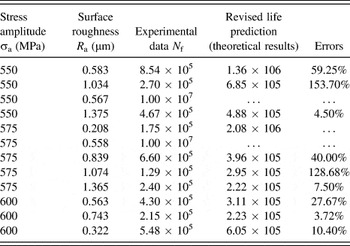
Although the mechanism of the very-high-cycle fatigue (VHCF) (N f > 107) and high-cycle fatigue (HCF) (105 < N f < 107) is different, Wang’s model Reference Wang, Zhang, Sun, Liu, Shi and Lu4 for VHCF still has to be tested on whether this model can be used to predict the high-cycle fatigue life of FV520B-I affected by surface roughness. Table IV shows the experimental data and the fatigue life calculated by Wang’s VHCF model. Reference Wang, Zhang, Sun, Liu, Shi and Lu4
Wang’s VHCF model and the experimental data.

It can be seen that the fatigue life calculated by Wang’s VHCF model is 100 times (two orders) bigger than the experimental data, so this model isn’t suitable for the high-cycle fatigue situation (HCF). And with the consideration of the observation analysis in 3.1 and 3.2, the surface roughness defect is the main factor causing the fatigue failure, no high-cycle fatigue life prediction with the surface roughness as the main variables is proposed. So, it is necessary to establish a new fatigue life prediction model for FV520B-I with surface roughness in HCF regime, which is different from the reported models.
According to the existing fatigue study, the fatigue life model means a quantitative relation between the fatigue defect size and the fatigue life. So, before establishing FV520B-I fatigue life model, the surface roughness value R
a (R
a is used as the quantitative expression of the surface roughness defect) should be converted into the fatigue defect. Murakami
Reference Murakami, Kodama and Konuma11,Reference Murakami13
presented number of fatigue tests with all kinds of metal to investigate the relationship between surface roughness R
a and equivalent surface defect size
 $\sqrt {{A_{\rm{R}}}}$
, and an equation expressing this relation was proposed:
 $$\sqrt {{A_{\rm{R}}}} = 2.97{R_{\rm{a}}}\quad .$$
Where
 $\sqrt {{A_{\rm{R}}}}$
is the surface defect size, R
a is surface roughness value. The fatigue strength of surface condition can be calculated by the widely applied Murakami empirical condition fatigue strength formula.
Reference Murakami, Kodama and Konuma11
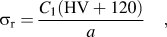 $${\sigma _{\rm{r}}} = {{{C_1}\left( {{\rm{HV}} + 120} \right)} \over a}\quad ,$$
where σr is condition fatigue strength at stress ratio r; C
1 is location parameter, C
1 = 1.43; HV is the Vickers hardness, HV = 380 kgf/mm2; a is the fatigue defect size, here
 $a = \sqrt {{A_{\rm{R}}}}$
.
With the consideration of stress ratio in real working condition and the fatigue strength with surface roughness Eq. (2), the modified condition fatigue strength formula is written as:
 $${\sigma _{\rm{r}}} = {{{C_1}\left( {{\rm{HV}} + 120} \right)} \over {{{\left( {2.97{R_{\rm{a}}}} \right)}^{1/6}}}}{\left( {{{1 - r} \over 2}} \right)^\alpha }\quad ,$$
where r is the stress ratio; α is material parameter related to Vickers hardness (HV), α = 0.226 + HV × 10−4 = 0.264. Substituting the surface roughness and the parameters into Eq. (3), the condition fatigue strength which is determined by the surface roughness can be obtained.
Equation (4) below is commonly called Basquin formula in fatigue analysis. Basquin formula
Reference Sun and Qian14
has numerous advantages such as simple calculation process, reliable calculation results, and extensive applicability. It has been widely used to describe the relation between fatigue strength
 ${\sigma _{\rm{a}}}$
(condition fatigue strength
 ${\sigma _{\rm{r}}}$
) and fatigue life N
f, and the continuous decline stage of the S–N curve can be expressed by the Basquin formula effectively in HCF. The Basquin formula
Reference Wang and Gao17
can be expressed as:
 $${\sigma _{\rm{a}}} = {\sigma '_{\rm{f}}}{\left( {2{N_{\rm{f}}}} \right)^b}\quad ,$$
where σa is conditional fatigue strength, that is the fatigue strength of the specimen with fatigue defect; N
f is the fatigue life;
 ${\sigma '_{\rm{f}}}$
is fatigue strength coefficient; b is fatigue strength index. The parameters
 ${\sigma '_{\rm{f}}}$
and b are constants or the function related to the stress amplitude or material property. The traditional fatigue strength is for the material or the specimen without the fatigue defect. But the conditional fatigue strength
Reference Murakami and Endo12
means the fatigue strength of the specimen when the specimen has the fatigue defect, such as the surface roughness defect in this paper, which is equal to the maximum stress amplitude that won’t cause the fatigue failure. But when the specimen with different defect size, the corresponding conditional fatigue strength is smaller than the experimental stress amplitude. So the assumption is proposed that the stress amplitude in Eq. (4) can be replaced by the condition fatigue strength σr, which will be more close to the real material mechanical state. So the stress amplitude σa in Eq. (4) can be replaced by the condition fatigue strength σr,
Reference Murakami and Endo12
and Eq. (4) can be re-written as the basic fatigue life prediction model:
 $${\sigma '_{\rm{f}}}{\left( {2{N_{\rm{f}}}} \right)^b} = {{{C_1}\left( {{\rm{HV}} + 120} \right)} \over {{{\left( {2.97{R_{\rm{a}}}} \right)}^{1/6}}}}{\left( {{{1 - r} \over 2}} \right)^\alpha }\quad .$$
With the combination of Eqs. (2)–(4), quantitative relation between R
a and the fatigue life N
f is obtained. This basic model is established based on the classic fracture mechanics and mathematical derivations, so its suitability in the high-cycle fatigue life prediction of FV520B-I is assured. But there are two unknown model parameters related to FV20B-I, including fatigue strength coefficient
 ${\sigma '_{\rm{f}}}$
and fatigue strength index b. There are not common values can be adopted for the model directly in predicting the high-cycle fatigue life with surface roughness. These two parameters are essential in the establishment of the life model. A small change of them will result in a significant alteration on the fatigue life prediction results. This also implies that there is not a common model that can cover different materials for life prediction, each metal will have its own life prediction model with particular parameters.
Reference Wang, Zhang, Sun, Liu, Shi and Lu4
So it is key work to identify the unknown parameters from the designed experiment data to obtain a specific high-cycle fatigue life model for FV520B-I with surface roughness.
Experimental data in Table III are diversity, not following certain rules. It has been widely accepted in research that there is not a simple linear relationship between surface roughness and high-cycle fatigue life, and as talked in 3.1 that the straight line in Fig. 2 doesn’t mean the surface roughness and the fatigue life satisfy a linear relation statistically. A nonlinear fitting algorithm should be adopted to identify the unknown parameters. Fitting algorithm uses continuous curves or analytical expressions to represent discrete data and the functional relationship between the variables. The underdeveloped base model is established as Eq. (5), and the iterative computation is used to determine the value of
 ${\sigma '_{\rm{f}}}$
and b for the function
 $f\left( {{a_i},{{N'}_{{\rm{f}}i}}} \right)$
by the minimizing operation of Eq. (6), i.e.,
 $$({\sigma '_{\rm{f}}},b) = \arg \,\mathop {\min }\limits_{{\sigma '_{\rm{f}}},b} \sum\limits_{i = 1}^2 {{{\left( {f\left( {{R_{{\rm{a}}i}},{\mathop {N'_{{\rm{f}}i}}}} \right) - {N_i}} \right)}^2}\quad } .$$
By substituting experimental data (fatigue life N f, surface roughness value R a in Table III) into Eq. (6), the estimated results are calculated in Table V.
Fitting results for the parameters.
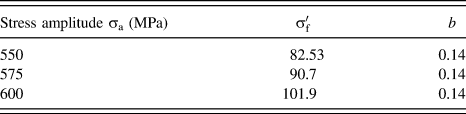
So the high-cycle fatigue life prediction model for FV520B with surface roughness can be obtained by substituting these two parameters into the underdeveloped basic model as shown in Eq. (7):
 $$\left\{ {\matrix{ {{{{C_1}\left( {{\rm{HV}} + 120} \right)} \over {{{\left( {2.97{R_{\rm{a}}}} \right)}^{{1 \over 6}}}}}{{\left( {{{1 - r} \over 2}} \right)}^\alpha } = 82.53{{\left( {2{N_{\rm{f}}}} \right)}^{0.14}}} & {550\;{\rm{MPa}}} \cr {{{{C_1}\left( {{\rm{HV}} + 120} \right)} \over {{{\left( {2.97{R_{\rm{a}}}} \right)}^{{1 \over 6}}}}}{{\left( {{{1 - r} \over 2}} \right)}^\alpha } = 90.70{{\left( {2{N_{\rm{f}}}} \right)}^{0.14}}} & {575\;{\rm{MPa}}} \cr {{{{C_1}\left( {{\rm{HV}} + 120} \right)} \over {{{\left( {2.97{R_{\rm{a}}}} \right)}^{{1 \over 6}}}}}{{\left( {{{1 - r} \over 2}} \right)}^\alpha } = 101.90{{\left( {2{N_{\rm{f}}}} \right)}^{0.14}}} & {600\;{\rm{MPa}}} \cr} } \right.$$
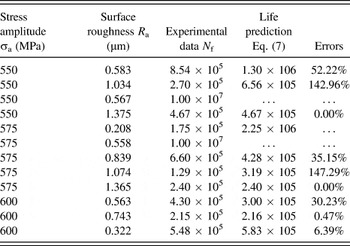
The theoretical results calculated by substituting the appropriate experimental data into Eq. (7), and the errors between the results from experimental estimates and theoretical calculation are displayed in Table VI.
Errors between results from experiment and life prediction model.

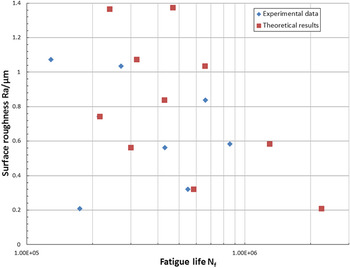
Figure 6 shows the distribution of the experimental data and theoretical calculations, including the fatigue life N f and surface roughness R a.
Distribution of the experimental data and theoretical calculations.

As shown in Table VI and Fig. 6, errors exist between the results from experiment and the theoretical calculations. All the errors are smaller than one order of magnitude, within an acceptable range in engineering practice.
B. The fatigue strength coefficient
 ${\sigma '_{\rm{f}}}$

As talked in 3.1, the assumption that effectiveness of stress amplitude may not affect the relationship between the surface roughness and high-cycle fatigue life directly, but it will have a significant influence on the fatigue strength coefficient. This assumption wasn’t reported before, so it is novel in the metal fatigue study, and it should be tested by the fatigue experimental data.
The estimated results in Table V indicate that the fatigue strength index b is a constant, but fatigue strength coefficient
 ${\sigma '_{\rm{f}}}$
is a variable, related to the stress amplitude σa. The fatigue strength coefficient
 ${\sigma '_{\rm{f}}}$
increases with the increase of stress amplitude σa. Figure 7 shows the distribution of the fatigue strength coefficient
 ${\sigma '_{\rm{f}}}$
and the corresponding stress amplitude σa.
Stress amplitude σa and fatigue strength coefficient
 ${\sigma '_{\rm{f}}}$
.

Figure 7 indicates that there is a positive correlation between the fatigue strength coefficient
 ${\sigma '_{\rm{f}}}$
and stress amplitude σa. According to the distribution in Fig. 7, assuming that the relationship between these two factors satisfy the linear relation, the modifier formula is expressed as Eq. (8).
 $${\sigma '_{\rm{f}}} = a{\sigma _{\rm{a}}} + c\quad .$$
After employing the same fitting algorithm [Eq. (6)] and the experimental data in Table V, the parameters in Eq. (7) are obtained, a = 0.387 and c = −131.05, the modifier formula is expressed as:
 $${\sigma '_{\rm{f}}} = 0.387{\sigma _{\rm{a}}} - 131.05\quad .$$
So the relation curve between the fatigue strength coefficient
 ${\sigma '_{\rm{f}}}$
and stress amplitude σa is shown in Fig. 8.
Stress amplitude σa-fatigue strength coefficient
 ${\sigma '_{\rm{f}}}$
curve.

According to Eq. (9), after substituting the stress amplitude into Eq. (9), the fatigue strength coefficient
 ${\sigma '_{\rm{f}}}$
calculated revised by modifier formula is displayed in Table VII.
The revised
 ${\sigma '_{\rm{f}}}$
.
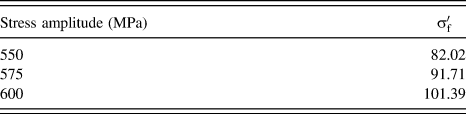
The fatigue strength coefficient
 ${\sigma '_{\rm{f}}}$
in Table VII is used to replace the data in Table V and substituted into Eq. (7) to calculate the high-cycle fatigue life of FV520B-I with surface roughness, as Eq. (10), the revised results are displayed in Table VIII.
 $$\!\left\{ {\matrix{ {{{{C_1}\left( {{\rm{HV}} + 120} \right)} \over {{{\left( {2.97{R_{\rm{a}}}} \right)}^{{1 \over 6}}}}}{{\left( {{{1 - r} \over 2}} \right)}^\alpha } = 82.02{{\left( {2{N_{\rm{f}}}} \right)}^{0.14}}} & {550\;{\rm{MPa}}} \cr {{{{C_1}\left( {{\rm{HV}} + 120} \right)} \over {{{\left( {2.97{R_a}} \right)}^{{1 \over 6}}}}}{{\left( {{{1 - r} \over 2}} \right)}^\alpha } = 91.71{{\left( {2{N_{\rm{f}}}} \right)}^{0.14}}} & {575\;{\rm{MPa}}} \cr {{{{C_1}\left( {{\rm{HV}} + 120} \right)} \over {{{\left( {2.97{R_{\rm{a}}}} \right)}^{{1 \over 6}}}}}{{\left( {{{1 - r} \over 2}} \right)}^\alpha } = 101.39{{\left( {2{N_{\rm{f}}}} \right)}^{0.14}}} & {600\;{\rm{MPa}}} \cr} } \right.$$
Errors between results from experiment and life prediction model.

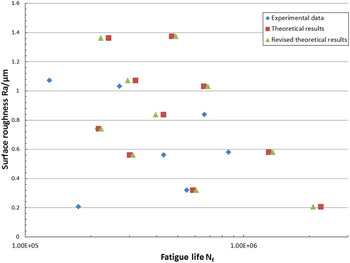
Figure 9 shows the distributions of the experimental data, the unrevised data (Table VI) and the revised data (Table VIII).
Distribution of the experimental data, theoretical results and revised theoretical results.

Comparing the data in Table VI, Table VIII, and the distribution of the data in Fig. 9, that four sets of errors become smaller than that in unrevised cases; three sets of errors of the revised data become a little bigger than that in unrevised case, but the errors are still in an acceptable range; the rest sets of the errors have no significant changes. So it can be seen that the errors from revised model have been reduced and this is helpful to the HCF life prediction in engineering practice. The high-cycle fatigue life calculated by the revised fatigue strength coefficient
 ${\sigma '_{\rm{f}}}$
is more close to the experimental value than that in using unrevised value. The revised factors improve the accuracy of fatigue life prediction. These factors can be used to predict the high-cycle fatigue life of FV520B-I with the effect of surface roughness. This also implies that a linear relation between
 ${\sigma '_{\rm{f}}}$
and σa [Eq. (9)] can work for the FV520B-I life prediction model. It is an innovation not only to FV520B-I fatigue study, but also to modeling of other metal, although more other experiments may need to verify the model consistency.
The revised model can be used to predict the high-cycle fatigue life of FV520B-I with the effect of affected of the surface roughness. The revised high-cycle fatigue life model for FV520B-I with surface roughness is finally expressed by substituting Eq. (9) into Eq. (5):
 $${N_{\rm{f}}} = {1 \over 2}\root {0.14} \of {{{572} \over {\left( {0.387{\sigma _{\rm{a}}} - 131.05} \right){{\left( {2.97{R_{\rm{a}}}} \right)}^{1/6}}}}{{\left( {{{1 - r} \over 2}} \right)}^{0.264}}} \quad .$$
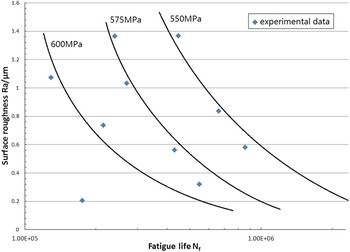
Each determined stress amplitude will correspond to a certain curve relationship between fatigue life N f and surface roughness. So according to Eq. (9) with three different load amplitudes, the curves of the model are depicted in Fig. 10, showing the surface roughness effect.
The relationship curve between the surface roughness and fatigue.

Model errors are defined as the difference between calculations from model and the experiment results. The errors may result from these resources:
-
(i) System errors (both Fatigue Test System and data acquisition system errors) will influence the life prediction process. Precision calibration is suggested to take each time before test. If an experiment was carried out without the calibration, little deviation of the measurement from displacement could cause a big error in the fatigue life result.
-
(ii) Although the specimens used in the experiment were from the same batch production, there are some differences among them. Since these differences are difficult to tell and often neglected in the experiment and following analysis process, the results will contain mistreated errors.
-
(iii) The calculation results are not totally comprehensive. The existence of some undetected defects may also lead to errors. Interference factors such as humidity and dust during the experiment will affect the precision and result in errors.
-
(iv) FV520B-I may have a special fatigue property, which may be very sensitive to the surface roughness and stress amplitude i.e., small change of stress amplitude in experiment will result in a huge fluctuation on the experimental results. But “sensitivity” is just a hypothesis at this stage and more effort is needed to look into it.
This mixture of errors leads to the resultant error between the theoretical value and experimental result. As discussed above, although the errors exist, they are within an acceptable tolerance, and the model prediction is smaller than that in experiment result that leads to a conservative estimation from model, which will be resulting in a safer application. This fatigue life and strength models can be beneficial to providing a meaningful prognostic for preventive maintenance, and be used for fatigue analysis of FV520B-I to avoid sudden catastrophic failure of mechanical systems in real application.
V. CONCLUSIONS
A few conclusions can be drawn from this fatigue study.
-
(1) Surface roughness has a significant influence on the morphology characteristics of the matrix materials around the crack initiation sites; the morphology becomes worse with the increasing of the surface roughness. High surface roughness will result in multiple crack initiations which will accelerate the fatigue failure of FV520B-I.
-
(2) With the comprehensive effect of surface roughness on the fatigue failure behavior of FV520B-I, no classic “river-like” continuous fatigue striations but the discontinuous short fatigue striations are obtained on the fracture section.
-
(3) The NEW assumption about the linear relationship between the fatigue strength coefficient
${\sigma '_{\rm{f}}}$
and the stress amplitude σa is proposed in Eq. (9). The modified formula of the relationship between
${\sigma '_{\rm{f}}}$
and σa is obtained based on the experimental data. This is novel in fatigue theory study. -
(4) A NEW high-cycle fatigue life model of FV520B-I with surface roughness is proposed with the combined application of Murakami condition fatigue strength model, Basquin formula, and laboratory experimental data in Eq. (11). The unknown model parameters for FV520B-I are identified and the model applicability is tested.


The underdeveloped base model [Eq. (5)] is obtained from the traditional fatigue theory and approved formulas, so this model is built only suitable for the FV520B-I life prediction. However, a model can be done for any specific metal by employing the fitting algorithm and the specific metal fatigue experiment data for identifying the model parameters. More experiments are still needed to verify the flexibility of this base model and the methodology to cover a range of metal materials. The correlation between the fatigue strength coefficient
 ${\sigma '_{\rm{f}}}$
and stress amplitude σa also need more experimental data of different material to test its validity.
Both the establishment of fatigue life model and the parameter determination are novel and a creative development to fatigue study of FV520B-I. This study can be a model guidance for FV520B-I in design and remanufacturing. The model accuracy of fatigue life prediction is well guaranteed for engineering applications. Further study and effort are also needed to test assumption of the linear relation between fatigue strength coefficient
 ${\sigma '_{\rm{f}}}$
and stress amplitude σa. These are the new study directions of fatigue study.
ACKNOWLEDGMENT
The authors gratefully acknowledge the financial support from the National Key Base Research and Development Program (No. 2011CB013401) and the National Natural Science Foundations of China (51375074, 51475077).