Introduction
Icebergs are massive floating bodies of freshwater ice whose height above the water level (or freeboard), length and width exceed correspondingly 5, 15 and 10 m (WMO 1970, Borodachev et al. Reference Borodachev, Gavrilo and Kazanskii1994). The origin of icebergs are glaciers in both Arctic and Antarctica. Icebergs that are not grounded after calving off the glacier drift in the polar waters along and off the coastline driven by ocean currents, waves and winds. Navigation safety is the primary reason for substantial efforts directed at timely detection and monitoring of icebergs in polar waters, as well as to characterize properly the frequency of iceberg occurrence and concentration. A number of research and practical applications also require information on iceberg morphometric characteristics, particularly on their shape and size. Besides its phenomenological value, this information helps to better estimate the freshwater balance (Jacobs et al. Reference Jacobs, Helmer, Doake, Jenkins and Frolich1992, Silva et al. Reference Silva, Bigg and Nicholls2006) and iceberg drift and decay processes (Hamley & Budd Reference Hamley and Budd1986, Jacka & Giles Reference Jacka and Giles2007, Scambos et al. Reference Scambos, Ross, Bauer, Yermolin, Skvarca, Long, Bohlander and Haran2008). It is also needed to characterize iceberg mechanical properties and to assess iceberg potential impact load on offshore oil and gas production facilities and structures.
World Meteorological Organization sea ice nomenclature (WMO 1970) includes five major iceberg shapes: tabular, domed, sloping, pinnacled and weathered icebergs. International Ice Patrol of the US Coast Guard refers to sloping and weathered icebergs correspondingly as wedged and drydocked (http://www.uscg-iip.org/FAQ/Icebergs_5.shtml). Characteristics of the calving source and the mechanism of calving are the primary factors that determine the initial shape of icebergs. Tabular icebergs are formed through calving off ice shelves, whereas dome-shaped and pinnacle icebergs with larger freeboard originate primarily from valley glaciers. Icebergs of all other shapes are formed primarily from tabular and domed icebergs through various destructive processes that include splitting, overturning, melting, sea-wave erosion, and wind erosion. Icebergs of different shapes differ not only by their origin and typical values of freeboard and length. Weathered icebergs usually have draft that is less than the draft of tabular and dome-shaped icebergs. At the same time the ratio of the area of the underwater part of weathered icebergs to its above the water area is larger than the same ratio of icebergs of the two main types (Shilnikov Reference Shilnikov1969, Shabtaie & Bentley Reference Shabtaie and Bentley1982, Hamley & Budd Reference Hamley and Budd1986, Matsumoto Reference Matsumoto1996).
Keys & Fowler (Reference Keys and Fowler1989) summarized iceberg observations made in 1984–89 at the western shore of Ross Sea from airplanes and helicopters. According to this study about 30–35% of all sighted icebergs were tabular. This is the only study we are aware of that provides information on the frequency of occurrence of iceberg shapes in the Southern Ocean. Some data on the size and freeboard of icebergs of different shapes have been reported in Shilnikov (Reference Shilnikov1969) and Kozlovskii et al. (Reference Kozlovskii, Komarovskii, Fedyakov and Shilnikov1996), however, these studies incorporated only a limited number of observations made mostly in East Antarctica. Estimates of the mean size and freeboard of Antarctic icebergs with no differentiation by their shape are available from numerous studies of Russian scientists published in the 1960s and 1970s, e.g. Gordienko (Reference Gordienko1960), Shilnikov (Reference Shilnikov1960), Nazarov (Reference Nazarov1962), Buinitsky (Reference Buinitsky1973), Dmitrash (Reference Dmitrash1973), and Romanov (Reference Romanov1973). These papers have been cited in many later studies of Antarctic icebergs, e.g. Weeks & Campbell (Reference Weeks and Campbell1973), Schwerdtfeger (Reference Schwerdtfeger1979), Neshyba (Reference Nesyba1980), Orheim (Reference Orheim1980), and Hamley & Budd (Reference Hamley and Budd1986). According to Russian scientists, Antarctic icebergs were quite large. In particular, Gordienko (Reference Gordienko1960) and Romanov (Reference Romanov1973) estimated the typical length and freeboard of icebergs in the coastal zone equal to 1000–1100 m and 50–52 m respectively. North of 65°S the length and freeboard of icebergs decreased correspondingly to 450 m and 48 m. Orheim (Reference Orheim1980) summarized extensive observations of icebergs during two Norwegian expeditions to the Weddell Sea. Using instrumental measurement data for 2119 icebergs he concluded that the average size of icebergs obtained by the Russian scientists was substantially overestimated since a large number of small icebergs was not accounted for.
Since the beginning of the 1980s more detailed information on the Antarctic iceberg size distribution has been collected at the Norwegian Polar Institute (NPI). The programme initiated by NPI focuses specifically on the iceberg size distribution and requests that iceberg observations from ships include the number count of icebergs in five size categories, 15–50 m, 50–200 m, 200–500 m, 500–1000 m and over 1000 m. Hamley & Budd (Reference Hamley and Budd1986) used the NPI iceberg size ranges to report the size distribution of 2825 icebergs observed within 100–130°E and 56–64°S. Orheim (Reference Orheim1987b) summarized information on the iceberg size distribution accumulated at NPI. For 50 954 Antarctic icebergs included in the dataset, and split into five size categories, the average iceberg length was equal to 240 m.
Besides the studies cited above few papers reporting the size of icebergs in a number of specific regions in Antarctica were published after 1980. Wadhams (Reference Wadhams1988) measured the size of 174 icebergs during wintertime within 10–40°W and 53.5–56°S and obtained the average length of 459 m. Viehoff & Li (Reference Viehoff and Li1995) used satellite observations to estimate the freeboard of 13 icebergs that went aground in the Weddell Sea. The estimated average freeboard of icebergs was equal to 46.5 m. Tournadre et al. (Reference Tournadre, Whitmer and Girard-Ardhuin2008) used satellite altimeter measurements to determine the position and the size of 8000 Antarctic icebergs from December 2004–November 2005. It is important that the technique based on altimeter measurements allows for identification of icebergs with the freeboard below 15 m. This explains an unrealistic value of the iceberg modal freeboard of 7–8 m reported in this study.
The drawback of observations made within the NPI programme is that they do not provide information on the freeboard of icebergs if the iceberg length is below 1000 m. For larger icebergs it is recommended to report their width and freeboard. Grouping icebergs into five size categories is typically performed through a visual estimate of their size and therefore may not be very accurate.
In the last several years joint efforts of the Shirshov Institute of Oceanology of the Russian Academy of Sciences and the Arctic and Antarctic Research Institute (AARI) have been undertaken to rescue data of historical iceberg observations from Russian research vessels travelling in the Antarctic. The archive of hard-copy documents collected and stored at AARI includes reports from ship routes travelled in the Arctic and in Antarctica since late 1950. The work on the project included digitizing, converting the data into electronic format and their quality examination. Statistical analysis of information on Antarctic icebergs observed from ships is also conducted as part of the project. In our previous paper (Romanov et al. Reference Romanov, Romanova and Romanov2008) we summarized the iceberg occurrence data in Antarctica and examined a possible effect of El Niño on the iceberg concentration in various parts of the Southern Ocean. In the current work we have compiled and examined information on morphometric characteristics of Antarctic icebergs available from the AARI ship data archives. The primary objective of the study was to establish the frequency of occurrence, the percent ratio and the size distribution of each of five major iceberg shapes, tabular, dome-shaped, pinnacled, sloping and weathered. Information on the number fraction of icebergs combined with the average size of icebergs of each type was used to estimate the mean size of icebergs in the Southern Ocean. The study incorporates about 10 000 iceberg shape and size observation records made during 1957–2009.
Data
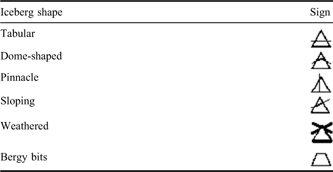
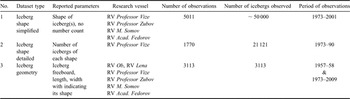
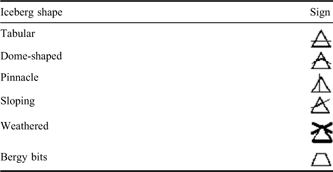
Observations of iceberg morphometric characteristics from Russian research vessels have been conducted along with the iceberg count. Two different formats have been used to report the iceberg shape. The largest number of observation records (about 5000) presented a simplified characterization of iceberg shapes: they listed shapes of all icebergs within sight from a ship without reporting the number of icebergs of each shape. To report the iceberg shape special signs have been used (see Table I). A smaller number of observations taken during several voyages of the RV Professor Vize in 1973–90 provided a more detailed characterization of iceberg properties. These observations included information on both the shape of icebergs sighted and the amount of icebergs of each shape. In the AARI archives we have found 1770 such records which incorporated reports of 21 121 icebergs.
Signs used to report the iceberg shape.
Quite often observations of the iceberg shape from Russian research vessels were supplemented by measurements of its geometrical size. The freeboard, length and sometimes width of some selected icebergs were measured with a sextant and a distance meter. The iceberg freeboard and length are defined correspondingly as the iceberg maximum visible vertical dimension above the waterline and the iceberg maximum horizontal dimension at the waterline. From the AARI archive we recovered 3113 reports that included information on both iceberg geometrical sizes and shapes. This latter set of data was complemented with the results of about 200 similar observations made in 1957–58 (Shilnikov Reference Shilnikov1963). The AARI archive also contains about several hundred iceberg size observation reports where the shape of icebergs was not identified. These observation records were also recovered and examined, however, they were not used in this study since our primary focus was on the size of icebergs of different shape.
To facilitate the analysis of iceberg size and shape distribution all available observations were grouped into three datasets. The first dataset comprised the results of observations where the total number and shapes of icebergs were reported but not the fraction of icebergs of each shape (i.e. simplified iceberg shape characterization). The second dataset included the results of more detailed observations of the iceberg shape with the number of icebergs of each shape recorded (i.e. detailed iceberg shape characterization). The third dataset included observations of the iceberg geometry and size parameters. More details on all three datasets are given in Table II. All observations used in this study were made during the warm period of the year from November to April. The first dataset presenting a simplified characterization of iceberg shapes was used to reproduce the spatial distribution of icebergs by shape. The frequency of occurrence of icebergs of each shape in different sectors of the Southern Ocean was estimated with data from the second dataset. Information on the iceberg geometrical size from the third dataset was applied to calculate the freeboard and length of icebergs of different shapes. The latter results were combined with information on the iceberg shape frequency of occurrence to estimate the mean size of Antarctic icebergs.
Datasets used in the study.

Geographical distribution of Antarctic icebergs by shape
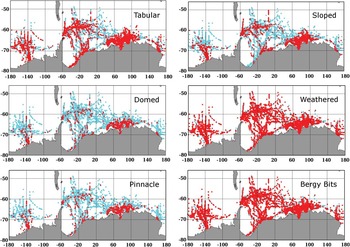
Maps of occurrence of icebergs of different shapes are given in Fig. 1. They were derived from dataset 1 (see Table II) presenting a simplified characterization of iceberg shapes. As seen from these maps weathered icebergs are most widely spread in Antarctica. They have been reported practically everywhere observations of the iceberg shape were taken. Tabular icebergs are abundant along the shoreline of Antarctica particularly in its eastern part, between 60°E and 100°E. Most observations west of the Antarctic Peninsula also report tabular icebergs. An increase in the occurrence of tabular icebergs at c. 60°S between 20°E and 60°W is most probably due to the northern branch of the Weddell Gyre that moves icebergs out from the Weddell Sea. In the region within 60–65°S and 40–60°E as well as within 60–65°S and 120–140°E tabular icebergs are sighted very rarely. Apparently because of the long travel time icebergs deteriorate and lose their original shape prior to reaching these regions. Iceberg shapes such as sloping, pinnacle and dome are less frequent than tabular and weathered. Pinnacle and dome icebergs are frequently reported in the coastal region at 140°W and between 60°E and 100°E, but are rare in the rest of the Southern Ocean. Similar to weathered icebergs bergy bits are spread quite widely and have been noted almost everywhere.
Distribution of icebergs of various shapes in the Southern Ocean from 5011 ship reports made during 1973–2001 and archived at the Arctic and Antarctic Research Institute (AARI). Blue dots show points of observation, red dots indicate the presence of icebergs of specified type in the point of observation.

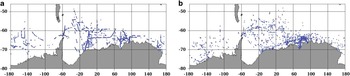
The relative frequency of occurrence of icebergs of different shapes has been established with the second dataset that includes observations of both the iceberg shape and the number of icebergs of each shape. Due to the fact that all Russian vessels travelling in Antarctica generally followed the same routes these observations cover approximately the same region as observations in the first dataset (see Figs 1 & 2a). Table III presents the statistics of occurrence of iceberg shapes in the Southern Ocean. Overall about two thirds of all reported icebergs were weathered (66.9%) and about a quarter were tabular (22.6%). With increasing distance from the coast the fraction of tabular icebergs noticeably decreased from 33–38% to 8–15% while the fraction of weathered icebergs substantially increased from 52–53% up to 77–82%. It is worth noting that the estimated fraction of tabular icebergs in the coastal zone corresponds well to the results of Keys & Fowler (Reference Keys and Fowler1989) who reported 30–35% of tabular icebergs at the western shore of Ross Sea. In the Western Hemisphere, within 60–65°S our data reveal a secondary maximum of tabular icebergs. This maximum is formed by icebergs carried out by the Weddell Gyre. The overall fraction of all other iceberg types sighted in Antarctica including sloping, pinnacle and domed was correspondingly 5.8%, 3.2% and 1.7%.
Number of icebergs of various forms as a percent (to the total number in each zone) in several sectors of the Southern Ocean derived from ship observations of 1973–90.

Similar to tabular icebergs the share of dome icebergs generally decreases when moving away from the coast. This tendency is better seen in the Western Hemisphere where the fraction of dome icebergs gradually changes from 3.6% in the vicinity of the coastline to 0.7% in the open ocean. In the Eastern Hemisphere the decrease of the share of dome icebergs away from the coastline is less consistent due to rather large (2.8%) fraction of icebergs of this type north of 60°S. It should be noted however, that the estimate of the fraction of icebergs north of 60°S is based only on the results of seven observations and therefore may not be quite reliable. Overall the geographical distribution of the percent ratio of the frequency of occurrence of different iceberg shapes presented in Table III corresponds well to the geographical distribution of icebergs of different shapes shown in Fig. 1.
Freeboard and length of Antarctic icebergs
Overall 3113 combined observations of the iceberg size and shape have been recovered and processed to estimate geometrical characteristics of Antarctic icebergs. Figure 2b presents the spatial distribution of observation points. The number of observed and measured icebergs of each shape in the dataset ranged from 347–755. The least and the most represented iceberg shapes in the dataset were, correspondingly, dome and tabular. This amount of available observation data was sufficient to examine both the mean values of iceberg length and freeboard and the frequency distribution of these parameters for each iceberg shape. To characterize the iceberg size frequency distribution we have calculated the number of icebergs within 100 m length bins and within 10 m freeboard bins.
Points of observation of the number of icebergs by shape from onboard RV Professor Vize in 1973–90. b. Points of observation where both instrumental iceberg size measurements and records of their shape were made (1957–2009).

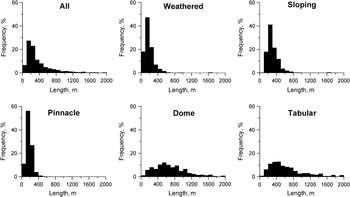
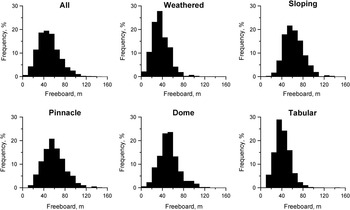
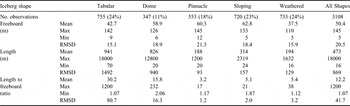
Length and freeboard frequency distributions for different iceberg shapes are shown in Figs 3 & 4 respectively. The mean values of the iceberg freeboard and length given in Table IV do not include the results of five observations when giant icebergs with the length of over 10 nautical miles (or over c. 18 km) were sighted. The occurrence of these giant icebergs is rare, about one per thousand icebergs reported, and they can substantially change any statistics. Large Antarctic icebergs are identified and tracked by the National Ice Center. A detailed database including the iceberg location, size and the source of satellite image data used to locate and characterize the iceberg is available at http://www.natice.noaa.gov/products/south_icebergs.html.
Frequency distribution of the observed iceberg length for all icebergs and for each iceberg shape.

Frequency distribution of the observed iceberg freeboard for all icebergs and for each iceberg shape.

Mean, maximum, minimum values and root mean square deviation (RMSD) of the iceberg length, freeboard and of the ratio of iceberg length to freeboard for icebergs of different shape estimated from observations taken in 1957–2009.

As seen in Figs 3 & 4, there is a distinct maximum in the length and freeboard frequency distribution for all iceberg shapes. Weathered and pinnacled icebergs have the smallest lengths with the most frequently observed values within 100–200 m. Somewhat larger modal length of 200–300 m is inherent to sloping icebergs. Dome-shaped and tabular icebergs are the largest with the most frequent lengths within 400–600 m. A distinctive feature of the iceberg length statistics is a much flatter frequency distribution of lengths for tabular and dome icebergs compared to weathered, pinnacle and sloping icebergs. The mean length of icebergs of all shapes in the AARI dataset was equal to 473 m whereas the mean length of dome and tabular icebergs (941 m and 826 m respectively) was three to four times larger than the mean length of icebergs of all other types. The mean freeboard of all icebergs was 50.4 m with over half of icebergs in the dataset having the freeboard within 30–60 m. The modal freeboard of tabular and weathered icebergs lies in the range of 30–40 m and increases to 50–60 m for dome, pinnacle and sloping icebergs. Correspondingly, the mean freeboard of tabular and weathered icebergs (42.7 m and 37.5 m respectively) is noticeably smaller than the mean freeboard of icebergs of the dome, pinnacle and sloping shape (58.9–62.8 m).
The value of the mean length of all Antarctic icebergs derived from the AARI dataset (473 m) agrees well with the mean iceberg length of 484 m estimated by Buinitsky (Reference Buinitsky1973), but is much smaller that the mean iceberg lengths of 1000–1100 m reported by Gordienko (Reference Gordienko1960) and Romanov (Reference Romanov1973). There is a considerable similarity of our estimates of the mean size of pinnacle, sloping and weathered icebergs to the ones of Kozlovskii et al. (Reference Kozlovskii, Komarovskii, Fedyakov and Shilnikov1996): the difference in the estimated mean freeboard and length remains mostly within 10% of the parameter magnitude. In the same time both the mean length and freeboard of tabular icebergs of correspondingly 489 m and 34 m calculated by Kozlovskii et al. (Reference Kozlovskii, Komarovskii, Fedyakov and Shilnikov1996) are substantially smaller than the length and freeboard of tabular icebergs derived from the AARI dataset (941 m and 42 m respectively). The latter difference, however, is easily explained by the fact that in Kozlovskii et al. (Reference Kozlovskii, Komarovskii, Fedyakov and Shilnikov1996) all icebergs with the length exceeding 1000 m were excluded from the statistics.
Much of the difference in the estimated mean length of Antarctic icebergs is due to the uncertainty in the concentration of small icebergs with lengths below 50–100 m. Our results, as well as the results of a number of other studies, demonstrate a noticeable decrease in the iceberg frequency of occurrence when the length drops below 100 m (e.g. Neshyba Reference Nesyba1980 Wadhams Reference Wadhams1988). Morgan & Budd (Reference Morgan and Budd1978) as cited in Bigg et al. (Reference Bigg, Wadley, Stevens and Johnson1997) have reported a drop in the iceberg size frequency distribution for lengths below 300 m. A possible reason for this fact consists in the decreasing effectiveness of radar identification of small icebergs at increasing range (Wadhams Reference Wadhams1988). Poor visibility conditions frequent in the Southern Ocean may also contribute to the “loss” of part of small icebergs when using visual observations. Besides the observation problems, physical explanations were also offered for the reduced concentration of small icebergs. As shown by Kubat et al. (Reference Kubat, Sayed, Savage, Carrieres and Crocker2007) the effect of melting and wave erosion progressively increases with the decreasing iceberg size thus causing faster deterioration of small icebergs and faster mass loss.
A number of other estimates of Antarctic iceberg size have found both unimodal (with maximum at 50–200 m) and exponential-type shapes of their size distribution (e.g. Hamley & Budd Reference Hamley and Budd1986). Observations conducted according to the NPI schedule and reporting the number of icebergs in five size categories reveal mostly monotonous growth of iceberg concentration towards smaller iceberg sizes (e.g. Jacka & Gilles 2007, Orheim Reference Orheim1987b). Unsurprisingly larger observed concentration of small icebergs results in a smaller mean iceberg size. In particular the iceberg size frequency distribution reported in Orheim (Reference Orheim1987b) yields only 240 m mean iceberg length, which is almost half of our mean length estimate based on the AARI iceberg size data.
It is worth noting that controversy with respect to the shape of the frequency distribution of iceberg lengths is also inherent to Arctic icebergs. In particular, both unimodal and exponential-type distributions of iceberg lengths were found by Dowdeswell et al. (Reference Dowdeswell, Whittington and Hodgkins1992) who summarized iceberg observations at several stations in the Scoresby Sund fjord system in East Greenland. They have noticed that the relative fraction of small icebergs with length below 100 m decreases with increasing distance from the iceberg source.
Estimating the mean iceberg size from datasets of size measurements of individual icebergs requires caution. It is reasonable to expect that when several icebergs are within sight, the observer would tend to select larger icebergs for the size measurement rather than smaller ones. Indirect evidence in support of this hypothesis consists in particular in substantial difference between the percent ratio of icebergs of different shapes in the AARI iceberg geometry dataset (Table IV) and the observed frequency of occurrence of icebergs of different shapes in the Southern Ocean (Table III). As compared to the iceberg geometry dataset, observations where the iceberg shape frequency distribution was the primary focus reveal a much larger fraction of weathered icebergs (66% vs 24%) and four to six times smaller fraction of pinnacle, sloping and especially dome-shaped icebergs. Since weathered icebergs are generally smaller than dome-shaped the mean iceberg size parameters calculated for all icebergs in the iceberg size dataset and presented in Table IV appear overestimated and require correction.
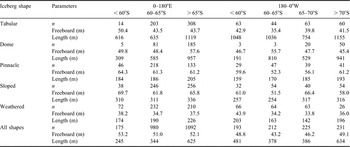
A two step procedure was used to estimate the corrected values of iceberg mean geometrical parameters. First, we estimated the mean iceberg length and freeboard by shape and the fraction of icebergs of each shape in each geographical sector (Table V). At the next step mean values of iceberg length and freeboard for each sector were calculated by averaging length and freeboard for individual iceberg shapes in the given sector weighted by the frequency of occurrence of these shapes. The overall mean freeboard or length represents the average for all iceberg shapes weighted by the corresponding shape frequency of occurrence. Corrected values of the mean iceberg freeboard and length that account for the observed iceberg shape frequency distribution are given in Table VI. The results are presented for several sectors of the Southern Ocean as well as for the whole dataset.
Average freeboard and length of icebergs in different sectors of Southern Ocean.
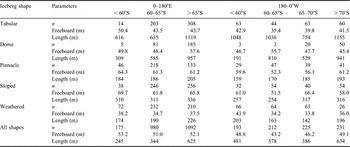
n=number of observations
Estimated mean freeboard and length of Antarctic icebergs in different sections of the Southern Ocean. Estimated standard deviation values are given in brackets.

The comparison of the original and corrected values of iceberg length and freeboard (Tables IV & VI) shows, that the correction procedure reduces the estimated overall mean iceberg freeboard by 9 m to 41.2 m. The mean corrected iceberg length (381 m) is 90 m less than the length obtained by simple averaging of all iceberg lengths in the iceberg size dataset. Because of a large scatter in the heights and especially in the lengths of observed icebergs, uncertainties inherent to estimated mean iceberg size parameters are quite large. In particular the estimated standard deviation of the corrected length and freeboard of all icebergs were equal correspondingly to 349 m and 11.2 m. The latter values were calculated using uncertainties of size parameters of individual iceberg shapes weighted by the frequency of occurrence of each iceberg shape.
The data in Table VI support the conclusion of Romanov (Reference Romanov1996) on rather small changes in the average freeboard of icebergs with distance from the coast. These changes are especially small in the Eastern Hemisphere. In contrast to the freeboard, the average length of icebergs decreases by about two times from the coastal to the open sea zone. In the Eastern Hemisphere north of 65°S, the length of icebergs estimated in our work (251–278 m) agrees well with the iceberg length of 257 m reported by Hamley & Budd (Reference Hamley and Budd1986). The results of the latter study were obtained for the region within 100–130°W and 56–64°S. At the same time even with the correction for the real iceberg shape frequency of occurrence our estimate of the overall mean iceberg length (381 m) still remains much larger than 240 m which yields the detailed, five-size-category, iceberg size distribution data of Orheim (Reference Orheim1987b).
Iceberg length to freeboard ratio
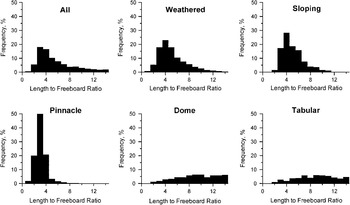
The ratio of iceberg length (l) to freeboard (f) is another geometrical parameter which is frequently used to characterize the iceberg shape. Interest in this ratio is explained by its close relationship to the iceberg stability and potential for rollover. The frequency of occurrence of l/f calculated with the AARI iceberg size data has revealed maximum at c. 4:1 for weathered and sloping icebergs and at c. 3:1 for pinnacle icebergs (see Fig. 5). Due to much larger range of lengths of dome and tabular icebergs their corresponding l/f frequency distribution was much flatter with maximum values of 232:1 and 1200:1 respectively (Table IV). Icebergs with l/f values below two are observed quite rarely, in less than 2% of all cases. No icebergs with the ratio value of one and below have been found. The obvious reason for a sharp decrease of the number of icebergs with small, less than 3:1 l/f is their decreasing hydrostatic stability and higher susceptibility to rollover.
Frequency distribution of the iceberg length to freeboard ratio.

The mode value of the l/f frequency of occurrence for pinnacle icebergs is noticeably smaller than the one for weathered and sloping icebergs. This can be interpreted as an indication of generally better stability of pinnacled icebergs given the length to freeboard ratio of the icebergs is the same. For tabular and dome icebergs the mode of l/f frequency distribution falls correspondingly to 9:1 and to 10:1 length to freeboard ratio. Decrease in the frequency of occurrence of tabular and dome-shaped icebergs towards smaller length to freeboard ratios can hardly be attributed solely to their lesser stability and higher potential for rollover. The decay, break-up and associated transformation of tabular and dome icebergs to icebergs of other shapes (e.g. weathered or sloping) may have a similar effect on the l/f frequency distribution.
A similar finding of a better stability of pinnacle icebergs as compared to icebergs of other shapes was made by Allaire (Reference Allaire1972). He concluded that the stability of icebergs largely depends on the above-water iceberg characteristics and found that the minimum stable ratio of waterline width to above-water height was equal to approximately 6:1 for blocky or tabular shapes, 4:1 for drydock shapes, 3.8:1 for dome shapes and 2.8:1 for pinnacled shapes. Although there is a good qualitative agreement of our estimates of the relative stability of icebergs of different shapes with the results of Allaire (Reference Allaire1972), the ratio values given in the latter study can hardly be accepted as minimum stable ratios. As it is seen from graphs in Fig. 5, a substantial number of icebergs of all shapes in our dataset have the length to freeboard ratio much below the minimum stable values offered by Allaire (Reference Allaire1972).
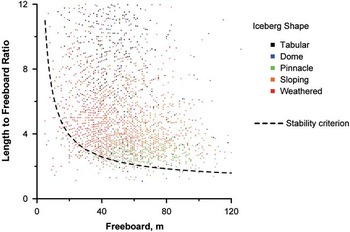
Quantitatively the statistics of the iceberg length to freeboard ratio obtained in our study demonstrates a better support of the stability criterion of Weeks & Mellor (Reference Weeks and Mellor1978) as cited in Bigg et al. (Reference Bigg, Wadley, Stevens and Johnson1997). In the latter study the stability criterion was expressed with an analytical formula relating the iceberg total length to height ratio (l t/ht) to the inversed iceberg total height (ht):

To test this criterion with our iceberg observation data we have reformulated Eq. (1) with respect to ratio of the iceberg water line length to freeboard, l/f and the iceberg freeboard. The iceberg draft (d) needed to calculate the total height was estimated with the model of Robe (Reference Robe1976), as cited in PERD (1999) relating the iceberg draft to its freeboard (d = 49.4f0.2). The value of l t was related to the iceberg length at waterline assuming that the underwater face of the iceberg has the shape of a circular convex arc with a vertically oriented chord and a slope of 30° at the waterline. The latter assumptions are generally consistent with the results of sonar observations of mature icebergs and ice shelves reported in Orheim (Reference Orheim1987a) and in PERD (2000).
Figure 6 presents the scatter plot of the freeboard vs length to freeboard ratio for observed Antarctic icebergs along with the graph representing the stability criterion (Eq. (1)). As it follows from Fig. 6 only 150 icebergs in the dataset (i.e. about 5% of all observed icebergs) fall below the criterion and thus should be characterized as unstable. Most of these potentially unstable icebergs were weathered, pinnacled or sloping and only few were tabular or dome.
Scatterplot of iceberg length to freeboard ratio vs iceberg freeboard. Black dashed line shows the iceberg stability criterion derived from Weeks & Mellor (Reference Weeks and Mellor1978). Icebergs falling below the stability criterion are considered unstable. Icebergs with length to freeboard ratio above 12 and with freeboard above 120 m are not shown in the graph.

A good fit of the iceberg stability criterion derived from Eq. (1) to the statistics of the observed iceberg size parameters presents an interesting result, however, it should be treated with much caution. First, this criterion does not account for the iceberg shape, which is an important factor determining the iceberg stability (Bass Reference Bass1980). Second, there is a substantial uncertainty in estimates of the iceberg total height and length from the observed above-water iceberg size parameters. Lastly the above-water iceberg length measured from a ship is not always its largest horizontal dimension. The typical iceberg width to breadth ratio is about 1.6 (Neshyba 1980) therefore the true length of icebergs and correspondingly, their length to freeboard ratio may differ by about 25% from the observed ones.
Conclusion
In this study ship observations of the AARI have been used to produce the length and freeboard statistics of Antarctic icebergs of five major forms. We have made first estimates of the relative frequency of occurrence of Antarctic icebergs by shape and characterized its spatial variations in the Southern Ocean. It was found that the AARI dataset comprising size measurements of individual icebergs contains a larger fraction of tabular and dome-shaped icebergs and a smaller fraction of weathered icebergs as compared to the iceberg natural occurrence. Since tabular and dome icebergs are generally larger than weathered icebergs, application of this dataset to calculate the mean iceberg length and freeboard results in overestimated iceberg size parameters. The most probable reason for getting a larger number of observations of tabular icebergs consists in the tendency of observers to select the largest iceberg in sight for size measurement. Therefore it is reasonable to expect the same problem in other known iceberg size datasets generated by compilation of size measurements of individual icebergs.
In this study the overall mean iceberg length and freeboard were calculated as the average of mean size characteristics of different iceberg shapes weighted by the relative frequency of occurrence of these shapes. Within this approach the mean length and freeboard of Antarctic icebergs were equal correspondingly to 41.2 m and 381 m. These values are about 20–25% smaller than the iceberg length and freeboard derived by straightforward averaging of available iceberg size measurement data. Estimates of the mean iceberg size characteristics are associated with substantial uncertainties because of large spatio-temporal variations in the size of Antarctic icebergs and due to a relatively small number of available observations. The standard deviation of the Antarctic iceberg length was almost equal to its mean value (349 m vs 381 m) whereas the iceberg freeboard root mean square deviation (RMSD) made about 25% of the mean freeboard value (11.2 m vs 41.2 m). Large scatter in the iceberg length and freeboard as well as corresponding large uncertainty in their mean values is inherent to the results of most other studies of iceberg size parameters.
The iceberg length to freeboard ratio is known to determine to a large extent the iceberg stability. The difference noticeable in the length to freeboard frequency distribution for icebergs of different shapes revealed in our study emphasizes the importance of the iceberg shape examination when evaluating its potential for rollover.
Acknowledgements
The authors would like to thank two anonymous reviewers for their very helpful comments, suggestions and corrections that substantially improved the paper. Iceberg observation data used in this paper are the property of the Arctic and Antarctic Institute (AARI), and are available upon request from Dr Ivan E. Frolov, AARI Director, Beringa Str. 38, St. Petersburg, 199397, Russia, frolov@aari.nw.ru.