Introduction
China is currently the world leader in pesticide utilization. According to national statistics, the annual area sprayed with pesticide has reached 167 million ha, of which about 13.3 million ha (or one-seventh) is polluted by pesticide. Related research shows that less than 0.03% of the pesticides applied can make a real impact on killing insects, while more than 20% to 30% of pesticide droplets sprayed from sprayers drift to non-target areas with airflow. The non-targeted drift of pesticide droplets is the key reason causing the serious loss of pesticides, environmental pollution, and low disease-controlling effect (Liu et al., Reference Liu, Zhou and Zheng2005; Qi et al., Reference Qi, Fu and Shi2002; Song et al., Reference Song, Liu and Zhang2011; He Reference He2004; Yuan et al., 2011; Yang et al., Reference Yang, Yan and Xu2002; Wang et al., Reference Wang, He and Herbst2014; Dong et al., Reference Dong, Yang and Yan2012).
The spray nozzle is one of the most important components for realizing effective and precise chemical application with sprayers because it plays an important role during the atomization of pesticide solutions (Fan et al., Reference Fan, Shi and Yang2014; Xie et al., Reference Xie, He and Song2013). At present, research on nozzle technologies is still in continuous improvement and development and the understanding of certain nozzle constructions and their mechanism is still being explored. A previous study on spray nozzles used for plant protection, mainly depended on actual experiments to assess spray characteristics using some intuitive measurements methods that were associated with a high cost, long test cycle, heavy workload and complex test procedure (Hou and Hou Reference Hou and Hou2002). In recent years, with the rapid development of computer technology and theory research on computational fluid dynamics (CFD), it has been a trend to simulate the atomization process and the spray characteristics of nozzles by means of computer numerical simulation. CFD method can overcome some shortcomings of traditional experimental methods and provide an intuitive understanding of the details of flow fields inside and outside nozzles via simulation, such as the change of pressure, velocity, and temperature, and the feature of velocity vectors in flow fields (Yang et al., Reference Yang, Zhou and Liu2008). The corresponding flow field can be rapidly observed when the external conditions are changed, so that interference from uncontrollable factors in field experiments to experimental results can be avoided; which cannot be achieved by the traditional experimental method (Fu et al., Reference Fu, Wang and Qi2009; Sidamed and Brown Reference Sidamed and Brown2001; Xu et al., Reference Xu, Walklate and Rigby1998; Ning and Pang Reference Ning and Pang2006; Qi et al., Reference Qi, Zhao and Wang2010). Therefore simulating the spray flow field is a great support to precision chemical application.
In this paper, an anti-drift fan spray nozzle was designed. The geometric model of the fan nozzle was established using the 3D design software ‘Solidworks’ and the nozzle was fabricated using high precision 3D printing technology. The influences of nozzle inner-structure factors on pressure and velocity flow-fields were studied through computer simulation technology and the effect of the inner-structure factors on spray angle, which is a key spray characteristics, were studied in experiments. According to the literature (Deng et al., Reference Deng, Ding, Liu and Zhang2006), spray pressure is the decisive factor in determining spray angle. The results of the simulation and experimental tests on the nozzle’s flow field were compared to provide a theoretical basis for optimal design of anti-drift spray nozzles.
Materials and methods
The inner structure of fan nozzle
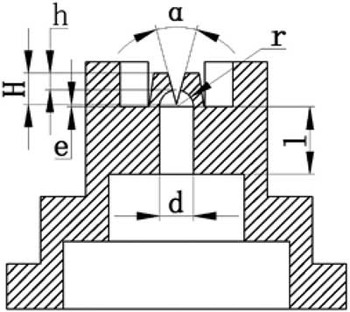
The inner structure of the fan nozzle was designed and is shown in Figure 1. In the structure diagram, h, on behalf of the hole-edge distance, is the distance between the end of the spray orifice and the transverse plane of the spray nozzle. e is for the over-center distance. H represents the groove depth. α is for the opening angle of the V-shaped groove. r is for the curve radius of the nozzle end’s shape. d is the diameter of nozzle chamber. l is the lumen length of the orifice end. H r , for the relative cutting depth, is the parameter used for manufacturing nozzles and reflects the relative depth of the cutting on the ball surface of nozzle’s head in the process of nozzle manufacturing. The equation of calculating H r is shown in Formula (1).
 $$H_{{\rm r}} \, {\equals}\, {{r{\minus}e} \over r}\, {\equals}\, {{H{\minus}h} \over r}\, {\equals}\, {{2(H{\minus}h)} \over d}$$
Profile diagram of nozzle structure

According to a large number of experimental results, the diameter of nozzle chamber (d), the opening angle of V-slot (α), and the relative cutting depth (H r ) are the important structural parameters of nozzles that affect spray characteristics (Huang Reference Huang2014; Liu Reference Liu2007). Therefore, the focus here is on the influence of these three structural parameters on a nozzles’ spray characteristics.
Analogue simulation
Geometric model and mesh generation
The geometry model of a nozzle was established in Solidworks, and used as an inpu into the FLUENT software. The model was meshed using a volume meshing method in which grid elements were Hex/ Wedge (mainly hexahedral mesh at most positions, wedge-shaped grid at some local positions). The grid type was Cooper and the interval size was 0.1. The outlet end of spray orifice was also meshed with Tet/Hybrid grid elements, TGrid grid type, and local mesh refinement.
The model of fluid computation
A standard k-ε turbulence model (Sun et al., Reference Sun, Wang and Ding2012) was adopted to establish mathematical equations in this study. In the FLUENT software, the finite volume method is adopted for dissociation of control equations and the SIMPLE algorithm is used for calculation. Simulation parameters were defined as follows. The inlet pressure was 0.3 MPa and the outlet pressure was atmospheric pressure. The density and the viscosity of the single-phase liquid water which was used as flowing medium is 998.2 kg/m3 and 0.001 Pa·s. The liquid-solid interface was set to be a non-slip boundary condition. The solver was selected as a pressure-based algorithm. The turbulence intensity and hydraulic diameter were used as boundary conditions to define the turbulence parameters, and the turbulence intensity and the hydraulic diameter were set to 5% of the diameter of the nozzle’s orifice.
Simulation
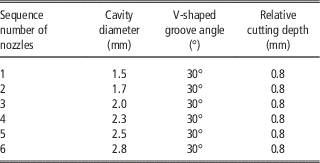
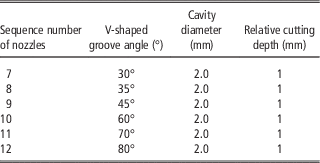
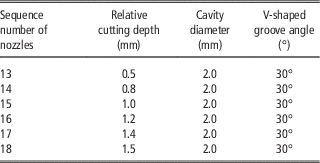
Three factors, namely, lumen diameter, V-shaped groove angle, and relative cutting depth, were selected in the analogue simulation. Three tests were designed where one factor was changed while keeping the other two factors unchanged. The input parameters for the three tests are shown in Tables 1–3. Test 1 changed the lumen diameter while keeping the V-shaped groove angle and relative cutting depth unchanged. Test 2 changed the V-shaped groove angle while keeping the lumen diameter and relative cutting depth unchanged. Test 3 changed the relative cutting depth while keeping the lumen diameter and V-shaped groove angle unchanged. For each test, 6 kinds of nozzles with different inner structures were fabricated and the corresponding nozzle models were input into FLUENT and simulated to verify the influence of each factor on the flow field inside the nozzle.
The change of cavity diameter

The change of V-shaped groove angle

The change of relative cutting depth

In the simulation, images of pressure and velocity fields on the center plane inside the nozzle were obtained. Because the images of pressure and velocity fields cannot be effectively compared, the pressure and velocity data on the central axis of each nozzle model were respectively extracted from the FLUENT software, imported into MATLAB software, and drawn as pressure and velocity curves using the graphic function in MATLAB to compare the pressure and velocity inside each nozzle and to lead to valid conclusions.
Spraying test
Test equipment and materials
The nozzles used in the study were fabricated using a 3D printing technique using the structure in Figure 1 and according to the dimensions shown in Tables 1–3. The printing material was a photosensitive resin with a printing accuracy of 25 μm. The test device for measuring nozzle integrative performances was composed of a water pump, control switch, regulating valve, power supply, liquid tank, pressure gauge, nozzles, water pipes, and other devices. The total capacity of the spray tank was 50 L. The regulating range of the nozzle’s height was 1000mm. The maximum flow rate and pressure were respectively 5 L/min and 2 MPa. The temperature was 10~35°C and the relative humidity > 50%.
Test method
Spray angle is one of the important parameters to characterize the spray performance of a nozzle. The spray angles of each nozzle printed using 3-D printing technology were measured in turn on the testbed and calculated using the image-identified method (Deng et al., Reference Deng, Ding, Liu and Zhang2006). Three tests were carried out as shown in Table 1 (the only change of lumen diameter), Table 2 (the only change of V-shaped groove angle), and Table 3 (the only change of relative cutting depth). In all tests, the spray pressure was set to be 0.3 MPa, the height of the nozzle above the testbed was 50 cm. For each test, the system was ‘shot’ three times at intervals of 5 minutes and the average value of the three measured spray angles was regarded as the final measurement of spray angle for certain test conditions.
Results and discussion
Simulation
Influence of cavity diameter on inner flow field
The 6 nozzle models were respectively established according to the structural parameters shown in Table 1 (Simulation 1) and were imported into FLUENT software after being divided into grids using Gambit software. The result shows that the changing trends of pressure and velocity curves along the axis line of the six nozzles are basically the similar. The pressure decreases and the velocity increases with the increasing distance from the center to the bottom along the axis of the nozzle. It shows that six pressure curves basically overlap together while the velocity curves increase slightly with an increase in the lumen diameter, which indicates that the nozzle’s cavity diameter has a certain influence on the velocity of the flow field inside the nozzle.
Influence of V-shaped groove angle on inner flow field
For the second simulation (Table 2 parameters), with a changing of V-shaped groove angle inside the nozzle, the pressure and velocity curves along the center axes of the six fabricated was basically consistent. With an increase of distance from the center to the bottom along the axis inside the nozzle, the pressure decreased and the velocity increased. Meanwhile, the pressure gradually decreased and the velocity slightly increased with the increase of the V-shaped groove angle, with little change in the range of the inner flow field of the six nozzles.
Influence of relative cutting depth on inner flow field
When altering the relative cutting depth (Table 3), the trends of pressure and velocity curves along the center axis of the six nozzles were similar. When the distance from the center to the bottom of the nozzle is less than 6 mm, the pressure and velocity is essentially unchanged; while when the distance is more than 6 mm, the liquid pressure drops and the velocity rises rapidly. Furthermore, the greater the relative cutting depth, the faster the liquid pressure dropped and the liquid velocity increased. When the distance is more than 9 mm, the influence of the relative cutting depth on the inner pressure and velocity of nozzles became smaller. With further increase of relative cutting depth, the inner liquid pressures of the six nozzles approached the same value and decreased sharply, meanwhile the inner liquid velocity of the six nozzles approached the same value.
Spray test
Influence of cavity diameter on spray angle
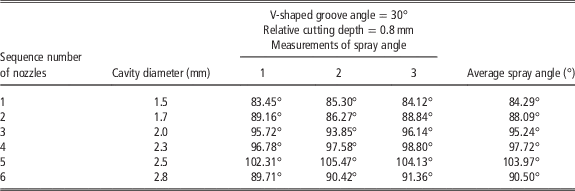
Keeping the V-shaped groove angle and the relative cutting depth unchanged, respectively at 30o and 0.8, the six nozzles with different cavity diameters fabricated in Test 1 were used in the spray test and the test results are shown in Table 4. It can be seen that the spray angle tended to increase with an increase of cavity diameter. The test result is in accordance with the simulation above. It indicated that increasing of nozzle’s cavity diameter increased the fluid velocity slightly and made the spray angle increase. The results showed that with an increase in cavity diameter, the resistance inside the nozzle decreased while the liquid velocity increased. Therefore, the radial velocity component accordingly increased resulting in an increased spray angle.
The spray angle of each nozzle with a changing cavity diameter

Influence of V-shaped groove angle on spray angle
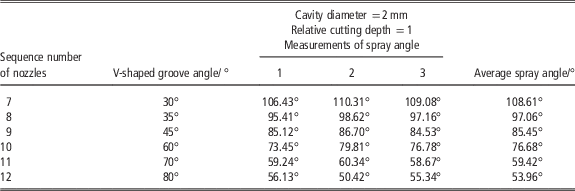
Keeping the cavity diameter and the relative cutting depth unchanged, respectively to be 2 mm and 1, the test results from the six nozzles with different V-shaped groove angles fabricated (Table 2) are shown in Table 5. It can be seen that the spray angle gradually decreased with increased V-shaped groove angle. This test result is in accordance with the simulation result above. An increase of the nozzle’s V-shaped groove angle decreased the fluid pressure and decreased the spray angle.
The spray angle of each nozzle with the change of V-shaped groove angle

The results also showed that the constraint force on the fluid received from the V-shaped groove wall at the nozzle exit decreased with an increased V-shaped groove angle, and the fluid pressure accordingly decreased. This process is probably accompanied by an enhancement of liquid surface tension so that the liquid flow became more concentrated and the spray angle reduced.
Influence of relative cutting depth on spray angle
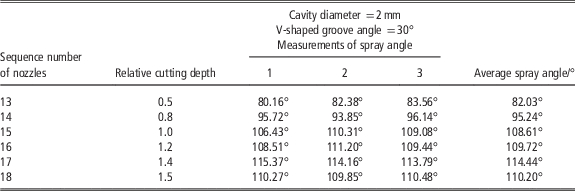
The test results when keeping the cavity diameter and the V-shaped groove angle unchanged, respectively to be 2 mm and 30o, are shown in Table 6. It can be seen from Table 6 that the spray angle gradually increased with increased relative cutting depth. However, the spray angle has a decreasing tendency when the relative cutting depth increased to a certain extent. This test result is similar to the simulation results above. It demonstrated that an increased relative cutting depth decreased the fluid pressure while fluid velocity increased. The influence of pressure and velocity on the spray angle will be mutually offset. It is probably because of the change of relative cutting depth that led to a change of liquid surface tension, resulting in a changed spray angle.
The changing curve of spray angle to the nozzle’s relative cutting depth

Conclusions
The 3-D models of the fan nozzles were developed using Solidworks software and the influence of nozzle’s design parameters, mainly as cavity diameter, V-shaped groove angle, and relative cutting depth, on the flow field inside the nozzle were simulated using the software FLUENT. The simulation results showed that the V-shaped groove angle and the relative cutting depth had greater influence on the fluid pressure and velocity inside the nozzle than the cavity diameter of the nozzle. With an increased cavity diameter, fluid pressure inside the nozzle was basically unchanged while the velocity increased slightly. With an increased V-shaped groove angle, the inner fluid pressure gradually decreased and the inner fluid velocity gradually increased. With increased relative cutting depth, the inner fluid pressure sharply decreased while the fluid velocity increased.
The spray nozzles with different design parameters were fabricated using high-precision 3-D printing technology and the influences of nozzle’s design parameters on spray angle were tested on a spray test-bed. The test results revealed that the spray angle had an increasing tendency with increased cavity diameter, gradually decreased with an increased V-shaped groove angle, and gradually increased with an increased relative cutting depth. In particular, there was a reduced trend for the spray angle when the relative cutting depth increased to a certain extent.