We hardly need reminding that words go a long way in representing the things around us. Our libraries are full of verbal descriptions of nature and society. We use informatics languages—yet more words—to program our computers. Our weekly shopping lists are expressed in words. Words, words, words—we are not likely to forget their importance. From time to time, however, we do need to be reminded that there are other ways to represent knowledge. Pictures, diagrams, photographs, and drawings of various sorts also play a role in our cognitive lives. They, too, represent aspects of the world around us. And maybe they can do even more than merely represent.
Everyone seems happy to repeat the old saw: a picture is worth a thousand words. But when pressed on the matter, many back down. The standard view in mathematics, for instance, is that pictures are no substitute for a proper proof. Diagrams might inspire us to new discoveries or help us to understand old ones, but they are not proofs, not genuine evidence for a theorem. A proof is a verbal symbolic entity, something written in unambiguous equations, something that obeys the rules of logic. That is something no diagram can do.
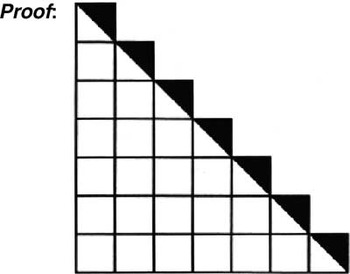
Yet, as has been argued (Brown, Reference Brown1999/2008), there do seem to be examples of mathematical proofs that are pictures. Consider the following example (Figure 1).
 $$Theorem: 1\,+\,2\,+\,3\,+\ldots + \,n\,=\,\frac {n^2}{2}\,+\,\frac{n}{2}$$
A picture proof. From Brown (Reference Brown1999/2008)

Try to figure out how the picture works as a proof. It is worth a moment's reflection before reading on.
Starting from the top and counting the number of little squares, we get 1 + 2 + 3 + ⋯ + 7. Next, look at the picture as a whole. Try to imagine a large square of sides 7 × 7. Ignoring the little black half-squares, the picture here is half of that large square, cut along the diagonal. Its size is 72/2. Next focus on the black bits. There are seven of them, each half of a small square. So they total 7/2. These two terms correspond to n 2/2 and n/2, respectively, on the right side of the equation. Once we understand the picture for the special case on n = 7, we can easily grasp that it holds for any number n. When we see the last point, we see that the theorem must be true.
The example is remarkable for it upends a common view about pictures. The common view (which seems so plausible) is that any picture is merely a special case, and we should not jump to the general case from a mere single instance. The picture is indeed a special case, namely, n = 7, and yet it seems to prove the theorem for each and every one of the infinitely many numbers.
Such powerful visual reasoning devices are not, however, limited to images rendered on a page. The place where we often get more than expected out of a picture or a situation that we can visualize is, of course, thought experiments, especially in the natural sciences. It would be hard to imagine the history of physics without the brilliant thought experiments of Galileo and Einstein— the principle of relativity that says the laws of nature are the same in any inertial frame. The principle is central to both Newton's and Einstein's physics. It was established by Galileo. We imagine a situation to which all we bring is our background knowledge. No new observation or new calculation is required.
Shut yourself up with some friend in the main cabin below decks on some large ship, and have with you there some flies, butterflies and other small flying animals. Have a large bowl of water with some fish in it; hang up a bottle that empties drop by drop into a wide vessel beneath it. With the ship standing still, observe carefully how the little animals fly with equal speed to all sides of the cabin. The fish swim indifferently in all directions; the drop falls into the vessel beneath; and, in throwing something to your friend, you need throw no more strongly in one direction than another, the distances being equal; jumping with your feet together, you pass equal spaces in every direction. When you have observed all these things carefully (though there is no doubt that when the ship is standing still everything must happen in this way), have the ship proceed with any speed you like, so long as the motion is uniform and not fluctuating this way and that. You will discover not the least change in all the effects named, nor could you tell from any of them whether the ship was moving or standing still. (Galileo, Reference Galileo1967: 186)
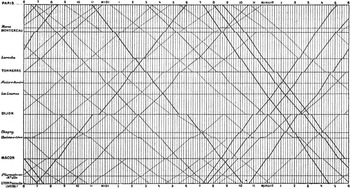
Picture proofs in mathematics and thought experiments in physics are instances of getting new information from things we already know (For extended discussions see Brown Reference Brown1999/2008 and Reference Brown1991/2010). But with these examples we are only scratching the surface of visualization. A different use to which diagrams can be put is the representation of massive amounts of data. Edward Tufte's books on the visual display of information (Reference Tufte1983, Reference Tufte1990) are a great pleasure to read besides making their point about how pictures can better convey vast amounts of information. One of the most brilliant examples of this is the Paris–Lyon train schedule. The lines from top left to bottom right indicate the various trains from Paris to Lyon. The lines running from bottom left to top right are the trains from Lyon to Paris. They give the departure and arrival times, and the times at various stations in between. A huge amount of information is contained in a simple, easy to read chart—a chart that any person could use to plan a journey according to particular preferences (Figure 2).
An example of a graphical train schedule attributed to the French engineer, Ibry and originally published in E.J. Marey's La Methode Graphique (1885: 20)

These examples reveal only some of the ways in which visual reasoning, be it in the imagination or through engagement with a rendered image, pervades both our ordinary daily lives and scientific practices. The current volume represents a diverse group of scholars working to explicate the nature of visual reasoning and perhaps extend it even further. Some of our authors seek to classify and analyze the type and content of visual images that are used to convey and produce knowledge. Others focus on how the active creation of visual images either on the page or in the mind is integrated with reasoning itself.
With the exception of Tufte's work, the examples above reflect analyses of visual reasoning that developed in the last 20 years, reflecting a general trend. Until the 1990s visual reasoning was the domain of esthetics and art theory and there it was typically eclipsed by interest in expression. There were notable exceptions. The exceptions include Stephen M. Kosslyn's work on mental imagery (e.g., Kosslyn, Reference Kosslyn1995), Rudolph Arnheim's work on visual reasoning (Reference Arnheim1969), Arthur I. Miller's work on imagery in science (Reference Miller1984), Nelson Goodman's work on understanding and symbol systems (Reference Goodman1968) and, as mentioned above, Tufte's work. In the 2000s there has been a real explosion of interest in visual reasoning, a fact that becomes more evident as one examines how visual reasoning is addressed by various different disciplines. Indeed, the diversity of this special issue of the Knowledge Engineering Review is a reflection of the diversity within the literature.
This volume begins with papers that specifically address the function of diagrams. In ‘Towards a diagrammatic classification,’ Valeria Giardino (Reference Giardino2013) articulates a general framework for classifying diagrams where the role of the diagram in reasoning is taken to be central to a diagram's identity. The classification she provides distinguishes static diagrams, which function primarily as mnemonic devices, from dynamic diagrams, which promote inferences. In an interesting self-reflexive turn she provides a ‘diagram,’ or graph, for diagram classification that plots the degree of correspondence between the spatial format of a diagram and the data structure it is intended to convey against the comparative dynamism of the image. Within the conceptual space mapped by her graph, Giardino places various types of representations. Her characterization of graphs as dynamic diagrams that facilitate the acquisition of new knowledge forms a tantalizing bridge to Michel Chein et al.'s (Reference Chein, Mugnier and Croitoru2013) work on ‘Visual reasoning with graph-based mechanisms.’
In their paper, Chein et al. (Reference Chein, Mugnier and Croitoru2013) explain how graphs can be used in artificial intelligence knowledge representation formalisms both to represent knowledge and to allow for sound logical reasoning in a visual manner. The language they propose is entirely graph based—and hence visual and user-friendly. What differentiates their approach from many diagrammatic representations of basic logical operations is their introduction of their graph homomorphism, which enables the language user to visually encompass all elementary logical transformations in one single, intuitive step. Their visual language thus not only enables one to move instantaneously (and without logical training) from specific claims like ‘Jason is Martha's older brother’ to general ones like ‘These two kids are siblings,’ but it can be easily implemented as a universal artificial system language used by the knowledge engineer creating the system, the expert of the application domain, and the end-user. Chein et al.'s (Reference Chein, Mugnier and Croitoru2013) proposal is therefore not simply a new kind of conceptual or cognitive map that would simply represent knowledge; it is a visual, graph-based language that has a logically sound and complete inference mechanism that allows for intuitive, clear, and sound visual reasoning.
In Laura Perini's (Reference Perini2013) account of ‘Diagrams in biology’ we find a third approach to diagrams. Though differing in detail, Perini follows Giardino in identifying the excision of extraneous visual content as characteristic of diagrams. But Perini goes further, specifying the ways in which particular types of diagram in biology support particular types of biological reasoning. Her analysis begins with pictorial diagrams, exemplified by the superposition of a diagram over a spatial representation (e.g., the representation of signal intensity that conveys the cross-sectional shape of the ATP synthase complex). The superimposed diagram picks out features of the more replete picture that would otherwise escape notice, thus representing the results of the experiment more clearly than the original representation alone. In contrast, compositional diagrams, the meaning of which are determined by their atomic component parts (like words in a sentence), have no spatial relation to the objects they represent. Yet, Perini explains, they support functional analysis, a type of reasoning that, Perini argues, can be done in ignorance of the spatial characteristics of the component parts, drawing again on the pictorial history of the discovery of ATP synthase to make her case. Finally, schematic drawings round out Perini's account. Distinct from the other types of diagram, they neither depend on conveying some aspect of the represented object's spatial form nor are they compositional. Schematic drawings use relatively generic visual features to represent features of objects and processes that are themselves generic. In so doing they effectively characterize generic properties without suggesting that they are instantiated in any particular way.
In ‘Knowing, reasoning and visualizing in industrial design,’ Christian Wölfel et al. (Reference Wölfel, Krzywinski and Drechsel2013) take the interplay between the construction of visual representations and the construction of knowledge one step further to the construction of actual objects. Wölfel et al. (Reference Wölfel, Krzywinski and Drechsel2013) describe the connection and interaction between visualization and reasoning in three early stages of the industrial design process: clarification of the task, concept development, and design solution. They emphasize that although industrial design must work in concert with engineering design, the creative and reasoning processes are quite distinct. Contrary to engineering's decomposition of products into functional components, industrial design takes a holistic approach, addressing the users’ experience of the product and, in particular, their visual experience. Wölfel et al. (Reference Wölfel, Krzywinski and Drechsel2013) present a dizzying account of the complex iterative creative processes that sit behind industrial design. Crucial to these processes is the interaction between internal reasoning and external visualization, through drawings, CAD, scale models, and prototypes.
In a similar vein, Lorenzo Magnani (Reference Magnani2013) argues in ‘Thinking through drawing: diagrams as epistemic mediators in geometrical discovery,’ that in order to truly understand visual reasoning we must broaden the scope of our study and start reflecting on how we think through our use, drawing, and modification of images. He is not simply arguing that visual representations may be needed in reasoning, he is attacking the idea that cognitive processes all happen internally. A cognitive system is not, Magnani argues, simply composed of a person's mind or brain or an AI system's hardware and software. Cognitive systems are ‘distributed.’ The whole body of a person and the external physical representations or the artifacts they use should be considered when discussing knowledge. Magnani explores the consequences of this view for the use of diagrams in manipulative abductions, that is, the reasoning processes that rest on hypothetical explanatory claims and rely essentially in their unfolding on the manipulation of an object, or some other extra-theoretical behavior like drawing. To support his claim, Magnani presents a detailed analysis of Lobachevsky's use of diagrams throughout his development and defense of non-Euclidean geometry. Magnani argues that if we are to understand how we create new knowledge, we cannot separate minds from their respective bodies and the diagrams they produce.
Like Giardino and Perini, Letitia Meynell calls for a general foundational theory from which to classify and assess scientific images. In ‘Parsing pictures: on analyzing the content of images in science,’ she diverts attention from the processes of reasoning to basic questions about visual content. For Meynell, core questions about the role of images can only be adequately answered once an account of pictorial content has been given. Against accounts that treat visual images as quasi-linguistic symbol systems, Meynell (Reference Meynell2013) argues that some images should be understood as crucially visual. Viewing these pictures is more analogous to the visual perception of a scene or object than to reading a sentence. Careful analysis of representational content is, however, still possible, though it bares little resemblance to the syntactic and semantic analysis that inevitably dominates a quasi-linguistic approach. She suggests following John Willats’ analytic methods, which focus on projection systems and the visual construction of shape and objects from marks on a surface, as a better way of understanding, and ultimately assessing, the content of at least some important scientific images.
In ‘Visuo: a model of visuospatial instantiation of quantitative magnitudes,’ Jonathan Gagné and Jim Davies (Reference Gagné and Davies2013) continue the focus on content, attempting to model how reasoners create specific visual contents on the basis of vague semantic claims like ‘a big raven is flying above the tree.’ Specifically, they investigate how vague qualitative adjectives like ‘big’ or ‘above’ are quantitatively translated in visual representations, how this information is stored, and then used to estimate new quantitative information when one is presented with new qualitative stimuli. The model they present, an operational Python computer program called Visuo, grounds this process on the retrieval of past information. Visuo evaluates what ‘big’ means when talking about a raven by referring to the size of past encounters with ravens or information stored for semantically related concepts, such as crows. Humans, of course, do not precisely memorize the quantitative information obtained visually and hence, Gagné and Davies (Reference Gagné and Davies2013) argue, AI systems truly modeling visualization should not either. This is why they investigate, through Visuo, the possibility of storing information about visuospatial magnitudes as distributions over fuzzy sets.
James McAllister's (Reference McAllister2013) ‘Reasoning with visual metaphors’ concludes this special issue with a challenge that may well open up a new phase in the study of visual knowledge and reasoning. McAllister acknowledges that there is now a strong research program on the understanding of visual representations that are meant to literally represent objects and another on the use of semantic metaphors in literature. However, apart from some isolated work in iconography, almost nothing has been said about reasoning on visual metaphors like Justitia, the blindfolded female representation of justice. This lacuna is important not only because visual metaphors offer a mode of reasoning forcefully different from both literal metaphors and conceptual, semantic discourses, but because this mode of reasoning, which was ubiquitous during the Renaissance, is still pervasive today. Indeed, McAllister boldly maintains that physics’ mathematical laws are essentially visual metaphors. Just as Justitia's scales readily suggest equity, so mathematical laws capture their objects in a compact and holistic manner. Just as Justitia's blindfold may be read either as a proof of our judicial system's equity or as its incapacity to see when the scales of justice are balanced, so the laws of physics are hermetic and require interpretation. Physical laws, like all visual metaphors, do not aim at literally depicting specific occurrences; they are meant to make explicit general relations existing between complex concepts. They are also highly visual, capturing characteristics of nature, like its symmetries and beauty, which are usually understood in visual terms. More importantly, visual reasoning on mathematical laws cannot be achieved through linear reading or processing, but through a dialectical and visual engagement with their different visual elements. Understanding visual metaphors, McAllister suggests, will be central to our future understanding of visual reasoning. More importantly, if McAllister is right, we must conclude that visual reasoning is much more pervasive and much more important than we have so far realized: visual reasoning is not simply at play in our analysis of images or diagrams. It is at the very core of actions which—like mathematical proofs—we had so far taken as linguistic processes.
In sum, the papers in this special issue reflect the wide diversity of current approaches to visual reasoning, but they also suggestively point to future scholarship on this topic. We can see that debate on the relation between visual, linguistic, and mathematical content and reasoning continues to shape the discussion and, if McAllister is right, may significantly transform it. Entwined with questions about the form of content and reasoning styles, we can see an increasing focus on rigorous and generalizable conceptual tools for the analysis of visual content and reasoning. Moreover, many of the views expressed here are informed by trends in the cognitive sciences that treat cognition as embodied, marrying the practices of making images with visual reasoning. But these practices are also embedded in specific disciplines and industries. Thus, inevitably, interdisciplinary approaches will be required to develop robust and plausible future accounts of visual reasoning.