Introduction
The autophagic pathway is an evolutionarily highly conserved process, responsible for the degradation and recycling of long-term proteins and cytoplasmic organelles in eukaryotic cells (Levine and Klionsky, Reference Levine and Klionsky2004). In apoptotic programmed cell death, autophagy is also essential for correct embryo development, growth, regulation and maintenance of homeostasis in multicellular organisms (Agnello et al., Reference Agnello, Bosco, Chiarelli, Martino, Roccheri and Ntuli2015).
Autophagy is a key process during embryo development. In some animal models, such as mammals, lack of autophagy leads to the arrest, delay or defects of the developmental programme (Wada et al., Reference Wada, Sun-Wada, Kawamura and Aoyama2014). The autophagic process occurs constitutively at basal levels and appears to be involved in cell survival. Increased autophagy is induced by environmental stimuli such as starvation and hormones, accumulation of misfolded proteins and damaged organelles, toxic stimuli, radiation and many stress agents, while excessive levels of autophagy can lead to autophagic programmed cell death (PCD), with features that differ from those of the apoptotic process (Agnello et al., Reference Agnello, Bosco, Chiarelli, Martino, Roccheri and Ntuli2015). As autophagic PCD plays a key role in the development, morphogenesis and regeneration in several animal taxa, the identification of evolutionarily conserved components of the autophagic machinery is a basic starting point in order to unravel the role of autophagy both under physiological and pathological conditions (Xie & Klionsky, Reference Xie and Klionsky2007; Tettamanti et al., Reference Tettamanti, Saló, González-Estévez, Felix, Grimaldi and de Eguileor2008).
Autophagy has recently been proposed as a crucial mechanism for the cellular remodelling that occurs during the development of multicellular organisms, such as Caenorhabditis elegans, Drosophila melanogaster, and some vertebrates (Penaloza et al., Reference Penaloza, Lin, Lockshin and Zakeri2006; Di Bartolomeo et al., Reference Di Bartolomeo, Nazio and Cecconi2010; Yang & Zhang, Reference Yang and Zhang2014). Furthermore, it has been demonstrated that autophagy is essential for the preimplantation development of mouse embryos (Tsukamoto et al., Reference Tsukamoto, Kuma and Mizushima2008a,b).
Activation of autophagy in sea urchin P. lividus embryos was described for the first time by Chiarelli and colleagues in 2011. These results showed that autophagy is a molecular process that occurs in embryos, and is activated at basal level during physiological development and at higher levels after cadmium stress (Chiarelli et al., Reference Chiarelli, Agnello and Roccheri2011). In this latter case, autophagy represents a strategy to preserve the developmental programme (Chiarelli et al., Reference Chiarelli, Martino, Agnello, Bosco and Roccheri2016).
Recently, it was shown that the sea urchin eggs reach maturity following an optimal period, after which, if not fertilized, they commit suicide (Philippe et al., Reference Philippe, Tosca, Zhang, Piquemal and Ciapa2014), as it has been previously demonstrated in mammals, frogs and invertebrates such as D. melanogaster or starfish (Fissore et al., Reference Fissore, Kurokawa, Knott, Zhang and Smyth2002; Greenwood & Gautier, Reference Greenwood and Gautier2005). Furthermore, it was demonstrated that unfertilized eggs, which can be kept for days before being fertilized, use autophagy as a survival programme. Autophagy seems to be used in eggs destined to die by apoptosis after inactivation of the protein kinase extracellular signal-regulated kinase (ERK). Usually, a high ERK activity is essential to maintain cell cycle arrest of mature oocytes in mammals, frogs and invertebrates such as in starfish (Lera & Pellegrini, Reference Lera and Pellegrini2006). It has been suggested that the occurrence of apoptosis in unfertilized eggs comes after ERK inactivation and the establishment of autophagy as a survival programme when the cell cycle is blocked (Houel-Renault et al., Reference Houel-Renault, Philippe, Piquemal and Ciapa2013).
Although the studies on the role of autophagy represent a current research area, applied to various fields such as embryo development and physiology, no information is available about autophagy in sea urchin oogenesis steps until the mature egg stage. Furthermore, it is still unknown if autophagy is involved at the beginning of P. lividus development. The aim of this study was to elucidate these focal questions. To this purpose, we monitored and quantified the autophagic process in oocytes and early embryos using some methods developed by us and described in guidelines for the use and interpretation of assay for monitoring autophagy (Klionsky et al., Reference Klionsky, Abdalla, Abeliovich, Abraham, Acevedo-Arozena, Adeli, Agholme, Agnello, Agostinis and Aguirre-Ghiso2012, Reference Klionsky, Abdelmohsen, Abe, Abedin, Abeliovich, Acevedo-Arozena, Adachi, Adams, Adams and Adeli2016). Moreover, we discuss some possible consequences of autophagic blockage after fertilization.
Materials and methods
Oocyte collection
P. lividus adults were collected in the west coast of Sicily and oocytes were obtained from the gonads, by a slightly modified routine method (Giudice et al., Reference Giudice, Sconzo, Bono and Albanese1972). Specifically, ovaries from 10 adult females were excised and gently stirred in Millipore-filtered sea water (MFSW) in order to remove the bulk of the mature eggs. Released eggs were removed and the gonads washed three times by suspension in sea water and then four additional times in Ca++- and Mg++-free MFSW. Gonads were than suspended in 100 ml of Ca++- and Mg++-free MFSW containing 100 mg of pronase (Boehringer Mannheim, 165921) and gently stirred with a magnetic stirrer spinning at room temperature. After 45 min the ovary suspension was filtered through a 75 µm diameter mesh filter and filtered oocytes were sedimented at 1200 rpm for 60 s and washed twice by re-suspension and centrifugation at the same speed. Sedimented oocytes (about 1.2 ml) were finally suspended in 10 ml MFSW. This suspension contained all sizes of oocytes.
Fertilization and removal of the fertilization envelope
Eggs were fertilized in 10 µM of 4-aminobenzoic acid (PABA) diluted in MFSW to eliminate the fertilization envelope (FE), a barrier to the entry of antibodies. Then, zygotes were washed with MFSW. To remove the FE, softened by PABA treatment, embryos were passed three times through a 75 µm diameter mesh filter. Embryos exposed to this treatment did not suffer any adverse effects (Ettensohn et al., Reference Ettensohn, Wessel, Wray and McClay2004).
Embryo cultures
Embryos were cultured at a concentration of 5000/ml and grown under gentle rotation at 18°C in MFSW containing antibiotics (50 mg/l streptomycin sulphate and 30 mg/l penicillin). Embryo development was monitored by light microscopy (Olympus BX50).
Treatment with bafilomycin A1 and recovery
Collected oocytes, unfertilized and fertilized eggs (20 min after fertilization) were incubated with the autophagic inhibitor bafilomycin A1 (Baf A1) (ALEXIS Biochemical, ALX-380-030), at a final concentration of 200 nM, for 2 h, then washed twice and re-suspended in MFSW (Chiarelli et al., Reference Chiarelli, Agnello and Roccheri2011). Embryos were then cultured under physiological conditions and morphological observations were carried out after 2 or 22 h of recovery.
Acridine orange vital staining
Acridine orange (AO) (Sigma-Aldrich, A-6014) staining was performed to detect the number and the volume of acidic vesicular organelles (AVOs) in whole oocytes, and unfertilized and fertilized eggs (prior and after incubation with Baf A1) and on embryos at different developmental stages. Samples were incubated with AO at 5 μM final concentration, for 1 min (Chiarelli et al., Reference Chiarelli, Agnello and Roccheri2011). Then, samples were washed twice in MFSW to remove the excess dye and observed using a confocal laser scanning microscope (CLSM) (Olympus FV-300 equipped with argon, 488 nm and helium/neon, 543 nm, lasers) under a ×60 magnification oil immersion lens. Several optical sections (5-μm thick) of oocytes and embryos were acquired using a Nikon camera. Image acquisition and analysis were performed as described previously (Morici et al., Reference Morici, Agnello, Spagnolo, Roccheri, Di Liegro and Rinaldi2007).
Immunofluorescence
Immunofluorescence was performed on whole-mount fixed oocytes and embryos (Kiyomoto et al., Reference Kiyomoto, Zito, Costa, Poma, Sciarrino and Matranga2007). Subsequently, each sample was incubated for 1 h at room temperature in blocking solution: 0.5% albumin from bovine serum (Sigma-Aldrich, A7906) and 5% heat inactivated goat serum (Sigma-Aldrich, G9023) in phosphate-buffered saline with 0.1% Tween 20 (PBS-T) and overnight at 4°C with anti-LC3 antibody (Sigma- Aldrich, L8918), or with anti-cleaved caspase-3 (Cell Signaling, 9664), diluted respectively 1:125 and 1:100, in blocking solution. In the negative controls, the primary antibody was omitted. The following steps were performed as described previously (Chiarelli et al., Reference Chiarelli, Agnello and Roccheri2011, Reference Chiarelli, Agnello, Bosco and Roccheri2014).
Electrophoretic analysis and protein gel blot
Pellets of oocytes and early embryos were homogenized in lysis buffer (7 M urea, 2% CHAPS and 10 mM DTT) containing protease inhibitor cocktail tablets (Roche, 1836170). Protein concentration was evaluated using the Bradford method and 60 μg of samples were analysed by SDS-PAGE (13% gel). The molecular masses were evaluated by comparison with a set of standard proteins (Fermentas, SM0671). After electrophoretic separation, the proteins were transferred and immune-reacted as previously described (Roccheri et al., Reference Roccheri, Agnello, Bonaventura and Matranga2004). The antibodies employed were: rabbit polyclonal anti-LC3 (Sigma-Aldrich, L8918) and anti-actin (Sigma-Aldrich, A5060), both diluted 1:500, with respective incubation for overnight and 1 h, in 5% non-fat dried milk powder (EuroClone, EMR180500)/TBS-T (20 mM Tris, pH 7.6, 137 mM NaCl, 0.1% Tween 20). The secondary antibody used was an anti-rabbit IgG-horseradish peroxidase linked whole antibody, from donkey (Healthcare, NA934V) diluted 1:7500 in TBS. Bands were detected by chemiluminescence, using a CLARITY Western ECL Substrate (Healthcare, 170–5060) and the Molecular Imager VersaDoc MP Imaging Systems (BIO-RAD), following analysed by ImageJ software and normalized with respect to the anti-actin antibody reaction. This detection system has shown greater sensitivity compared with those systems employed in our previous studies, allowing us to identify both LC3-I/II forms. Data obtained by protein gel blot analysis are presented as mean ± standard error of the mean (SEM) of triplicate experiments.
Results
Detection of autophagic organelles
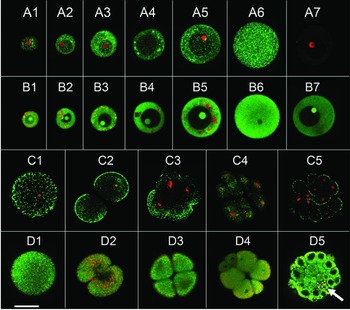
We performed in situ analysis by immunofluorescence with an anti-LC3 antibody able to detect both the LC3-I and LC3-II forms, a marker of autophagy. The green puncta corresponded to the LC3-II form, the active form of the protein indicated the occurrence of autophagy, while the widespread green fluorescence corresponded to the inactive form of LC3-I (Chiarelli et al., Reference Chiarelli, Agnello and Roccheri2011). Figure 1 A1–A7 shows the immunolocalization of LC3 protein during maturation of oocytes, with a diameter from 20 µm (Fig. 1 A1) to the mature egg form of 90 µm (Fig. 1 A6). We found that the puncta, localized in the cytoplasm, are evident in all stages of oogenesis and are sometimes grouped in clusters. In Fig. 1 B1–B7, we reported the results of in vivo AO vital staining for oocytes and mature eggs. These data show autolysosomes/AVOs red clusters from 20 µm (Fig. 1 B1) to 80 µm (Fig. 1 B5) oocyte diameter, indicating that physiological autophagy occurs at these stages of oogenesis. In the mature eggs (Fig. 1 B6) we observed the disappearance of red clusters, although small red dots are present. A drastic reduction in AVOs (Fig. 1 B7), obtained after treatment with bafilomycin A1 (Baf A1), an inhibitor of autophagy (Yamamoto et al., Reference Yamamoto, Tagawa, Yoshimori, Moriyama, Masaki and Tashiro1998), confirmed that these signals were symptomatic of autophagy.
In situ detection of AVOs signals and LC3 protein: equatorial optical sections of representative oocytes, eggs and embryos captured by CLSM. (A) Detection by immunofluorescence of LC3 on whole oocytes and mature egg: merge of LC3 (green) and propidium iodide staining (red). (A1–A6) Oocytes of 20-, 30-, 40-, 50-/60-, 70-/80-µm diameter and mature egg of 90 µm. (A7) Negative control: oocyte of 60 µm size. (B) AO vital staining on whole oocytes and mature egg: merge of nucleic acids (green) and AVOs (red) fluorescence. (B1–B7) Oocytes at correspondent size to those shown in the panel (A). (B7) Treatment with the Baf A1 inhibitor: oocyte of 75 µm size. (C) Detection by immunofluorescence of LC3 on whole embryos: merge of LC3 (green) and propidium iodide staining (red). (C1–C5) Zygote (20 min after fertilization), two-, four-, 16- and 32-blastomere stage. (D) AO vital staining on whole embryos: merge of nucleic acids (green) and AVOs (red) fluorescence. (D1–D5) Embryos at correspondent developmental stage to those shown in the panel (C). The arrow (D5) indicates AVOs in the micromeres. Bar represents 50 μm.

The results obtained by immunofluorescence for LC3 protein in the zygote (20 min after fertilization) and at the 2, 4, 16 and 32 blastomere stages are shown in Fig. 1 C1–C5. The fertilization process seems to induce an assemblage of the autophagosomes in clusters and a decrease in the widespread green fluorescence, corresponding to LC3-I (Fig. 1 C1), in comparison with unfertilized eggs (Fig. 1 A6). AVOs are particularly abundant at the 2-blastomere stage around the nuclei (Fig. 1 D2) and at the 32-blastomere stage they are located into the micromeres, the small cells at the vegetative pole of the embryos (Fig. 1 D5).
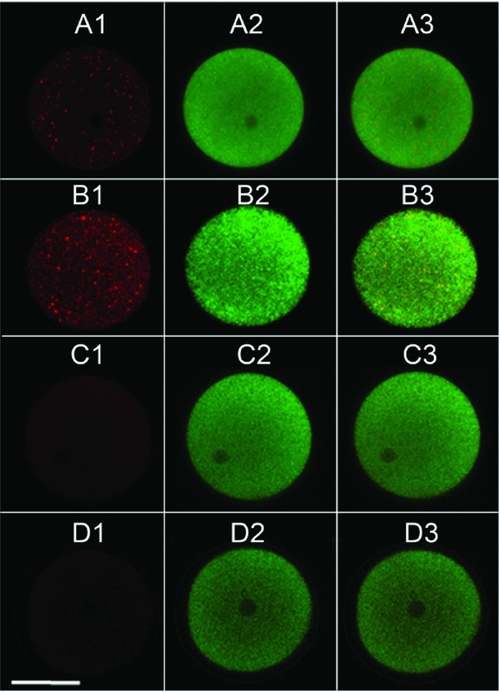
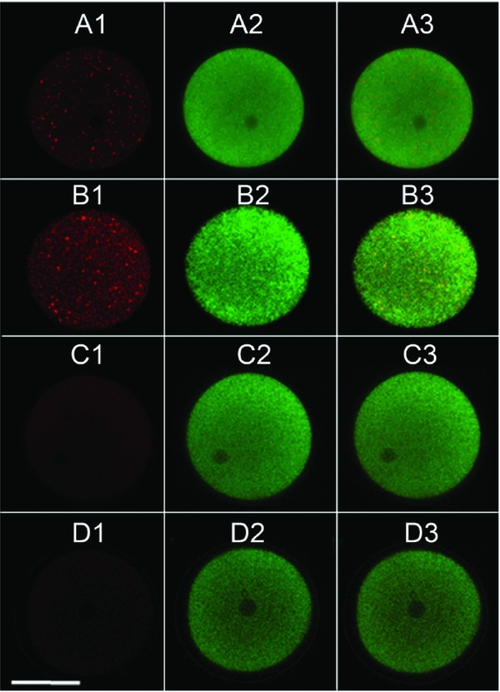
The increase in AVOs observed after fertilization (Fig. 2 B), in comparison with unfertilized eggs (Fig. 2 A), was confirmed by treatment with Baf A1. Results showed a disappearance of red signals in both unfertilized and fertilized eggs, excluding potential autofluorescence due to the calcium wave occurring at fertilization (Fig. 2 C, D).
In situ detection of AVOs signals after AO vital staining: equatorial optical sections of representative unfertilized and fertilized eggs captured by CLSM. (A) Unfertilized egg. (B) Fertilized egg. (C) Unfertilized egg after 2 h of treatment with Baf A1 inhibitor. (D) Fertilized egg after 2 h of treatment with Baf A1 inhibitor. (A1, B1, C1, D1) AVOs (red) fluorescence. (A2, B2, C2, D2) Nucleic acids (green) fluorescence. (A3, B3, C3, D3) Merged green and red fluorescence. Bar represents 50 μm.
Quantification of autophagic signals
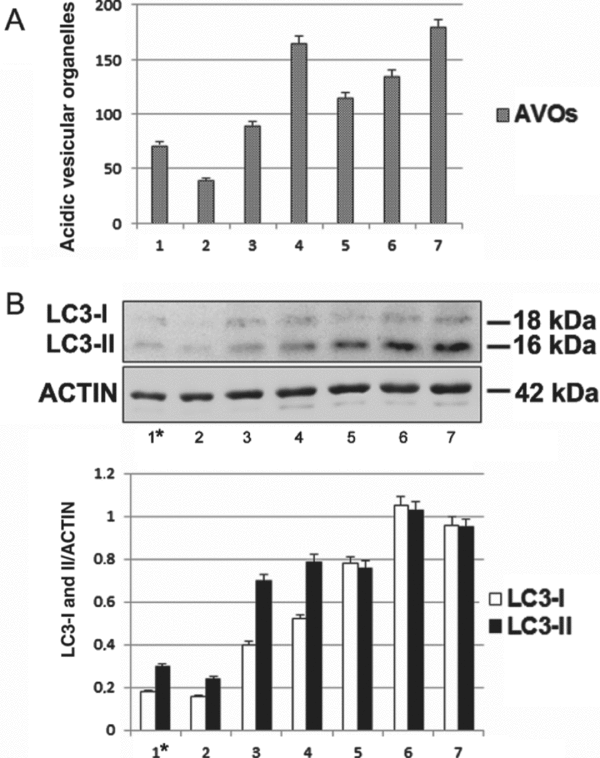
The red signals corresponding to AVOs were measured by ImageJ software analysis, and the results are reported in the histogram in Fig. 3 A. Quantification showed an increase in signal from virgin eggs to the 32-blastomere stage, highlighting a great quantity of AVOs at the 2-blastomere stage (Fig. 3 A2–A7). The 80 µm oocytes, next to the end of oogenesis, showed the most numbers of AVOs (Fig. 3 A1) when compared with virgin eggs (Fig. 3 A2).
Quantification of AVOs and LC3-I/II forms, in the oocytes, eggs and embryos. (A) Amount of AVOs signals, in situ detected by CLSM, for 80 µm oocytes (1); unfertilized eggs (2); zygotes, 20 min after fertilization (3); two, four, 16 and 32 blastomeres respectively (4), (5), (6) and (7). In the ordinate: intensity values obtained after quantification of the AVOs signal (arbitrary values). (B) Immunoblotting of LC3-I and LC3-II forms. Top: Set of oocytes (1); unfertilized eggs (2); zygotes, 20 min after fertilization (3); two, four, 16 and 32 blastomeres respectively (4), (5), (6) and (7). The same samples were incubated with anti-actin antibody. Bottom: Densitometric analysis of bands visualized by immunoreaction. Results were obtained from the analysis of LC3-I and LC3-II band intensities, normalized by comparison to actin and reported as arbitrary units. Data in the histogram are presented as the mean of triplicate experiments.
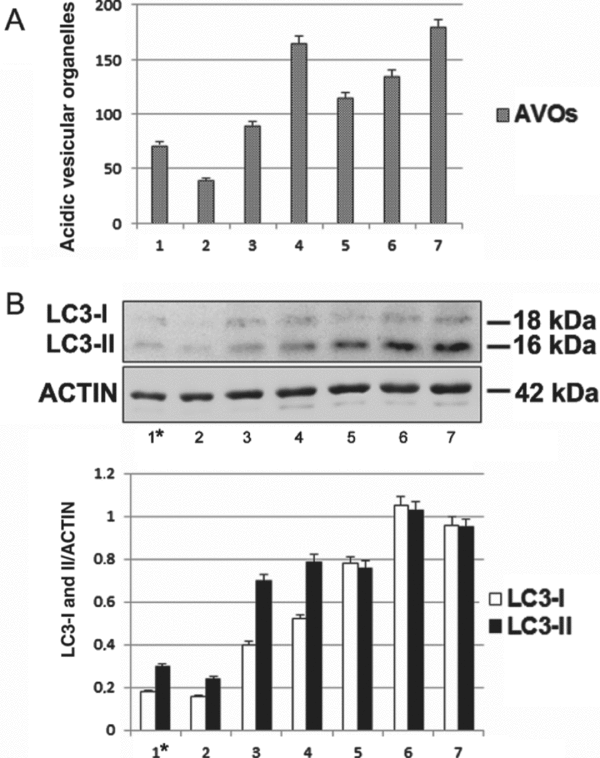
In addition to qualitative analysis achieved by CLSM, we performed western blot assays using an anti-LC3 antibody (Fig. 3 B) to measure the amount of both LC3-I/II forms. Results showed a parallel increase in both LC3-II and LC3-I forms, from a set of oocytes of different sizes (Fig. 3 B1*) to the 32-blastomere stage (Fig. 3 B7). Densitometric analysis of these signals (Fig. 3, bottom) confirmed these results. It is noteworthy that, in the fertilized eggs and at the 2-blastomere stage, an evident increase in the LC3-II form is noticeable.
Morphologic effects of autophagy inhibition
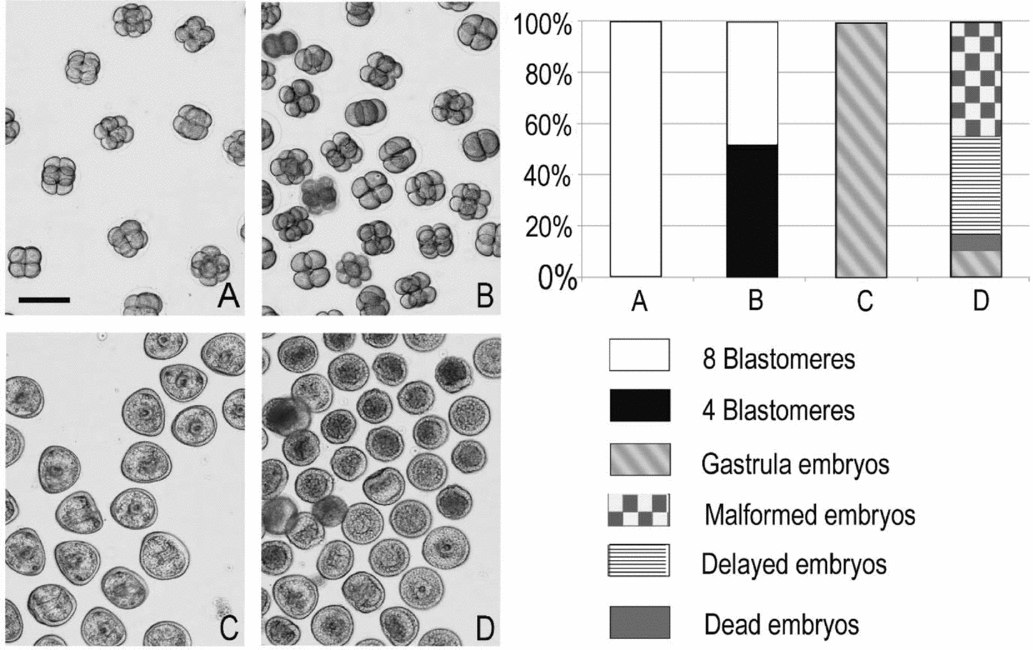
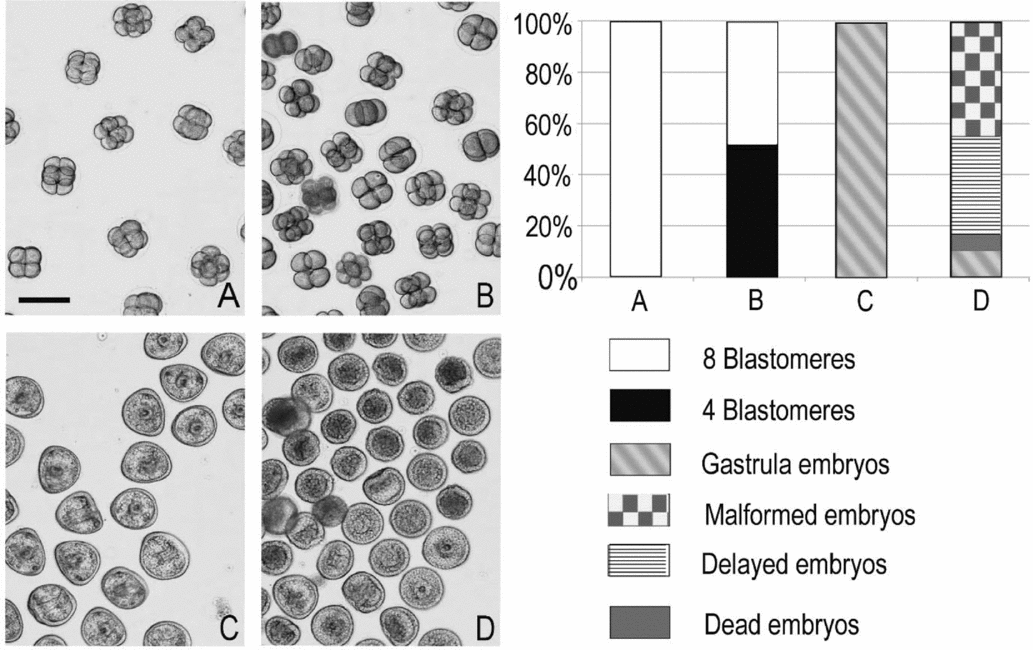
In order to analyse the effects of autophagic inhibition, morphological analyses were carried out on embryos incubated with Baf A1 for 2 h and then grown under physiological conditions for a further 22 h (recovered embryos) (Fig. 4). The data, presented as the mean of triplicate experiments, are summarized in the histogram. Results revealed that after 2 h of development, Baf A1-treated embryos (Fig. 4 B) show developmental delays: specifically, about 52% (SD ± 3) of embryos were at the 4-blastomere stage and 48% (SD ± 4) at the 8-blastomere stage, while control embryos were all at the 8-blastomere stage (Fig. 4 A). After 24 h of development, about 10% (SD ± 2) of recovered embryos (Fig. 4D) showed a regular morphology, while 45% (SD ± 1) were malformed, 39% (SD ± 4.5) delayed and 6% (SD ± 1) dead, in contrast with control embryos that were all at the gastrula stage (Fig. 4 C). These results indicate that inhibition of autophagy, even for only 2 h, causes significant and irreversible effects on embryo morphology, clearly evident after 24 h of development.
Morphological analysis of embryos captured by light microscopy. (A) Control embryos after 2 h of growth. (B) Embryos incubated with Baf A1 for 2 h. (C) Control embryos after 24 h of development. (D) Embryos incubated with Baf A1 for 2 h and recovered for 22 h. The histogram shows the percentage of eight blastomeres, four blastomeres, gastrula, malformed and delayed gastrulae. Data are presented as the mean of triplicate experiments (100 embryos for each sample) and the standard deviations (SD) are reported in the Results section. Bar represents 150 μm.
Autophagy inhibition, recovery and apoptosis
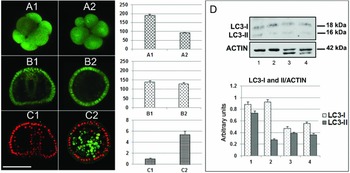
The inhibition of autophagy was confirmed analysing the reduction of AVOs through AO incubation of whole embryos and CLSM analysis. Figure 5 shows equatorial optical sections of representative embryos with the related quantification of red fluorescence signals after 2 h (Fig. 5 A1, A2) or 24 h (Fig. 5 B1, B2) of development. Control embryos (Fig. 4 A1, B1), after AO staining, showed basal levels of red dots, indicating that physiological autophagy occurs at these stages of development. Embryos treated with Baf A1 for 2 h (Fig. 5 A2) showed a reduction in red AVOs signals, indicating the effective inhibition of autophagy, while after 22 h of recovery (Fig. 5 B2) they manifested a restoration of autophagic signals, although embryonic development was irreversibly impaired. Figure 5 D reports (top) the result of western blot analysis using an anti-LC3 antibody. The densitometric analysis of signals (bottom) showed that after 2 h of incubation with Baf A1, embryos showed a strong reduction in the LC3-II form, if compared with control embryos. After 24 h of development, control embryos and embryos treated with Baf A1 for 2 h and recovered for 22 h (although with a lower amount of both LC3-II and LC3-I, in respect to embryos after 2 h of development) showed a similar trend in signals.
Autophagic and apoptotic signals in embryos after inhibition of autophagy and after recovery. (A, B) AO vital staining on whole embryos. (A1) Control embryo, 2 h of development. (A2) Embryo incubated with Baf A1 for 2 h. (B1) Control embryo, 24 h of development. (B2) Embryo incubated with Baf A1 for 2 h and recovered for 22 h. In the middle: densitometric analysis of AO red signals. (C) Immunofluorescence detection of cleaved caspase-3 on whole embryos after 24 h of development: merge of green and red, obtained by cleaved caspase-3 detection and propidium iodide staining, respectively. (C1) Control embryo, 24 h of development. (C2) Embryo incubated with Baf A1 for 2 h and recovered for 22 h. Bar represents 50 μm. Middle: Densitometric analysis of cleaved caspase-3. (D) Immunoblotting of LC3-I and LC3-II forms. Top: Control embryos, 2 h of development (1); embryos incubated with Baf A1 for 2 h (2); control embryos, 24 h of development (3); embryos incubated with Baf A1 for 2 h and recovered for 22 h (4). The same samples were incubated with anti-actin antibody. Bottom: densitometric analysis of LC3-I and LC3-II band intensities, normalized by comparison to actin and reported as arbitrary units. In the ordinate: intensity values obtained after quantification of the LC3-I and II signals. Histogram values are the mean of triplicate experiments.

Considering the dangerous effects of autophagic inhibition on embryo morphology, we analysed the possible occurrence of apoptotic events. It is well known that sea urchin embryos are able to activate apoptosis (Roccheri et al., Reference Roccheri, Barbata, Cardinale, Tipa, Bosco, Oliva, Cascino and Giudice1997; Roccheri et al., Reference Roccheri, Tipa, Bonaventura and Matranga2002) as defence strategy, usually operating by caspases activation cascade, in which cleaved caspase-3 is the main executor, as it was also demonstrated in P. lividus embryos (Robertson et al., Reference Robertson, Croce, Carbonneau, Voronina, Miranda, McClay and Coffman2006; Agnello et al., Reference Agnello, Filosto, Scudiero, Rinaldi and Roccheri2007; Agnello & Roccheri, Reference Agnello and Roccheri2010). Therefore, by immunofluorescence on whole embryos, after 24 h of development, we investigated the eventual activation of caspase-3. Results showed that embryos, after autophagic inhibition and subsequent recovery for 22 h (Fig. 5 C2) exhibit high levels of apoptosis as shown by the intensity of green fluorescence after in situ immunoreaction with anti-cleaved caspase-3 antibody.
Discussion
Sea urchins are a group of animals that complete meiotic maturation of oocytes prior to fertilization. Oogenesis is a prolonged process of cell differentiation that involves cell growth, new organelle synthesis and storage. The time required for a population of oocytes to grow and differentiate depends on the sea urchin species, ranging from 1 to 3 months. During oocyte maturation, the cell structure changes dramatically with a size increase from 10–15 μm diameter to one 10 times greater (Walker et al., Reference Walker, Harrington, Lesser and Fagerberg2005; Song et al., Reference Song, Wong and Wessel2006). In this huge process of growth and reorganization, autophagy could have a crucial role in elimination or recycling of various cell components, influencing the quality of oocytes and contributing to fertilization and embryo development success.
During development, the cells undergo various processes, including proliferation, cell death and differentiation, thus allowing the embryo to transform into a larva. In this context, autophagy can be considered to be a key mechanism for cellular remodelling and clearance that occur during the complex events of development and metamorphosis (Di Bartolomeo et al., Reference Di Bartolomeo, Nazio and Cecconi2010).
This study describes our recent findings on the activation of autophagic process from oogenesis to early stages of P. lividus embryo development and highlights the possible consequences of autophagic blockage after fertilization, such as the impairment of correct development and the induction of apoptotic cell death.
We found high levels of autophagic signals (LC3-II and AVOs) during oocyte maturation, probably for the recycling of cellular components that accumulate during oogenesis and for the following breakdown of the germinal vesicle, while in the mature eggs we did not found clusters of AVOs, but only autophagic vesicles spread in the cytoplasm.
After fertilization, an increase in the autophagic process may be necessary for the digestion of the little amount of yolk and, after each cleavage, for cells clearance, namely for the elimination of certain cellular components that are no longer required during development.
It is important to highlight that treatment with Baf A1 just after fertilization, even if only for 2 h, causes delays and malformations. Removal of the inhibitor and the following recovery of embryos restored the autophagic signals that appear located on the surface of the embryo. We also observed a strong activation of the apoptotic process, with signals (caspase 3) located in the inner cells of the embryo.
These data show a close relationship between autophagy and apoptosis, suggesting an intervention of apoptosis to eliminate the cells irreversibly compromised by damage caused by autophagic inhibition. At present, the crosstalk among these two processes has been previously highlighted in sea urchin embryos under stress conditions (Chiarelli et al., Reference Chiarelli, Agnello, Bosco and Roccheri2014; Agnello et al., Reference Agnello, Bosco, Chiarelli, Martino, Roccheri and Ntuli2015).
Taken together, these data indicate that autophagy has a crucial role during oogenesis in P. lividus, as well as after fertilization and during early embryogenesis, as confirmed by the irreversible impairment of development due to its inhibition. The disclosure of these mechanisms provides an important tool to expand knowledge on the sea urchin model system, revealing important markers to predict oogenesis and early developmental success. The present study leads to the hypothesis that autophagy could act: (i) during oogenesis, as a mechanism of survival and maturation, acting respectively in the recycling of cellular components and in the breakdown of the germinal vesicle; (ii) after fertilization, to direct correct development; (iii) during early embryogenesis, for yolk digestion and/or for removal of obsolete proteins and organelles; and (iv) in the micromeres, probably for mechanisms linked to the subsequent gastrulation process. These considerations pave the way for further investigation into the role of autophagy during development.
Acknowledgements
This research received no specific grant from any funding agency, commercial or not-for-profit sectors.