


1. Introduction
Fish swimming and bird/insect flight, with ‘their fascinating nature to appreciate, diversity to behold, and complications to comprehend’ (Wu Reference Wu2011), have aroused widespread interest in the research of interdisciplinary fields, e.g. biomechanics of animal locomotion and bionics, and stimulated innovative collaborations between scientists and engineers. Both flyers and swimmers in nature may utilize their oscillating appendages (wings and fins, here referred to as ‘propellers’) to generate thrust and/or lift as they propel themselves through fluids. Although the kinematics of biological propellers are typically complex, their essential features shared by various flyers and swimmers may be characterized by reasonably using some basic motion modes, involving pitching, heaving and their combinations. Thus, numerous theoretical (Nicholas & Moore Reference Nicholas and Moore2014; Alon Tzezana & Breuer Reference Alon Tzezana and Breuer2019), experimental (Anderson et al. Reference Anderson, Streitlien, Barrett and Triantafyllou1998; Ramananarivo, Godoy-Diana & Thiria Reference Ramananarivo, Godoy-Diana and Thiria2011) and numerical studies (Li & Lu Reference Li and Lu2012; Uddin, Huang & Sung Reference Uddin, Huang and Sung2015) have focused on the dynamics of the flapping foil/plate system, which provides an elegant and deft way for understanding the underlying principles in biological propulsion. Besides, the relevant research on the flapping-based locomotion also provided inspirations for developing innovative artificial biomimetic systems (Wu Reference Wu2011).
A recent field of investigation on the flapping foil/plate systems concerns the thrust generation and its relation to wake pattern evolution, the major interrogation being about how to parameterize the drag-to-thrust transitions (DTT) and the wake transitions (WT) (Andersen et al. Reference Andersen, Bohr, Schnipper and Walther2017; Lagopoulos, Weymouth & Ganapathisubramani Reference Lagopoulos, Weymouth and Ganapathisubramani2019; Chao, Alam & Ji Reference Chao, Alam and Ji2021). Although the inviscid theory predicts a DTT as the wake changes from the von Kármán wake to reversed von Kármán wake (von Kármán & Burgers Reference von Kármán and Burgers1935), the observations in experiments and simulations have revealed a lag between the WT and the DTT, due to the need to overcome the viscous and differential pressure resistance (Streitlien & Triantafyllou Reference Streitlien and Triantafyllou1998; Andersen et al. Reference Andersen, Bohr, Schnipper and Walther2017; Lagopoulos et al. Reference Lagopoulos, Weymouth and Ganapathisubramani2019). For example, the study presented by Andersen et al. (Reference Andersen, Bohr, Schnipper and Walther2017) has shown that, for a flapping rigid foil in a two-dimensional flow, the WT occurs at  $St_A=0.18$, which precedes the DTT at
 $St_A=0.28$. The amplitude-based Strouhal number
 $St_A=2Af/U$, where U is the speed of uniform inflow, A and f are the flapping amplitude and frequency, respectively. Lagopoulos et al. (Reference Lagopoulos, Weymouth and Ganapathisubramani2019) further scaled the WT between the classical von Kármán wake and the reversed von Kármán wake for the flapping rigid foils with various kinematics, by introducing the chord-averaged trajectory length,
 $\mathcal {T}$. Results from the wake maps indicated that the onset of WT leads to
 $St_{\mathcal {T}}=\mathcal {T}f/U\rightarrow 1$, which offers a physical insight into the wake development. More recently, a numerical investigation carried out by Chao et al. (Reference Chao, Alam and Ji2021) indicated that the lag between DTT and WT exists in the pitching rigid foils with both symmetric and asymmetric oscillations.
Although invaluable insight into the basic aspects of flapping-based locomotion has been provided by investigations mentioned above, several issues are still open questions. One important and intriguing issue is about the passive role of wing/fin flexibility. In general, the biological wings and fins are flexible and often undergo a large passive deformation under the combined inertial, elastic and fluid forces. A variety of studies (Kang et al. Reference Kang, Aono, Cesnik and Shyy2011; Ramananarivo et al. Reference Ramananarivo, Godoy-Diana and Thiria2011; Alben et al. Reference Alben, Witt, Baker, Anderson and Lauder2012; Quinn, Lauder & Smits Reference Quinn, Lauder and Smits2014; Zhu, He & Zhang Reference Zhu, He and Zhang2014; Alon Tzezana & Breuer Reference Alon Tzezana and Breuer2019) have indicated that the deformations affect many aspects of the flapping-based locomotion, including wake structures and propulsive performances. Beyond the above investigations on the rigid foil-flapping systems (Andersen et al. Reference Andersen, Bohr, Schnipper and Walther2017; Lagopoulos et al. Reference Lagopoulos, Weymouth and Ganapathisubramani2019; Chao et al. Reference Chao, Alam and Ji2021), here we mainly aim to explore the effects of passive flexibility on the DTT/WT and propulsive characteristics for a flexible plate with the prescribed kinematics.
In the present study, we consider a particular version of flapping-based propulsion systems, in which the wings or fins are treated as a flexible plate with a negligible thickness, undergoing the forced harmonic pitching oscillation at the leading edge in a uniform oncoming flow. The influence of bending stiffness, pitching amplitude and pitching frequency on the wake patterns, thrust generations and propulsive performances of the system have been systematically investigated. The resonance mechanism for the performance enhancement is revealed and confirmed in a wide range of parameters considered here. Further efforts are made to seek a universal metric for scaling not only the DTT/WT but also the propulsive performance, inspired by the work of Lagopoulos et al. (Reference Lagopoulos, Weymouth and Ganapathisubramani2019). The rest of the present paper is organized as follows. The physical problem and mathematical formulation are described in § 2. The numerical method and validation are presented in § 3. The result and discussion are given from a comprehensive numerical investigation in § 4. Finally, the concluding remarks are addressed in § 5.
2. Physical problem and mathematical formulation
The schematic diagram of a pitching flexible plate considered in the present study is shown in figure 1. The plate with length  $L$ is immersed in a uniform inflow with speed
 $U$ in the
 $x$-direction, and pitches around the leading edge such that the pitching angle
 $\theta$ with respect to the free-stream direction varies with the simple harmonic motion
 \begin{equation} \theta (t) = \theta_0 \cos 2 {\rm \pi}f t, \end{equation}
where  $\theta _0$ is the maximum pitching angle,
 $\omega = 2 {\rm \pi}f$ is the angular frequency of oscillation. The leading edge of the flexible plate is fixed, and the other part can move freely and deform passively due to the flow–structure interactions.
Schematic diagram for a pitching flexible plate. The plate with length  $L$ is immersed in a uniform inflow with speed
 $U$ in the
 $x$-direction, and is forced to pitch around the leading edge with the pitching angle
 $\theta$ with respect to the free-stream direction. Here
 $\theta (t)= \theta _0\cos 2 {\rm \pi}f t$, where
 $\theta _0$ is the maximum pitching angle, and
 $f$ is the frequency.

In this system, the fluid flow is governed by the incompressible Navier–Stokes equations
 $$\begin{gather} \frac{\partial \boldsymbol{v}}{\partial t}+\boldsymbol{v}\boldsymbol{\cdot}\boldsymbol{\nabla}\boldsymbol{v}={-}\frac{1}{\rho}\boldsymbol{\nabla} p+\frac{\mu}{\rho}\nabla^2\boldsymbol{v}+\boldsymbol{f}_b, \end{gather}$$
 $$\begin{gather}\boldsymbol{\nabla}\boldsymbol{\cdot}\boldsymbol{v}=0, \end{gather}$$
where  $\boldsymbol {v}=(u,v)$ is the velocity,
 $p$ is the pressure,
 $\rho$ is the density of the fluid,
 $\mu$ is the dynamic viscosity and
 $\boldsymbol {f}_b$ is the body force term. A uniform velocity
 $U$ is set at the inlet boundary and the side boundaries of the fluid computational domain. A Neumann condition is specified at the outlet boundary. The deformation and motion of the flexible plate are described by the structural equation (Hua, Zhu & Lu Reference Hua, Zhu and Lu2013)
 \begin{equation} \rho_s h\frac{\partial^2 \boldsymbol{X}}{\partial t^2} -Eh\frac{\partial}{\partial s}\left[\left( 1-\left|\frac{\partial \boldsymbol{X}}{\partial s}\right|^{{-}1} \right) \frac{\partial \boldsymbol{X}}{\partial s} \right]+ EI\frac{\partial^4 \boldsymbol{X}}{\partial^4 s}=\boldsymbol{F}_s, \end{equation}
where  $s$ is the Lagrangian coordinate along the flexible plate, h is the structure thickness,
 $\boldsymbol {X}(s, t)=(X(s, t), Y(s, t))$ is the position vector of the plate,
 $\boldsymbol {F}_s=(F_x, F_y)$ is the Lagrangian force exerted on the plate by the surrounding fluid, and
 $\rho _s$ is the structural density. Here
 $Eh$ and
 $EI$ are the structural stretching and bending rigidity, respectively. For the structural equation, the boundary condition at the leading edge of the plate is
 $\boldsymbol {X}(t)=(0,0)$,
 ${\partial \boldsymbol {X}}/{\partial s}=(\cos \theta,\sin \theta )$, and the boundary condition at the free end of the plate is
 $-Eh ( 1-|{\partial \boldsymbol {X}}/{\partial s}|^{-1} ) {\partial \boldsymbol {X}}/{\partial s}+ EI{\partial ^3 \boldsymbol {X}}/{\partial ^3 s}=0$,
 ${\partial ^2 \boldsymbol {X}}/{\partial s^2}=0$.
The characteristic quantities,  $\rho$,
 $L$ and
 $U$, are chosen to normalize the above equations. Thus the following dimensionless governing parameters are introduced: the Reynolds number
 $Re=\rho UL/\mu$, the flapping amplitude
 $A_L = 2A/L = 2 \sin \theta _0$ (where A is dimensional semi-amplitude of the trailing edge without considering the plate's passive deformation), the
 $L$-based Strouhal number (or reduced frequency)
 $St=Lf/U$, the stretching stiffness
 $S=Eh/(\rho U^{2} L)$, the bending stiffness
 $K=EI/(\rho U^{2} L^{3})$, the mass ratio of the plates and the fluid
 $M=\rho _s h/(\rho L)$. Moreover, the relevant parameters, including the thrust coefficient (
 $C_T$) and the power coefficient (
 $C_P$), are introduced to evaluate the performance of the pitching plate, and defined respectively as
 \begin{align} C_T=\frac{T}{0.5\rho U^2L}=\frac{- \langle {F}_{x}(s,t) \rangle}{0.5\rho U^2L}\quad {\rm and}\quad C_p = \frac{P}{0.5\rho U^3L} = \frac{\langle -\boldsymbol{F}_{s}(s,t)\boldsymbol{\cdot}{\partial_t \boldsymbol{X}(s,t)} \rangle}{0.5\rho U^3L}, \end{align}
where T is the cycle-averaged net thrust for the overall plate, i.e.  $T=-\left \langle {F}_{x}(s,t)\right \rangle$, P is the cycle-averaged power for the overall plate, i.e.
 $P=\left \langle -\boldsymbol{F}_{s}(s,t)\boldsymbol{\cdot} {\partial_t \boldsymbol{X}(s,t)}\right \rangle$, and
 $\langle \cdot \rangle := ({1}/{T_f}) \int _{t_0}^{t_0+T_f}\int _{0}^{1}(\cdot )\, \mathrm {d}s\,{\rm d}t$ (
 $T_f$ is flapping period, i.e.
 $T_f=1/f$, and
 $t_0$ is the instant when the periodicity is reached, e.g.
 $t_0=20T_f$ for most cases).
3. Numerical method and validation
The Navier–Stokes equations are solved numerically by the lattice Boltzmann method (Chen & Doolen Reference Chen and Doolen1998), and the structure equation (2.4) is discretized by a nonlinear finite element method with the co-rotational scheme (Doyle Reference Doyle2001). The immersed boundary method is applied to treat flow–structure interaction (Peskin Reference Peskin2002). The body force term  $\boldsymbol {f}_b$ in (2.2) represents an interaction force between the fluid and the immersed boundary to enforce the no-slip velocity boundary condition. A detailed description of the numerical method can be found in our previous papers (Peng, Huang & Lu Reference Peng, Huang and Lu2018a).
Based on our convergence studies with different computational domains, the computational domain for fluid flow is chosen as  $50L \times 30L$ in the
 $x$- and
 $y$-directions. The domain is large enough so that the blocking effects of the boundaries are not significant. According to independence studies for the grid spacing and time step, in the
 $x$- and
 $y$-directions, the mesh is uniform with spacing
 $\Delta x=\Delta y=L/100$. The flexible plate is discretized with a mesh size of
 $\Delta s = L/100$. The time step is
 $\Delta t=T_f/10\,000$ for the simulations of fluid flow and plate motion, with
 $T_f=1/f$ being the flapping period. The numerical strategy used in this study has been validated in our previous numerical investigations on the self-propulsion of flapping flexible plates, and a detailed numerical validation can be found in the previous papers (Hua et al. Reference Hua, Zhu and Lu2013; Peng et al. Reference Peng, Huang and Lu2018a; Peng, Huang & Lu Reference Peng, Huang and Lu2018b). Besides, the numerical strategy has also been successfully applied to a wide range of flows, such as the dynamics of a three-dimensional circular flexible plate in a uniform flow (Hua, Zhu & Lu Reference Hua, Zhu and Lu2014).
4. Results and discussion
In the study, the effects of bending stiffness ( $1 < K < 10^3$), flapping amplitude (
 $0.4\le A_L \le 1.2$) and Strouhal number (
 $0.2\le St\le 1.2$) on the WT/DTT and propulsive performances of the system are investigated. It is noted that the rigid plate cases with the corresponding parameters are also simulated for comparisons. In all our simulations, the Reynolds number, mass ratio and stretching stiffness are fixed at
 $Re=240$,
 $M=1$ and
 $S=1000$, respectively. The
 $S$ is chosen as a large value so that the stretching deformation of the plate can be neglected. The Reynolds number, which lies in a moderate range with a significant viscous effect, is representative of the insect flight (Michelin & Smith Reference Michelin and Smith2009) or swimming of small animals, e.g. tadpole and zebrafish larvae (Gazzola, Argentina & Mahadevan Reference Gazzola, Argentina and Mahadevan2014). Here
 $M=1$ matches with
 $M\sim O(1)$ for the case of a flexible flapping plate in the air, which is a representative value for the wing of an insect, such as dragonfly (Jongerius & Lentink Reference Jongerius and Lentink2010).
4.1. Wake patterns and the thrust generations
In this section, we analyse the wake patterns and thrust generations in the  $St-A_L$ plane for various
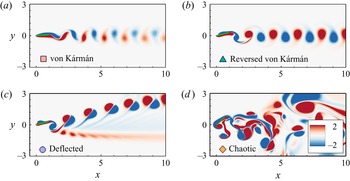
 $K$. Based on a variety of simulations for a wide range of parameters considered here, we have identified four typical wake patterns emerging from various kinematics, i.e. von Kármán, reversed von Kármán, deflected and chaotic wakes. Animated visualisations of the typical wake patterns have also been provided in supplementary movies available at https://doi.org/10.1017/jfm.2022.268. Figure 2(a) shows the instantaneous vorticity contour for the rigid case with
 $St=0.6$,
 $A_L=0.2$, corresponding to the von Kármán wake. It is seen that the shear layer with positive (or negative) vorticity on the lower (upper) surface of the plate begins to separate near the trailing edge. And it rolls up to form a pair of alternately shedding vortices, which convect downstream parallel to the centre line as two rows of vortices having opposite rotation in the far wake (see figure 2a). Figure 2(b) illustrates the development and spatial organization of the reversed von Kármán for the rigid case with
 $St=0.6$,
 $A_L=0.6$. In contrast to the von Kármán wake, the vortices with anticlockwise or clockwise rotation are located above or below the centre line, respectively. The vortices in this configuration may induce a backward jet in the wake, which can be considered a prognosticator of thrust generation. The instantaneous vorticity contour for the rigid case with
 $St=1.0$,
 $A_L=0.6$, corresponding to the deflected wake, is shown in figure 2(c). As one can see, a series of counter-rotating vortex pairs align with each other and travel downstream with a deflection angle with respect to the free-stream direction. The distance between cores of counter-rotating vortices in the vortex pair is very small, so that a stronger propulsive jet may be induced by the vortex pair according to the Biot–Savart law (Habibah & Fukumoto Reference Habibah and Fukumoto2017). Besides, for the case with higher
 $St$ and
 $A_L$, e.g.
 $St=1.2$,
 $A_L=1.2$ and
 $K=50$, a chaotic vortical structure may be found in the wake of the pitching plate, as shown in figure 2(d). Moreover, it is worth noting that the four typical wake patterns in our simulations are ubiquitous in the flapping foil/plate systems, which are consistent with the observations in literature (Hua et al. Reference Hua, Zhu and Lu2013; Zhu et al. Reference Zhu, He and Zhang2014; Andersen et al. Reference Andersen, Bohr, Schnipper and Walther2017; Lagopoulos et al. Reference Lagopoulos, Weymouth and Ganapathisubramani2019; Chao et al. Reference Chao, Alam and Ji2021).
The instantaneous vorticity contours for the four typical wake patterns of the pitching plate: (a) von Kármán ( $St=0.6$,
 $A_L=0.2$ and
 $K=\infty$), (b) reversed von Kármán (
 $St=0.6$,
 $A_L=0.6$ and
 $K=\infty$), (c) deflected (
 $St=1$,
 $A_L=0.6$ and
 $K=\infty$) and (d) chaotic wakes (
 $St=1.2$,
 $A_L=1.2$ and
 $K=50$).

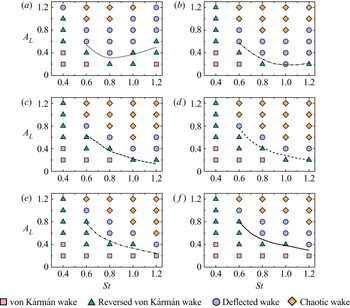
Figure 3 shows the phase diagrams for the four typical wake patterns in the  $St-A_L$ plane for the pitching plates with various flexibility. The rigid plate scenarios (
 $K=\infty$) are also shown in figure 3( f) for comparisons. It is illustrated clearly that a similar WT occurs for all the rigid and flexible cases, especially, as the increase of
 $A_L$ and
 $St$ (from the bottom left to top right in the phase diagrams), the von Kármán, reversed von Kármán, deflected and chaotic wakes are observed in succession. All the cases with the von Kármán wake exist within the drag-producing regime, while cases with the deflected or chaotic wake exist within the thrust-producing regime. Compared to the rigid-plate scenario as shown in figure 3( f), the proper flexibility of the plate may inhibit the drag-producing wake and trigger the transitions to the propulsive-producing wake for the identical kinematics (e.g. figure 3b,c). The best-fit curves (where the net thrust is zero) are denoted in the
 $St-A_L$ plane (see figure 3), showing the DTT for various
 $K$. It is clear that a lag exists between the WT and the DTT because a weak propulsive wake cannot overcome profile drag or velocity fluctuations and pressure difference within the control volume (Lagopoulos et al. Reference Lagopoulos, Weymouth and Ganapathisubramani2019). This observation is in agreement with previous measurements and simulations for the flapping rigid foils (Andersen et al. Reference Andersen, Bohr, Schnipper and Walther2017; Lagopoulos et al. Reference Lagopoulos, Weymouth and Ganapathisubramani2019; Chao et al. Reference Chao, Alam and Ji2021), but it is confirmed for the first time in the flexible-plate scenarios, according to our simulations.
Overview of the four typical wake pattern regions on the  $St-A_L$ plane for the pitching plate with
 $K=3$ (a), 5 (b), 10 (c), 20 (d), 50 (e) and
 $\infty$ ( f). The symbols
 $\square$,
 $\vartriangle$,
 $\circ$, and
 $\diamond$ represent the von Kármán, reversed von Kármán, deflected and chaotic wakes, respectively. The black best-fit curves show the DTT for various
 $K$.

4.2. Scaling laws for the wake and drag-to-thrust transitions
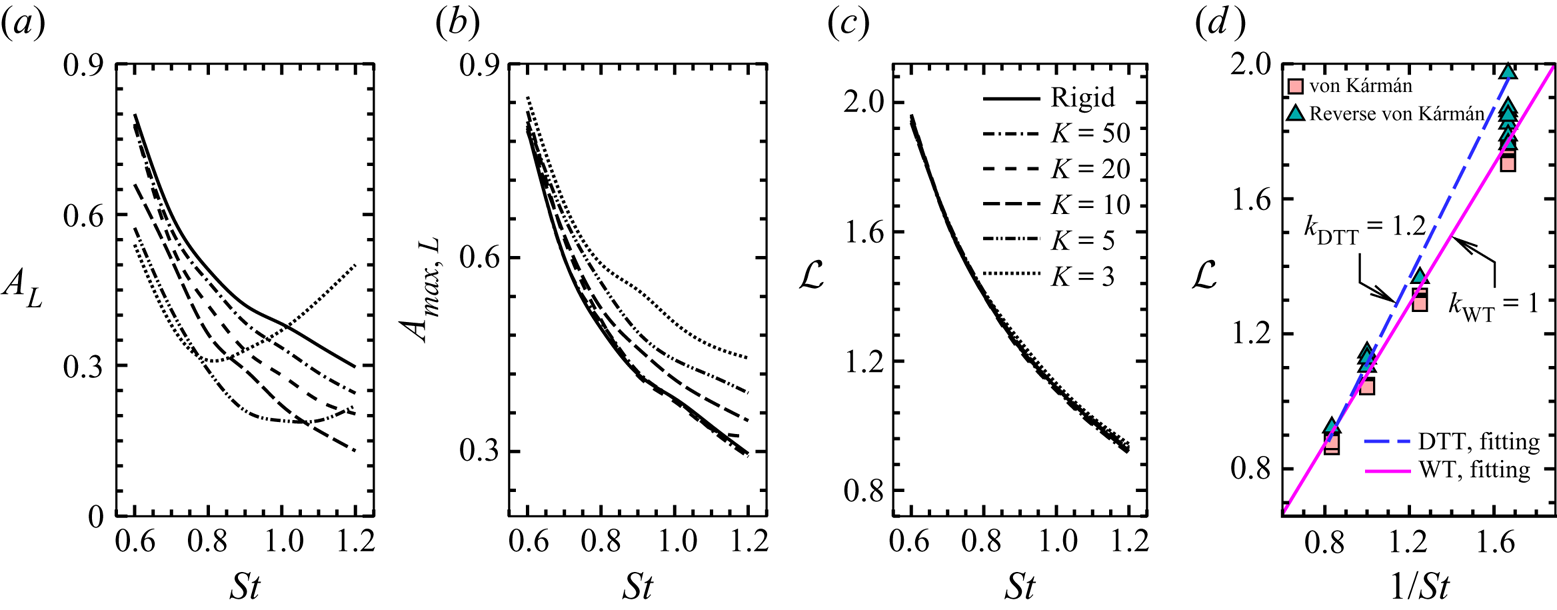
The best-fit curves for DTT in figure 3 are reproduced in figure 4(a). It is shown that for both rigid and flexible cases, the thrust can only be produced if the plate performs an oscillation with sufficiently high  $St$ and
 $A_L$. Moreover, it can be generally believed that the passive flexibility allows the plate to achieve the thrust with a smaller pitching amplitude or frequency; the optimal stiffness for the emergence of thrust is in the moderate range of 5–10. However, it should be noted that the excessive flexibility may inhibit the onset of thrust under the high pitching frequencies, e.g. the cases with
 $K=3$ and
 $St>1$ (see figure 4a). Moreover, figure 4(b) shows the boundaries for the DTT with various
 $K$ in the
 $St-A_{{max}, L}$ plane, where
 $A_{{max},L}=A_{{max}}/L$ is the
 $L$-normalized pick-to-pick trailing amplitude. As shown in figure 4(a,b), the curves in the
 $St-A_L$ and
 $St-A_{{max}, L}$ planes do not overlap each other, which indicates that DTT cannot be described merely by the combination of
 $St$ and
 $A_L$ (or
 $A_{{max}, L}$), i.e.
 $St_{A}$
 $=A_{L}\times St=2Af/U$ (or
 $St_{A_{max}}=A_{{max},L}\times St=A_{max}f/U$). Also, we note that the WT for the flexible pitching plates can not be characterized by the amplitude-based Strouhal numbers, e.g.
 $St_A$ or
 $St_{A_{max}}$ (not shown in figure 4). This conclusion is also consistent with those for rigid foils in literature. According to Andersen et al. (Reference Andersen, Bohr, Schnipper and Walther2017) and Lagopoulos et al. (Reference Lagopoulos, Weymouth and Ganapathisubramani2019),
 $St_A$ cannot be regarded as an expression of self-similarity for the drag-to-thrust wake transitions, which not only depends on the frequency and the trailing amplitude, but also depends sensitively on other details of the kinematics.
The best-fit curves for DTT with various  $K$ in the
 $St-A_L$ (a),
 $St-A_{{max}, L}$ (b),
 $St-\mathcal {L}$ (c) and
 $1/St-\mathcal {L}$ (d) phase planes. Here,
 $A_{{max},L}$ and
 $A_L$ (
 $=2A/L=2\sin \theta$) are the
 $L$-normalized pick-to-pick trailing amplitudes with and without considering the plate's passive deformation, respectively. The fitting line for the transitions between the von Kármán wakes and the reversed von Kármán wakes is also plotted in the
 $1/St-\mathcal {L}$ plane. The fit lines are described by
 $\mathcal {L}=k\times St^{-1}+b$, where
 $k=k_{WT}=1$,
 $b=0.046$ for the wake transition (WT), and
 $k=k_{DTT}=1.2$,
 $b=0.09$ for the DTT, respectively.

The dimensionless chord-averaged distance of travel per cycle,  $\mathcal {L}$, is introduced by Lagopoulos et al. (Reference Lagopoulos, Weymouth and Ganapathisubramani2019) to characterize the quantity of fluid displaced and scale the transition boundaries between the von Kármán and reversed von Kármán wakes in flapping rigid foils. In their study,
 $\mathcal {L}$ is defined as
 \begin{equation} \mathcal{L}={\frac{1}{L}}\int_0^1\int_0^{1/f}\sqrt{\dot{X}^2(s, t) + \dot{Y}^2(s, t)}\,{\rm d}t\,{\rm d}s, \end{equation}
where  $\dot {X}$ is the horizontal velocity of the plate relative to the oncoming flow. By definition, it is reasonably believed that
 $\mathcal {L}$ is directly related to the thrust of the plate, which is generated by displacing and accelerating fluid. Thus, the curves in figure 4(a) are redrawn in the
 $St-\mathcal {L}$ phase plane in figure 4(c), showing a remarkable collapse of all the curves corresponding to the DTT for various
 $K$. By fitting the overlapping curves in figure 4(c), the boundaries of DTT for various
 $K$ can be expressed as a unified formula, i.e.
 $\mathcal {L}=k_{DTT}\times St^{-1}+b$, where
 $k_{DTT}=1.2, b=0.046$ (see dashed line in figure 4d), which leads to
 $\mathcal {L}\times St \approx 1.2$. The fitting line for the transition boundaries between the von Kármán wakes and the reversed von Kármán wakes is also plotted in the
 $1/St-\mathcal {L}$ plane (see solid line in figure 4d). The fitting result for the wake transitions (WT) leads to
 $\mathcal {L}\times St \approx 1$. Combining the recent (Lagopoulos et al. Reference Lagopoulos, Weymouth and Ganapathisubramani2019) and current studies, we note that
 $\mathcal {L}\times St \to 1$, as a prognosticator of WT, is valid not only for rigid flapping foils but also for flexible scenarios. Further, as a result of
 $(\mathcal {L}\times St)_{DTT}>(\mathcal {L}\times St)_{WT}$, the WT occur earlier than the DTT, especially in the low
 $St$ region (figure 4d).
4.3. Resonances and the propulsive performances
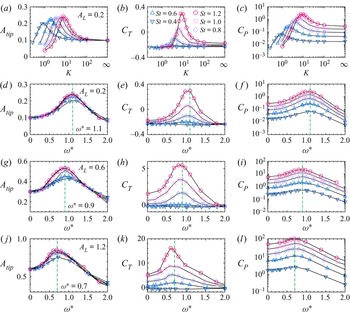
Figure 5(a–c) show  $A_{tip}$ (the maximum transverse displacement of the trailing edge),
 $C_T$, and
 $C_P$ vs
 $K$ for
 $A_{L}=0.2$ and various
 $St$, respectively. For each
 $St$, the peaks in performance parameters, e.g.
 $A_{tip}$,
 $C_T$ and
 $C_p$, are achieved at the same time at an optimal
 $K$ that increases with the increase of
 $St$. It is noted that the system is supposed to operate in resonance when
 $A_{tip}$ reaches a local maximum at the optimal
 $K$ (Alon Tzezana & Breuer Reference Alon Tzezana and Breuer2019). To analyse the resonance responses of the plate, the frequency ratio,
 $\omega ^*=2{\rm \pi} f/\omega _1^{fluid}$, is introduced. Here following the theory proposed by Van Eysden & Sader (Reference Van Eysden and Sader2006), the first natural frequency of the plate in a fluid is given as
 \begin{equation} \omega_1^{fluid} = \omega_1^{vac} \left[1+\frac{{\rm \pi} \epsilon}{4C_1 M}\times\varGamma_f(\epsilon) \right]^{{-}1/2}, \end{equation}
where  $\omega _1^{vac} = ({C_1^2U}/{L})(\sqrt {{K}/{M}})$ is the first natural frequency in vacuum,
 $C_1=1.875$ and
 $\varGamma _f(\epsilon )$ is hydrodynamic function (Van Eysden & Sader Reference Van Eysden and Sader2006). Thus the frequency ratio can be calculated as
 \begin{equation} \omega^*=\frac{2 {\rm \pi}St}{C_1^2}\sqrt{\frac{M}{K}}\left[1+\frac{{\rm \pi} \epsilon}{4 C_1 M}\times\varGamma_f(\epsilon) \right]^{1/2}. \end{equation}
The variations of  $A_{tip}$,
 $C_T$ and
 $C_p$ in figure 5(a–c) are reproduced in figure 5(d–f) as a function of
 $\omega ^*$. It is seen that the peaks in performance parameters for varying
 $St$ overlap at
 $\omega ^* \approx 1.1$, illustrating the optimal performance is achieved at the same time with the onset of structural resonance when pitching frequency
 $\omega$ is close to
 $\omega ^{fluid}$. However, it is worth noting that, as the increase of
 $A_L$ (see figure 5d,g,j), the value of
 $\omega ^*$ at the resonance gradually decreases and deviates from 1. This is because the theoretical formula, which is established under the assumption of small-amplitude vibrations, overestimates the actual value of
 $\omega _1^{fluid}$ for high
 $A_L$ cases. Specifically, as pitching amplitude increases, the added mass (
 $M_{add}$) would increase further, which results in the decrease of the actual
 $\omega _1^{fluid}$ for the plate due to
 $\omega _1^{fluid} \sim (M+M_{add})^{-1/2}$ (Alon Tzezana & Breuer Reference Alon Tzezana and Breuer2019). In other words, the overestimated value of
 $\omega _1^{fluid}$ by the theoretical formula above, in turn, leads to
 $\omega ^*$ at the resonance being much less than 1 for the high
 $A_L$ cases, e.g.
 $\omega ^*=0.7$ for
 $A_L=1.2$ (see figure 5j). The above results have confirmed the resonance mechanism that may improve the propulsive performance through properly adjusting the passive flexibility or flapping frequency of the plate, which is consistent with the previous studies (Kang et al. Reference Kang, Aono, Cesnik and Shyy2011; Alon Tzezana & Breuer Reference Alon Tzezana and Breuer2019). It is noted that several literature has reported that the propulsive performances may be maximized for the frequency ratios considerably lower than unity (Kang et al. Reference Kang, Aono, Cesnik and Shyy2011; Ramananarivo et al. Reference Ramananarivo, Godoy-Diana and Thiria2011), and this may be because that
 $\omega _1^{vac}$, instead of
 $\omega _1^{fluid}$, was used to scale flapping frequency, which leads to a much lower
 $\omega ^*$ at the resonance.
Dynamical performance of the pitching flexible plate in a flow: the maximum transverse displacement of the trailing edge,  $A_{tip}$ (a,d,g,j), the thrust coefficient,
 $C_T$ (b,e,h,k), and the power coefficient,
 $C_P$ (c, f,i,l), as a function of
 $K$ for
 $A_{L}=0.2$ (a–c), or as a function of
 $\omega ^*$ for
 $A_{L}=0.2$ (d–f), 0.6 (g–i), 1.2 (j–l), respectively.

4.4. Scaling laws for the propulsive performances
According to the definition of  $\mathcal {L}$ in § 4.2, we have
 \begin{equation} St\times \mathcal{L} =
\frac{fL}{U}\times \frac{\mathcal{U}\times T_f}{L}=\frac{\mathcal{U}}{U},
\end{equation}
where  $\mathcal {U}$ is time–space average speed of the plate. Thus, the product
 $St\times \mathcal {L}$ has a clear physical interpretation, that is, the dimensionless average speed of the plate, denoted as
 $\mathcal {U^*}$. Fundamentally, the plate generates the thrust by displacing and accelerating fluid out of its path. The quantity of fluid displaced and accelerated by the plate is dependent on the path length travelled by the plate over one period of oscillation, which is evaluated by
 $\mathcal {L}$ (Lagopoulos et al. Reference Lagopoulos, Weymouth and Ganapathisubramani2019). And then, the product
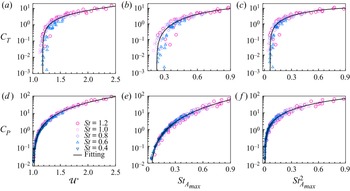
 $\mathcal {U^*}=St\times \mathcal {L}$ can be used to scale the cycle-averaged thrust. All the data of
 $C_T$ and
 $C_P$ in figure 5 are plotted again in figures 6(a) and 6(d), respectively, as functions of
 $\mathcal {U^*}$. As one can see, all the symbols, corresponding to the cases with varying bending stiffness (
 $K$) and kinematics parameters (
 $A_L$ and
 $St$), collapse together onto a single curve for
 $C_T$ and
 $C_P$, respectively.
The thrust (a–c) and power (d–f) coefficients as a function of  $\mathcal {U^*} (=St\cdot \mathcal {L}$) (a,d),
 $St_{A_{max}}$ (b,e) and
 $St_{A_{max}}^2$ (c, f).

Moreover, the previous experiments and theory agree that the thrust performance depends on the transverse velocity of tail motion for pitching and heaving foils, leading to  $St_{A_{max}}$-based metrics as typical arguments for describing the performance in aquatic swimming (Smits Reference Smits2019). As shown in figure 6(b,e), the thrust and power data collapse well onto a single curve, suggesting that
 $St_{A_{max}}$ can be used for scaling the
 $C_T$ and
 $C_P$ of the pitching plates. Further, by doing a simple scaling analysis (Dewey et al. Reference Dewey, Boschitsch, Moored, Stone and Smits2013; Quinn, Lauder & Smits Reference Quinn, Lauder and Smits2015), the thrust generated by a pitching motion depends on the square of transverse tail velocity, resulting in
 $C_T \sim St_{A_{max}}^2$. This scaling law is also in accord with the conclusions drawn from slender body theory (Lighthill Reference Lighthill1960; Akbarzadeh & Borazjani Reference Akbarzadeh and Borazjani2019; Smits Reference Smits2019). According to Akbarzadeh & Borazjani (Reference Akbarzadeh and Borazjani2019), the thrust generated by a backward travelling wave over a plate is scaled with
 $St_{A_{max}}^2(1-(U^2/C^2))$, where
 $C={f\lambda }$ is the wave speed and
 $\lambda$ is the wavelength. Our numerical results indicate that the pitching plates may approximately deform and move in the form of travelling waves with
 $C$ being much larger than
 $U$, which leads to
 $C_T\sim St_{A_{max}}^2(1-(U^2/C^2)) \approx St_{A_{max}}^2$. This conclusion also suggests that the thrust generation is dominated by the transverse velocity rather than the wave speed for the pitching plates considered in the present study. Plotting the thrust and power data as a function of
 $St_{A_{max}}^2$ yields figure 6(c, f). The scaling demonstrates remarkable collapses which is similar to the
 $\mathcal {U^*}$-based scaling. The results also show the spread in data within the low-thrust region is slightly less than that using
 $St_{A_{max}}$ (see figure 6b).
It is not surprising that the  $\mathcal {U^*}$-based and
 $St_{A_{max}}$-based scales demonstrate a similar goodness of fit for the performance data. Both metrics focus on characterising added mass effect, which dominates the mean thrust generated by the pitching motions, according to Floryan et al. (Reference Floryan, Van Buren, Rowley and Smits2017). We also note that the two arguments neglect the drag on the propulsor, thus the scaling laws based on them will be only held when the drag is small relative to the total thrust (Smits Reference Smits2019). Further, compared with the
 $St_{A_{max}}$-based metrics,
 $\mathcal {U^*}$ cannot be derived from a linearized theory although it has a clear physical interpretation mentioned above; meanwhile, it requires more information on the plate than
 $St_{A_{max}}$, which may cause measurement difficulty in applications. Whereas, due to including more details of the kinematics,
 $\mathcal {U}^*$ is able to serve as a universal scale to not only characterise the performance of propulsion, but also capture the DTT/WT, suggesting its fundamental role in revealing the dynamics of flapping-based propulsion. We also note that these scaling laws are applicable for various flows in a wide range of the parameters considered in the present study.
5. Concluding remarks
In summary, we carried out a numerical investigation on the dynamics of a pitching flexible plate in a uniform flow. The effects of  $K$,
 $A_L$ and
 $St$ on the wake patterns, thrust generations and propulsive performances of the fluid–plate system were analysed. We have identified four typical wake patterns emerging from various kinematics, i.e. von Kármán, reversed von Kármán, deflected and chaotic wakes. The phase diagrams for the four wake patterns in the
 $St-A_L$ plane were given for various
 $K$. The boundaries of WT and DTT were examined for both rigid and flexible plates. Results have indicated that the WT and DTT boundaries can be scaled by the dimensionless parameter,
 $\mathcal {L}$, which leads to
 $\mathcal {U^*} =\mathcal {L}\times St \approx 1$ and
 $\mathcal {U^*} \approx 1.2$, respectively. A lag between the WT and DTT was observed for the flexible plate, which is consistent with previous measurements and simulations for rigid cases. It was found that the peaks in
 $C_T$ and
 $C_P$ are achieved when
 $\omega$ is closed to
 $\omega _1^{fluid}$, at which the system operates in resonance. As the pitching amplitude increases,
 $\omega _1^{fluid}$ would decrease due to the enhancement of the added mass. Further, it was indicated that propulsive characteristics of this fluid–plate system could be merely described by one physical quantity,
 $\mathcal {U^*}$. For the first time, these simple scaling laws for
 $C_T$ and
 $C_P$ are revealed in both rigid and flexible pitching plates. We also note that these scaling laws are tenable for various flow patterns in a wide range of the parameters considered in our two-dimensional simulations. However, the universality of
 $\mathcal {U^*}$-based metric should be further evaluated in the more general situations where the more complex kinematics and three-dimensional shape effects should be considered. This is beyond the scope of the present paper but will be a focus of our future research.
Supplementary movies
Supplementary movies are available at https://doi.org/10.1017/jfm.2022.268.
Acknowledgements
The authors would like to thank Mr Y. Lu for valuable discussions on topics related to this work.
Funding
This work was supported by the Natural Science Foundation of China (grant number 11902120).
Declaration of interests
The authors report no conflict of interest.