Introduction
Clay-rich sedimentary formations are efficient barriers to solute migration and so are considered as suitable host rocks for geological disposal facilities for radioactive waste (Dohrmann et al., 2013). In this context, knowledge of the basic properties of clay-rich rocks, such as porosity and pore-size distribution, is of prime importance (Wigger et al., Reference Wigger, Gimmi, Muller and van Loon2018). Obviously, the mineral–water interaction within the nanometric pore network is also of interest, as well as transport properties (diffusion coefficient, permeability). Because such clay-rich formations are also studied in the context of CO2 storage, reactivity under acid conditions is of concern (Gaus et al., Reference Gaus, Azaroual and Czernichowski-Lauriol2005) as well as the possibility of intercalation of CO2 molecules in the interlayer (Bowers et al., Reference Bowers, Schaef, Loring, Hoyt, Burton, Walter and Kirkpatrick2017; Hemmen et al., Reference Hemmen, Rolseth, Fonseca, Hansen, Fossum and Plivelic2012). In the present study, the main focus was on the use of low-field NMR techniques to provide information on drillcore samples that were conditioned to minimize evaporation and disturbances in the pore structure. Over the past 20 years, the development of NMR relaxation methods in the laboratory together with logging tools has made such techniques more popular and widespread. The key information presented here, the pore-size distribution, was established by NMR cryoporometry, known for more than two decades but not used systematically in the geosciences. In contrast, high-field solid-state multinuclear NMR spectroscopic techniques have been used extensively in the past to characterize clay minerals at small scale (Sanz, Reference Sanz, Bergaya, Theng and Lagaly2006); from the information on chemical shift gathered using a variety of techniques, the location and coordination of many nuclei (Si, Al, Na…) can be obtained and modeled (Kirkpatrick et al., Reference Kirkpatrick, Kalinichev, Bowers, Yazaydin, Krishnan, Saharay and Morrow2015). For water, the surface orientation of adsorbed molecules and their mobility within the interlayer of some clays can also be described (Porion et al., Reference Porion, Faugère, Rollet, Dubois, Marry, Michot and Delville2018; Porion & Michot, Reference Porion and Michot2007). At low field, the mobility of water can be obtained at a much larger length scale (~micron) from relaxation-time distribution measurement and interpretation. For example, the precise quantification of interlayer water in smectite powders has been shown to be possible at various degrees of controlled humidity; also shown to be possible is that interlayer and inter-aggregate (or external) water exchange rapidly at the millisecond timescale typical of T 2 transverse relaxation times in such systems (Fleury et al., Reference Fleury, Kohler, Norrant, Gautier, M'Hamdi and Barré2013; Montavon et al., Reference Montavon, Guo, Tournassat, Grambow and Le Botlan2009). The basal spacing measured by small-angle X-ray scattering was related directly to the amount of water measured by NMR (Fleury et al., Reference Fleury, Kohler, Norrant, Gautier, M'Hamdi and Barré2013). By freezing Na-montmorillonite adequately at various temperatures, taking advantage of the freezing-point depression effect depending on the spacing of the interlayer, interlayer and external water could be separated (Montavon et al., Reference Montavon, Guo, Tournassat, Grambow and Le Botlan2009) and relaxation time distributions that are grossly unimodal could also be decomposed into 1, 2, 3, or 4 hydrated layers (Ohkubo et al., Reference Ohkubo, Ibaraki, Tachi and Iwadate2016). NMR techniques are widely expected to be able to elucidate the so-called ‘bound water,’ but from the NMR point of view, this concept has little meaning: diffusion of a water molecule between the solid surface and the interlayer is rapid on the NMR timescale, even if highly confined in pores of ~1 nm or less.
Moving from well controlled model systems such as powdered clay minerals to clay-rich samples collected from drilling operations is another challenge. Such samples are well known to be very sensitive to dehydration or water uptake (shrinkage or swelling) when exposed to surface conditions, and, therefore, proper techniques and protocols should be used in the laboratory. From this point of view, non-invasive techniques are highly recommended while maintaining the sample in the original wet state if possible. The characterization of samples from various geological formations around the world performed with different low-field NMR techniques is reported here. Because the pore sizes encountered in the present systems are at least 2 or 3 orders of magnitude smaller than in samples originating from permeable formations (such as sandstones or limestones), some basic aspects must be reconsidered. For the pore-size distributions, NMR cryoporometry techniques were used instead of relaxation-time distributions, which in the case of shales yield very little information on this critical aspect. However, T 2 relaxation is extremely important to quantify porosity, and T 1-T 2 maps are useful to describe qualitatively the interactions between water and the mineral surfaces, or between different pore environments.
The present study was embedded in the CLAYWAT project initiated by the Clay Club, a working group of the Nuclear Energy Agency (Paris, France) within the Organisation for Economic Co-operation and Development (OECD). The main focus of this project was the characterization of the binding state of porewater in the nanometric pore space of clays and shales using a range of methods (Mazurek et al., Reference Mazurek, Gimmi, Dohrmann, Emmerich, Fleury and Balcom2022). These include, among others, thermogravimetry (TGA), differential scanning calorimetry (DSC), and the identification and quantification of the evolved gases (EGA), as well as the acquisition of adsorption isotherms for various molecules (N2, CO2, H2O). All samples were subjected to a basic material characterization (mineralogical composition, cation-exchange properties, porosity). Here, only the NMR aspects with a link to N2 adsorption data are presented; other possible relationships will be considered in future work.
Experimental Methods
Because many geoscientists may not be familiar with magnetic resonance theory, the interpretation of low-field NMR relaxation data and the NMR cryoporometry technique are explained in some detail. The measurements of relaxation properties are not detailed here, however, and the reader is referred to textbooks (e.g. Dunn et al., Reference Dunn, Bergman and Latorraca2002). The instrument used in the present study was a permanent magnet relaxometer from Oxford Instruments (Abingdon, Oxfordshire, England) with a probe size of 18 mm and a proton Larmor frequency of 20.9 MHz, corresponding to a field strength of 0.5 Tesla.
Low-field NMR T 2 Relaxation
In NMR relaxation experiments, the magnetization decay characterized by exponential decay curves is measured, resulting essentially from liquid–solid interactions of the spins carried by water molecules exploring the pore space by diffusion (Godefroy et al., Reference Godefroy, Korb, Fleury and Bryant2001). The solid–liquid interactions are effective only close to the surface in a layer of thickness, εS (<1 nm). In a single pore, the volume fraction of bulk water (unaffected by surface interactions) is f b, and f s is the volume fraction of the surface layer (f b + f s = 1). As a result of molecular diffusion, an exchange occurs between the surface and bulk volumes with an exchange time given by τex. In the so-called fast exchange (or fast diffusion) regime (τex<< T 2, the latter being the relaxation time), the measured relaxation rate 1/T 2 is an average of the bulk and surface-relaxation rates weighted by the volume fractions:

An additional term involving internal gradients is ignored because low magnetic fields typically of the order of <0.5 T are considered; T 2S is the relaxation time characteristic of the surface layer, T 2B is the relaxation time of the bulk liquid (T 2S<<T 2B), and V p and S p are the volume and surface area of a pore, respectively. The intuitive explanation of the equation above that, as the pore size decreases, the number of collisions with the surface increases and, hence, the relaxation time decreases, is incorrect because the model assumes a fast diffusion regime, meaning that numerous collisions occur during the magnetization lifetime. An important parameter describing the strength of solid–liquid interactions is the surface relaxivity, ρ2, or relaxation velocity at the pore surface defined as ρ2 = εS /T 2S. The above equation is the basis for the interpretation of relaxation time as an indicator of pore size expressed as the ratio V p /S p. From this starting point, important amendments should be made:
• The ratio V p /S p can be quite confusing when compared to imaging techniques that aim at pore body sizes or mercury intrusion experiments (yielding pore entry sizes); e.g. for a rhombohedric packing of spherical grains of diameter d yielding the lowest possible porosity (0.259), the largest sphere in the pore body, the pore-entry size, and the ratio V p /S p, will be 0.224 d, 0.154 d, and 0.054 d, respectively. Hence, the scaled NMR pore size will always be smaller compared to these techniques; if considering rugosity at a small scale, typically below the resolution of imaging techniques, the difference will be even larger.
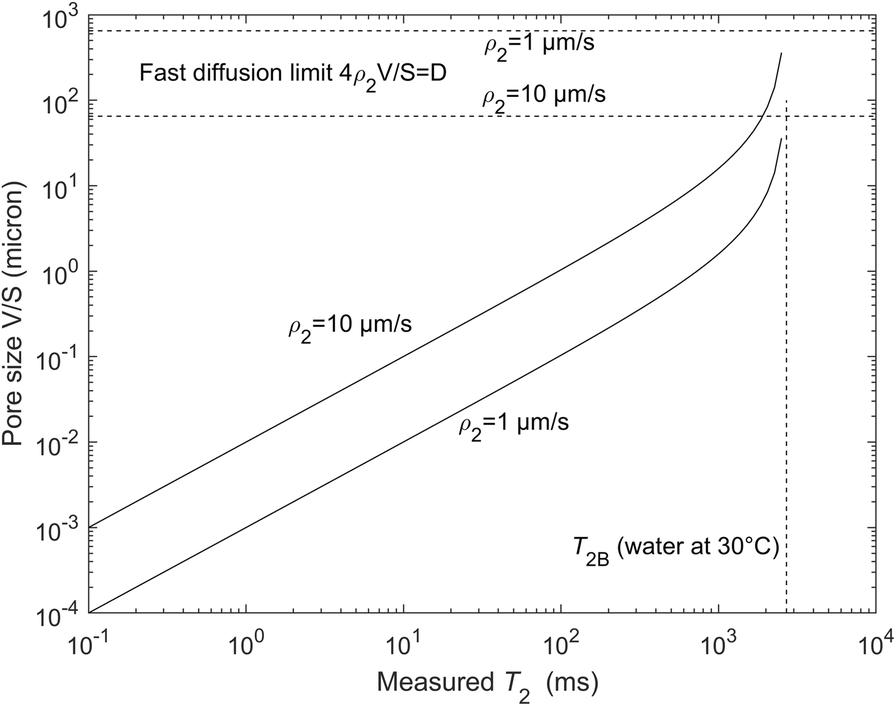
• The solid–liquid interactions are dominated by paramagnetic impurities (Fe or Mn) at the solid surfaces and the water molecules can be viewed as a probe exploring the surface by diffusion; hence, the surface S p in Eq. 1 should rather be compared to values obtained by techniques describing the surface at the same molecular scale, e.g. nitrogen adsorption. Surface relaxivity values are often calculated by comparison with the mercury intrusion method but they are overestimated by at least the ratio of pore body to pore throat (a factor of ~3). The current authors consider that the range of surface relaxivities for most natural minerals is between 1 and 10 μm/s, much larger values being non-physical (Washburn, Reference Washburn2014); hence, a large range of sizes can be observed, from nanometer up to 100 μm (Fig. 1), with an instrument able to detect T 2 relaxation times starting at 0.1 ms.
• In the interlayer space of smectites, the V/S model above has been shown to fail (Fleury et al., Reference Fleury, Kohler, Norrant, Gautier, M'Hamdi and Barré2013), presumably due to the fact that the notion of surface and volume becomes ambiguous at <2 nm; another potential reason is the strong interaction of water with the compensating ions (“oriented” water (Fleury & Canet, Reference Fleury and Canet2014)); in calibrated porous silica, the pore-size dependence of the relaxation times has been shown to be valid in the range 2 to 14 nm (Liu et al., Reference Liu, Li and Jonas1991) and above (Godefroy et al., Reference Godefroy, Korb, Fleury and Bryant2001).
• In the presence of a distribution of pore sizes, the magnetization decay, M(t), is not a single exponential but the sum of the contribution from all pores. M(t) is then usually analyzed in terms of a sum of exponential decays. This does not mean, however, that the resulting distribution of relaxation times will represent a pore-size distribution; molecules may diffuse into several pores during the magnetization decay yielding the so-called diffusion coupling effect (Fleury & Soualem, Reference Fleury and Soualem2009; Monteilhet et al., Reference Monteilhet, Korb, Mitchell and McDonald2006; Washburn & Callaghan, Reference Washburn and Callaghan2006). It leads to a narrower distribution or, in extreme cases, a unique exponential decay even in the presence of pores of different sizes. This effect is a combination of diffusion length, pore sizes, and spatial distribution of these pores. For aquitards or caprocks and shales, diffusive pore coupling is thought to be predominant (Washburn, Reference Washburn2014) and, therefore, relaxation-time distribution must be interpreted carefully. An important consequence of the diffusive coupling for clay systems is that the smallest pores (typically interlayer) are accessible by most NMR instruments and not only by those with the highest T 2 resolution; indeed, the average relaxation time becomes larger and can be reached more easily, yielding realistic porosity values including interlayer water (often called total porosity). On the other hand, the effect of diffusive coupling also means that while the binding environments of water in the interlayer and in the bulk pore space are different, they cannot be resolved because diffusive exchange is fast in relation to the timescales accessible by NMR. What can be measured is a weighted average of the relaxation times in these environments.
Graphical representation of Eq. 1 with two extreme values of surface relaxivities. For completeness, the fast diffusion limit is also indicated

The water content or porosity can be obtained from the magnetization curve in the native state. It is the very first and important parameter characterizing porous media. In clay-rich samples, determination of porosity is not a trivial operation when using simple drying techniques. At the standard drying temperature of 105°C, some of the more strongly bound water may stay in the sample, and higher drying temperatures may result in the volatilization of organics. The NMR techniques have a great advantage because the sample can stay in a fully saturated state, even though some difficulties remain.
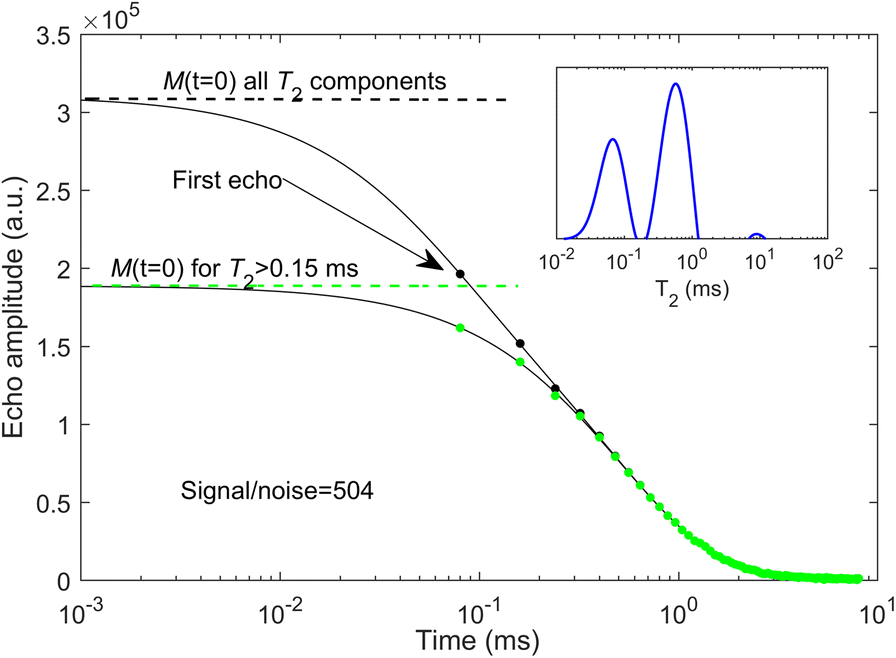
Here, some details are given on how to determine the water content from the magnetization measurements (Fig. 2). The M(t) curve is a collection of echoes collected at regular time intervals, and for the instrument used here, the first one is at 0.08 ms. As a practical rule of thumb, the first echo time also determines the T 2 resolution in the distributions shown later (e.g. for a component at T 2=0.08 ms, the first echo at M(t=0.08 ms) will already be attenuated by exp(–t=0.08/T 2=0.08)=exp(–1)=0.37). When short components are present below the limit of resolution, the calculated distribution will contain components around the resolution limit; hence, one can detect such components but not quantify their fractions. The water content is given by M(t=0) and the inverse Laplace transform yielding the relaxation time distributions was used to extrapolate the signal (full line in Fig. 2); if short T 2 components exist, the extrapolated value M(t=0) is much larger than the first echo and may be uncertain; e.g. in Fig. 2 in which two components are present mainly at 0.07 and 0.6 ms (see inset in Fig. 2), the extrapolated value taking all components is ~50% larger than the first echo amplitude. Using T 1-T 2 maps, the short components clearly correspond to protons being part of the solid structure and not belonging to water molecules. For these protons, the exponential model used to generate the T 2 distributions is probably not valid and should be replaced by a Gaussian model (Washburn et al., Reference Washburn, Anderssen, Vogt, Seymour, Birdwell, Kirkland and Codd2015). The present authors thus removed systematically all T 2 components of <0.15 ms and the corresponding extrapolated value M(t=0) is then much closer to the first echo amplitude, yielding minor uncertainties. Note that the signal to noise ratio is high (in this case S/N=504) and the relative error in water content is, at most, 1%.
Determination of the water content from NMR magnetization measurements (sample CW6, Opalinus Clay from Schlattingen). The solid line represents the inverse Laplace transform in the time domain and the circles represent the acquired data. The time axis is plotted using logarithmic scales to highlight the short time decay. The inset indicates the calculated T 2 distribution using the recorded magnetization curve M(t)

After calibrating the echo amplitudes with a known volume or mass of pure water measured under the same conditions, the water content is obtained. The result may still depend on the salinity of the saturating brine in the sample, however, because the hydrogen index of brine decreases gradually as the salinity increases (Dunn et al., Reference Dunn, Bergman and Latorraca2002). This is very significant for the Canadian samples for which total dissolved salts can reach up to 300 g/L. For these samples, the native porewater was exchanged by simple immersion with a 20 g/L KCl solution; this solution was chosen in order to minimize any potential clay swelling.
Finally, to obtain porosities, two possibilities exist: first, a direct calculation of volume ratio according to:

where the volume of water is measured by NMR as explained above, and the total volume is obtained by the dimension of the sample when its geometry is well defined (e.g. a cylinder). In this case, the result characterizes the water-filled pore space, which may be less than total porosity in the case of partially saturated conditions. The second possibility is to use the grain density, ρG, measured after drying the sample at 105°C; from the total mass, M t , of the sample and the measured mass of water, M w , by NMR, the porosity can be estimated according to:

This equation does not depend on the state of saturation and so represents the entire pore space.
T 1-T 2 and T 2-T 2 Maps
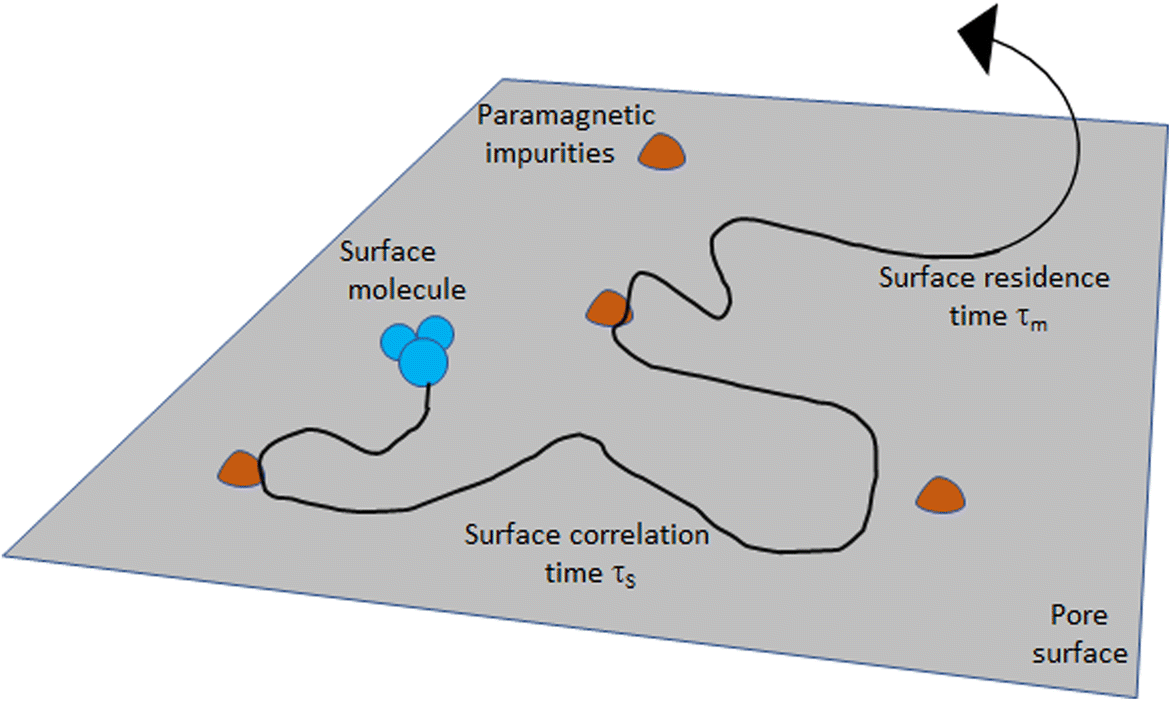
The T 1-T 2 maps are classically used for identifying different proton species essentially by their T 1/T 2 ratio; e.g. water, oil, gas, and organic matter in shales have distinct positions in such maps (Fleury & Romero-Sarmiento, Reference Fleury and Romero-Sarmiento2016; Khatibi et al., Reference Khatibi, Ostadhassan, Xie, Gentzis, Bubach, Gan and Carvajal-Ortiz2019), providing a considerable improvement in the understanding compared to T 2 relaxation distributions alone. When saturated with a single fluid as considered in the present study, the value of the T 1/T 2 ratio is also of interest as an indication of the strength of the confined water interactions with the solid surface. This ratio depends on the magnetic field of the instrument (i.e. the Larmor frequency), however, and the basic principles of the analysis need to be explained. As mentioned above, solid–liquid interactions are characterized macroscopically by a global surface relaxivity parameter but a more detailed description of these interactions involves essentially a surface diffusion mechanism: water molecules are adsorbed onto the surface and may diffuse in a thin water layer, εS, such that short-distance spin interactions can occur. In the present situation, only the dominant interactions between the nuclear spins and the electronic spins of paramagnetic impurities distributed at the solid surface are considered. The motions are then described by two timescales (Fig. 3): τm is the correlation time of the dipole–dipole interactions at the surface, and τS is the surface residence time before desorption (Godefroy et al., Reference Godefroy, Korb, Fleury and Bryant2001). The relaxation times T 1 and T 2 can then be calculated and the ratio is given by (Godefroy et al., Reference Godefroy, Korb, Fleury and Bryant2001; Korb, Reference Korb2018; Tian et al., Reference Tian, Wei and Yan2019):
Model of the two-dimensional translational diffusion of the proton species at the pore surface. The spin-bearing molecules (e.g. water) diffuse at the surface, sometimes reaching fixed surface paramagnetic impurities where the spins relax. The translational surface correlation time is defined as τm. This surface motion is interrupted by the surface desorption, characterized by a surface residence time, τS (adapted from Godefroy et al. (Reference Godefroy, Korb, Fleury and Bryant2001)


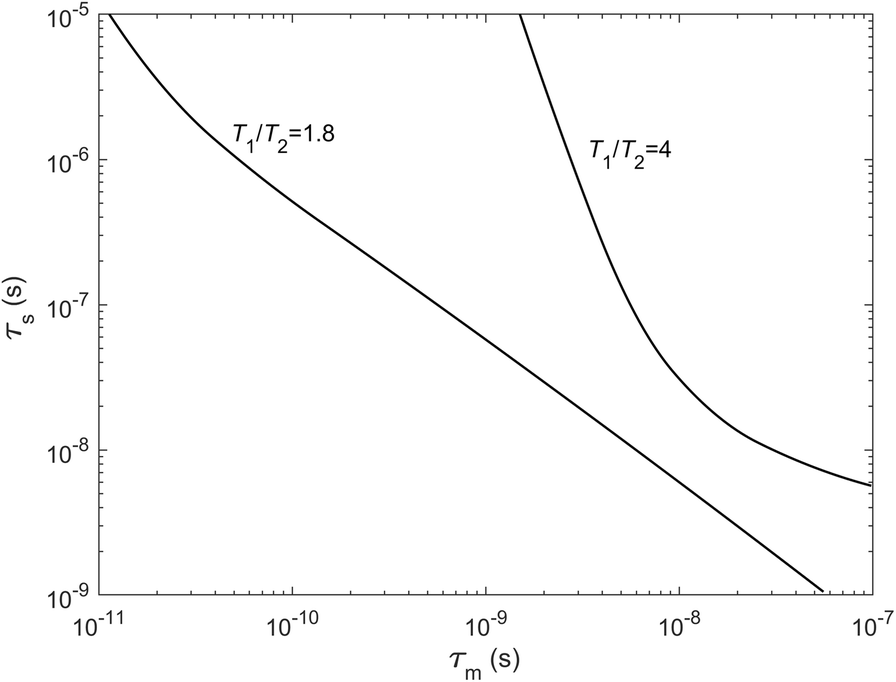
Whereas T 1 or T 2 contain pre-factors that are difficult to determine, the ratio T 1/T 2 depends solely on the two timescales and the Larmor frequency, ω I , of the instrument (ω S = 658.21 ω I in Eq. 4 is the electronic spin frequency related to the nuclear spin frequency). Taking typical ranges of values for τm and τS and the frequency of the instrument used (20.9 MHz), the T 1/T 2 ratio is sensitive to both τm and τS for moderate values (e.g. T 1/T 2 = 1.8) and mostly sensitive to τm at high values (e.g. T 1/T 2 = 4, Fig. 4). The meaning of τm can be understood better if τm is converted into a surface-diffusion coefficient, D S = ε S 2/4τm. Note that the T 1/T 2 ratio is equal to 1 when τS = τm as for bulk water (τm ≅10 ps). Some authors also interpret the T 1/T 2 ratio as being linked to a surface energy (D'Agostino et al., Reference D'Agostino, Mitchell, Mantle and Gladden2014). Using measurements performed at variable frequencies ω I (with field cycling instruments (Korb, Reference Korb2018)), the time scales τm and τS could be retrieved using various procedures (Faux et al., Reference Faux, Kogon, Bortolotti and McDonald2019). As will be seen in the results, however, relaxation times are too short for such instruments due to dead-time issues and one is limited by measurements at a spot frequency with reduced capability of more detailed analysis. The T 1/T 2 ratio will be used as a relative comparison between samples with the point above in mind.
Solutions of Eq. 2 for two values of the T 1/T 2 ratio at 20.9 MHz; τm is the correlation time of the dipole–dipole interactions at the surface governed by paramagnetic impurities and τS is the surface residence time before desorption (see Fig. 3). A variation of the T 1/T 2 ratio from 1.8 to 4 implies large variations of τm and τS

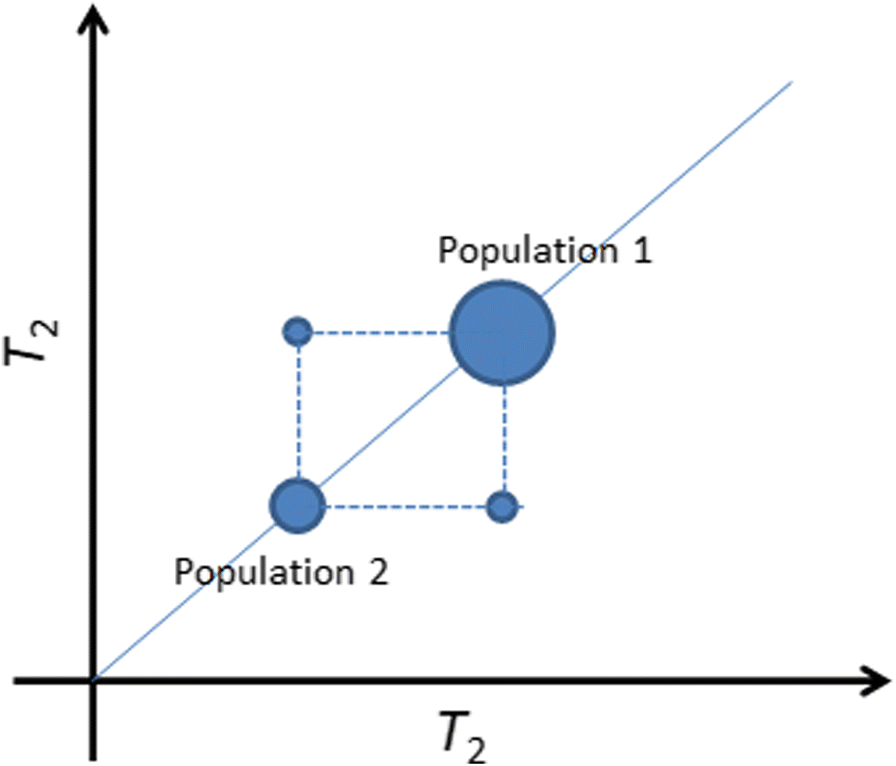
T 2–T 2 maps are very useful for demonstrating diffusive pore coupling as mentioned above (Bernin & Topgaard, Reference Bernin and Topgaard2013; Fleury & Soualem, Reference Fleury and Soualem2009; Monteilhet et al., Reference Monteilhet, Korb, Mitchell and McDonald2006; Washburn & Callaghan, Reference Washburn and Callaghan2006). This technique, also called relaxation exchange spectroscopy (REXSY), is a combination of two 1D T 2 relaxation experiments separated by an exchange time t E that can be varied experimentally. When spin-bearing molecules move by diffusion from one relaxation environment to another during the time t E, off-diagonal peaks are present in the map at well defined locations (Fig. 5). The exchange times that can be explored are limited by the lifetime of magnetization (about the largest T 2 relaxation time of the system) and molecular exchange will finally occur at long time. To test if an exchange is occurring in a given system characterized by at least two distinct relaxation times, the exchange time, t E, should be set close to the largest T 2 (population 1 in Fig. 5 (Fleury & Soualem, Reference Fleury and Soualem2009)). If exchange is present during that time interval, it means first that the 1D T 2 relaxation time distribution does not represent the true fraction of population 1 or 2. Second, it also means that the porous system is well connected at the time scale explored; when analyzing the different collected maps at different times, t E, a coupling coefficient expressing the degree of connectivity of the system can be calculated (Fleury & Soualem, Reference Fleury and Soualem2009). If the system is completely coupled (i.e. a single peak is observed either in 1D or 2D because diffusive exchange is fast), nothing can be observed and another fluid with a smaller diffusion coefficient must be used. The measured T 2 time will then represent the ratio of total volume to the total surface (as in Eq. 1) and may be an alternative way for estimating a specific surface in the wet state. The pore-coupling effect should not be viewed as a pore-to-pore exchange but rather as a pore-cluster exchange as small pores are never isolated in practice in natural samples. Hence, the distance between these clusters of pores with different sizes may also play a role and the availability of pore-network images is very useful for further interpreting the data.
T 2–T 2 maps showing off-diagonal peaks at an exchange time, t E, indicating diffusive exchange between the two populations

NMR Cryoporometry Technique (NMRC)
The principle of cryoporometry is based on the shift of the melting temperature of a fluid when located in a pore (Mitchell et al., Reference Mitchell, Webber and Strange2008; Petrov & Furó, Reference Petrov and Furó2009). A simplified form of the Gibbs-Thomson equation describing this behavior may be written as:

where T m bulk is the bulk melting temperature, x is a dimension related to the pore size, and kGT is the so-called Gibbs-Thomson constant. In the melting cycle, x corresponds to a radius of curvature dV/dS (Petrov & Furó, Reference Petrov and Furó2009). In this way the melting temperature depends on the nature of the liquid and on pore size. For water at a given temperature below zero, smaller pores will contain liquid instead of ice. For water, the value kGT = 58.2 K nm (Webber, Reference Webber2010; Webber et al., Reference Webber, Corbett, Semple, Ogbonnaya, Teel, Masiello, Fisher, Valenza, Song and Hu2013) determined using a set of well characterized systems has been chosen; hence at x = 2 and 10 nm, water will melt, respectively, at –29.1 and –5.8°C. As expressed in Eq. 5, the constant kGT contains a shape factor of 2 corresponding to a cylinder. Hence, if the porous system considered contains cylindrical pores, the measured pore size corresponds to a diameter d. In the following the notation, P(d) will be used for clarity.
In practice, if one detects the amount of liquid volume, V(T), present in the sample as a function of temperature, T, one can obtain the pore-size distribution, P(d), from the derivative of the V(T) curve using the following equation:

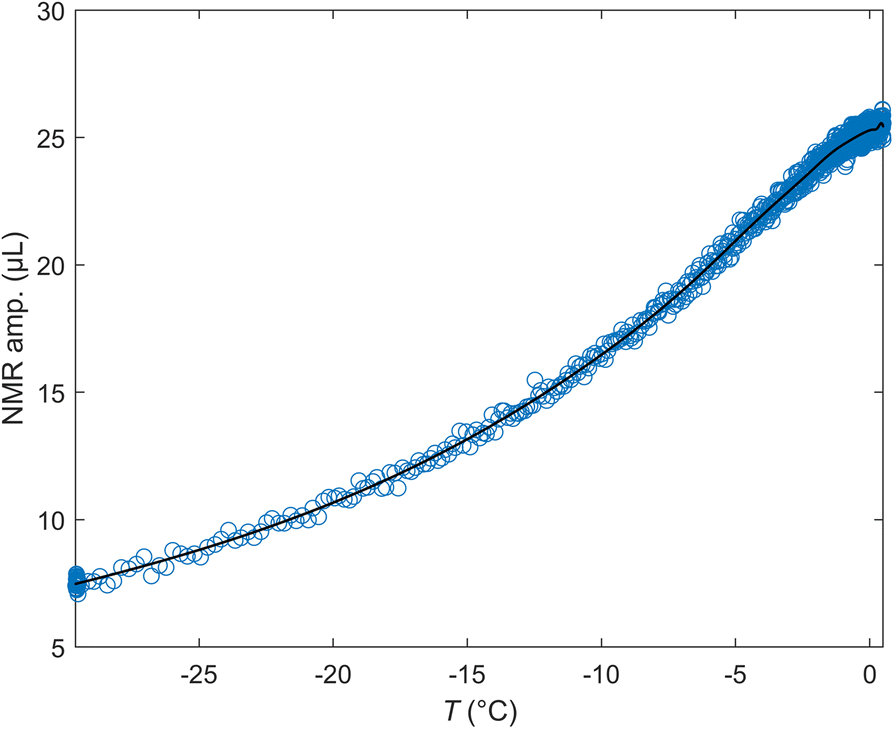
In equation 6, P(d) has units of μL/nm. Because the distributions are plotted using log scales, however, an appropriate representation is P(d).d vs. ln(d), yielding units of μL. The distribution is then further normalized by the initial (wet) mass of the sample, yielding units of μL/g in the graphs. The integration of the distribution P represents the amount of melted volume V m during the heating of the sample. The cryoporometry system used here is essentially a special probe part of the low-field spectrometer. Small cylinders, 4 mm in diameter, and of maximum length 20 mm, are needed to perform the measurements. After inserting the sample into the spectrometer, the temperature is first reduced to –29°C as rapidly as possible (<1 min). Then, a temperature cycle –29 ➔ –0.5 ➔ –29°C during ~30 min is performed to avoid residual hysteresis issues in the melting cycle. Finally, a temperature ramp starting at –29°C gradually reaching 0°C and above over a ~10 h period was performed and the amount of liquid was measured at regular intervals by NMR (Fig. 6). More details about the system used to vary the temperature and measure the liquid volume can be found elsewhere (Fleury et al., Reference Fleury, Chevalier, Jorand, Jolivet and Nicot2021). The experimental set-up allows the pore sizes from 2 nm up to ~1 μm to be resolved. The system is also checked regularly using a mixture of calibrated porous glass containing two narrow pore sizes (15 and 139 nm) (Fleury et al., Reference Fleury, Chevalier, Jorand, Jolivet and Nicot2021). A typical signal recorded during NMRC experiments is shown in Fig. 6; the NMR amplitude is the maximum of the recorded Hahn echo at the echo time TE = 0.3 ms. The curve is then fitted with a MATLAB least squares spline approximation function in order to obtain a smooth derivative of V(T) (Eq. 6). The duration of the experiment was 15 h. The cryoporometry technique described here has been applied recently to source rocks originating from the Vaca Muerta formation in Argentina (Fleury et al., Reference Fleury, Chevalier, Jorand, Jolivet and Nicot2021), both at 100% water and at partial oil–water saturation to demonstrate the pore occupancy of each fluid within the porous network.
Example of raw data recorded during NMRC experiments on the sample CW5 (Opalinus Clay). The line is a least square spline approximation used to calculate a smooth derivative dV/dT of the curve and produce the pore-size distribution according to Eq. 6

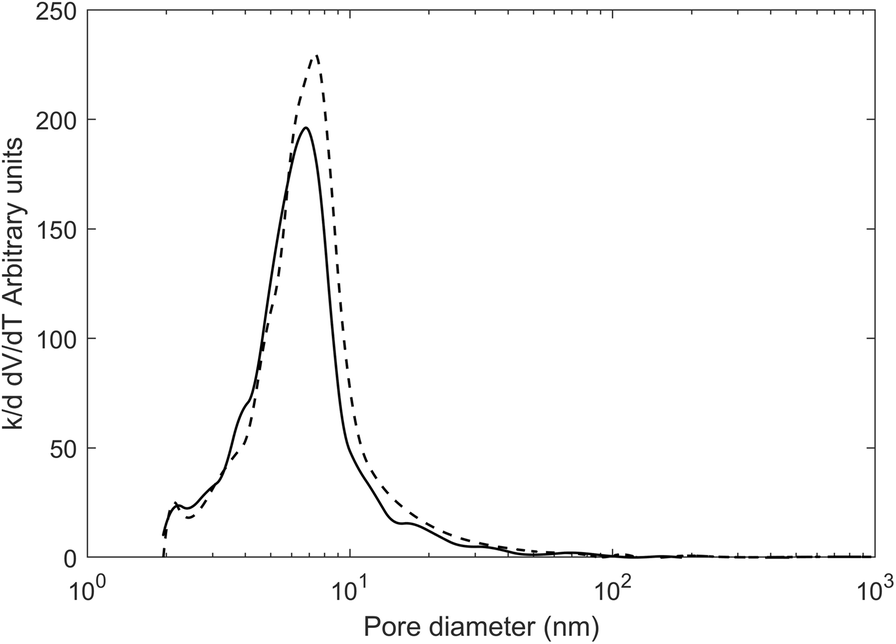
An important aspect is the effect of salt on pore-size distribution (PSD) derived from NMRC experiments; an aspect not considered much in the literature and not mentioned in two recent reviews (Mitchell et al., Reference Mitchell, Webber and Strange2008; Petrov & Furó, Reference Petrov and Furó2009). In clay systems, using pure water as the saturating liquid is not always feasible for well known clay stability issues (swelling). The theory described above has been developed in the context of pure fluids with well defined thermodynamic properties. A salt solution might not give any useful results; not only is the bulk freezing point shifted to a lower temperature (and for an extreme example, shifted to –21.1°C at the eutectic concentration for NaCl solutions) but, at the same time, liquid and solid phases co-exist, in principle, at a single temperature. Beside these unfavorable bulk thermodynamic properties, the salt exclusion mechanism might also produce uninterpretable experiments. The latter can be avoided easily by freezing the system rapidly and this is done effectively in the experiments. In the NMRC context, the effect of salt has been examined only a little. In the pharmaceutical field, for the purpose of testing polymeric nanoparticles for drug release, the PSD measured on porous silica either saturated with pure water or a solution representing the cerebrospinal fluid (ionic strength of 0.15 mol/L) indicated small differences (Gopinathan et al., Reference Gopinathan, Yang, Lowe, Edler and Rigby2014). In the field of differential scanning calorimetry in which the same Gibbs-Thomson principle is used, more data can be found (Burba & Janzen, Reference Burba and Janzen2015) but only in one single published paper. The shift of the melting-point temperature was determined for two nano-porous silica samples (MCM41 and SBA15) and various NaCl solutions (up to 0.25 mol/kg). The result was a further reduction of the melting temperature compared to pure water, and different for the two porous media, even if the effect is significant in terms of melting temperature (~1°C). No large shift was induced in the PSD at ~10 nm, however. Later (Jantsch et al., Reference Jantsch, Weinberger, Tiemann and Koop2019), the same effects were still found for nano-porous silica but with CaCl2 and LiCl solutions. A fundamental explanation was given in terms of effective water activity. In summary, the presence of salt solution does not preclude the use of thermoporometry methods but induces a small additional shift of melting temperature. For the present study, the effect of KCl solutions on a meso-porous zeolite sample compared with pure water was also specifically tested (Fig. 7). In the presence of KCL, a small shift of the PSD curve to smaller values, consistent with the literature, was observed. A KCl solution was chosen because it should generate the least swelling of clay materials in general.
Comparison of the PSD obtained from a zeolite sample with pure water (dashed line) and a potassium chloride solution of concentration 20 g/L (solid line)

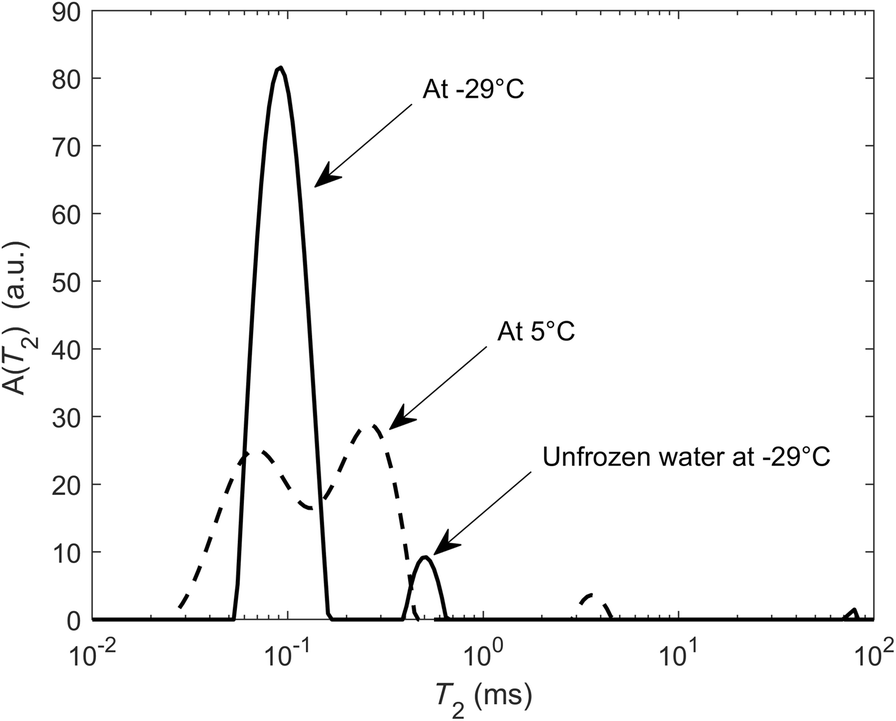
To complement the information given by the pore-size distribution derived between 2 nm and 1 μm, the amount of unfrozen water at –29°C was measured, the lowest attainable temperature in our system, yielding, in principle, the amount of water at <2 nm. This method is very similar to the thermoporometry method proposed to determine the amount of interlayer water typically from smectite (Grekov et al., Reference Grekov, Montavon, Robinet and Grambow2019). For this purpose, all components above 0.15 ms were taken in the T 2 spectra (Fig. 8). The components below 0.15 ms were associated with structural hydroxyls and to plastic ice (frozen water in larger pores). This is only approximate, however, because the T 2 relaxation time of water in the interlayer that is not in exchange with the surrounding water might be smaller than 0.15 ms; e.g. in smectite powders at various relative humidities and compensating cations, T 2 values ranged from 0.03 to 0.5 ms when the basal spacing varied from 1.0 up to 1.6 nm (Fleury et al., Reference Fleury, Kohler, Norrant, Gautier, M'Hamdi and Barré2013). T 1 measurements of the interlayer water in purified bentonite (Ohkubo et al., Reference Ohkubo, Ibaraki, Tachi and Iwadate2016) indicated similar but slightly larger values (1 to 3.5 ms) considering a T 1/T 2 ratio of 2 to 4.
Determination of the fluid volume in pores of <2 nm taking all components above 0.15 ms

Sample Materials
General Description
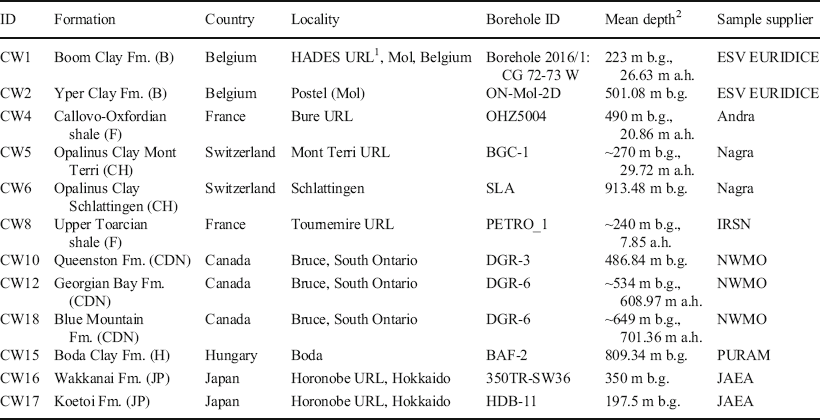
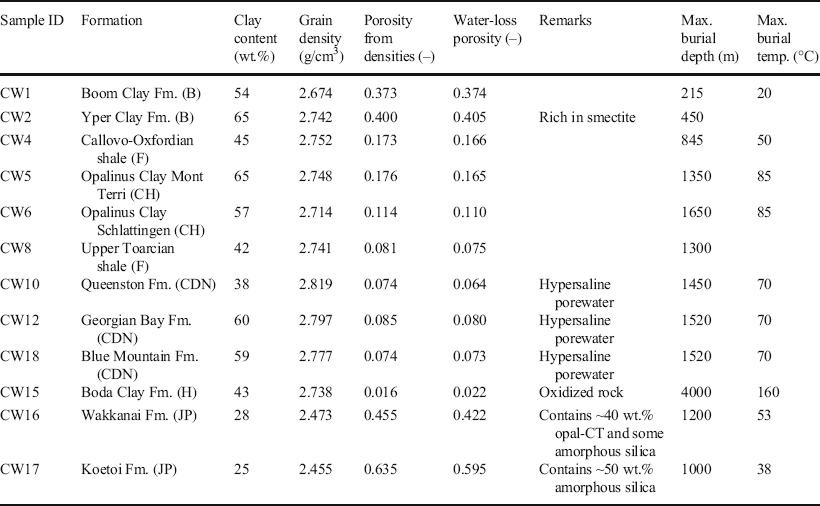
A suite of 12 drillcore samples selected for the CLAYWAT project of the Nuclear Energy Agency (Mazurek et al., Reference Mazurek, Gimmi, Dohrmann, Emmerich, Fleury and Balcom2022) was used for the study. The samples originated from diverse geological environments and were obtained from deep boreholes drilled from the surface or from short drillings in underground research facilities over a depth range of ~200–900 m below ground (Table 1). All samples were conditioned in sealed plastic bags immediately after core retrieval in order to minimize porewater evaporation and oxidation. The formations from which the samples originated span a wide range of depositional environments (mostly shallow marine to deltaic) and burial histories (Table 2). The maximum burial depths were, in most cases, larger than the current depth location, resulting in variable degrees of over-consolidation. The extremes were, on the one hand, the Belgian units (Boom Clay and Yper Clay) that experienced only shallow burial and, therefore, have high porosities of 0.37–0.4 and, on the other hand, the Boda Clay Fm. that was buried to ~4000 m in the past, resulting in a porosity of ~0.02. The Japanese units (Wakkanai and Koetoi Fm.) were special in that they are rich in marine diatoms and contain substantial components of volcanic material. While their clay contents are relatively small, they contain opal-CT and amorphous silica and have the greatest porosities of all of the samples. The salinity of the porewaters in the formations studied was below that of seawater, except for the Canadian samples (Queenston, Georgian Bay, and Blue Mountain Fm.) that contain hypersaline Ca-Na-Cl waters.
Provenance of sample materials

1URL = Underground Rock Laboratory, 2b.g. = below ground, a.h. = along hole (the latter stated for inclined boreholes drilled from the surface or short boreholes drilled from underground rock laboratories)
Main characteristics of studied samples from the CLAYWAT report (Mazurek et al., Reference Mazurek, Gimmi, Dohrmann, Emmerich, Fleury and Balcom2022). Burial depth and temperature data from Kennell-Morrison et al. (Reference Kennell-Morrison, Yang and Jensen2022)

Sample Preparation
The objective was to prepare sample cylinders of 15 mm diameter and ~20 mm long for NMR studies. The geometry of these cylinders should be as regular as possible. For cryoporometry, smaller cylinders with a diameter of 4 mm were needed. The desired total length was 20 mm. Cryoporometry does not require ideal cylindrical geometry, and fragmented cylinders were acceptable also.
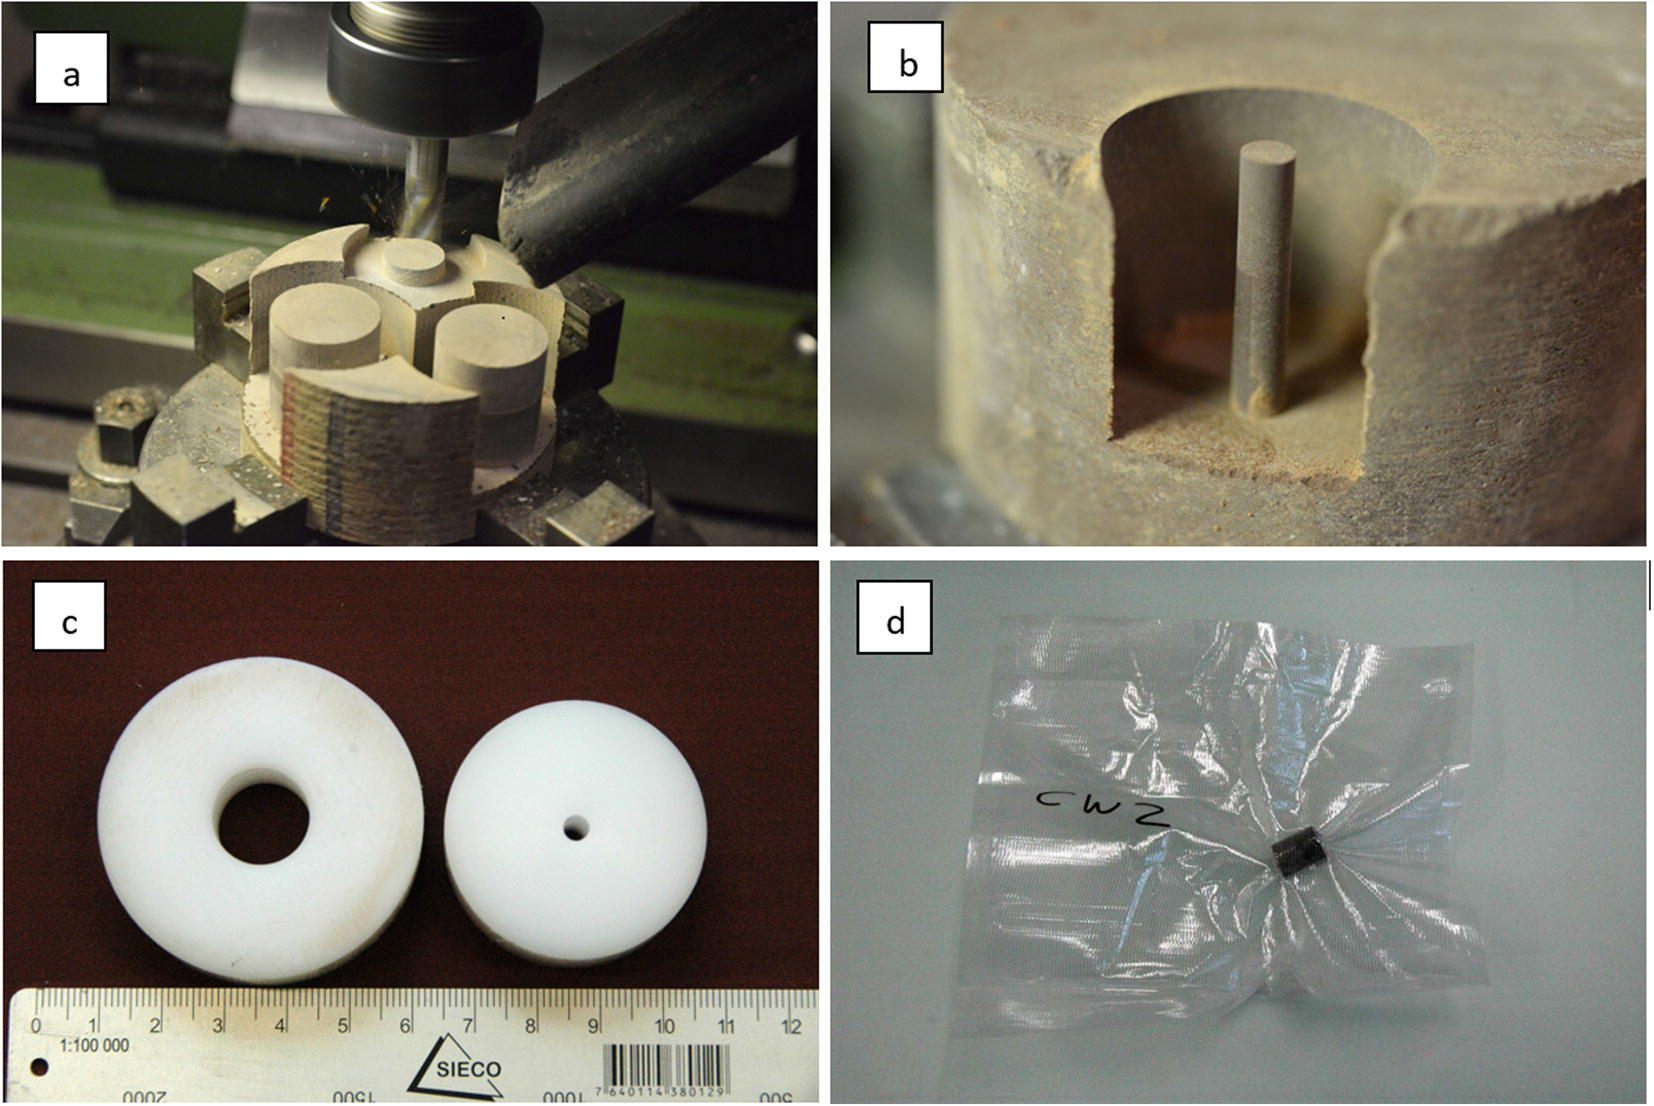
Full-size cores were unpacked from the protective wrapping, and 4–5 cm thick core slices were dry cut on a rotary saw. These slices were then fixed on a molding cutter, and cylinders of the desired size (15 and 4 mm) were milled (Fig. 9a, b). The cylinders were then either dry-cut or broken off the rock sample. The length of the cylinders was between 15 and 20 mm. The planar surfaces of the large cylinders were straightened on abrasive paper, using a plastic ring to maintain orthogonality (Fig. 9c). The 4 mm cylinders were not straightened due to the fragility of the thin materials. Both types of cylinders were then heat-sealed in transparent plastic tubes (Fig. 9d). The total exposure time of the samples to the atmosphere was ~30 min, which means that some degree of evaporation may have occurred. The plastic-packed 4 mm and 15 mm cylinders were subsequently heat-sealed in a second layer consisting of Al-coated plastic.
Preparation of cylindrical cores for NMR studies. a Milling of cylindrical samples, b cylinder of 4 mm diameter for cryoporometry studies, c plastic rings into which the milled cylinders were inserted in order to straighten the end surfaces on abrasive paper, and d wrapping of sample cylinders prior to shipping

Given the fact that milling does not transmit major forces on the sample cylinders (unlike sawing or machining), it was possible to prepare unbroken and geometrically regular cylinders of 15 mm diameter from all samples. In many cases, the 4 mm cylinders broke into 2–4 pieces during preparation, but this was of no concern for the cryoporometry studies.
Results
Porosity
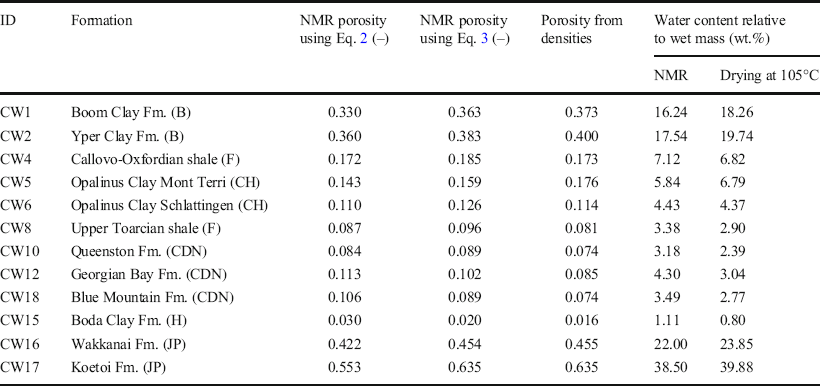
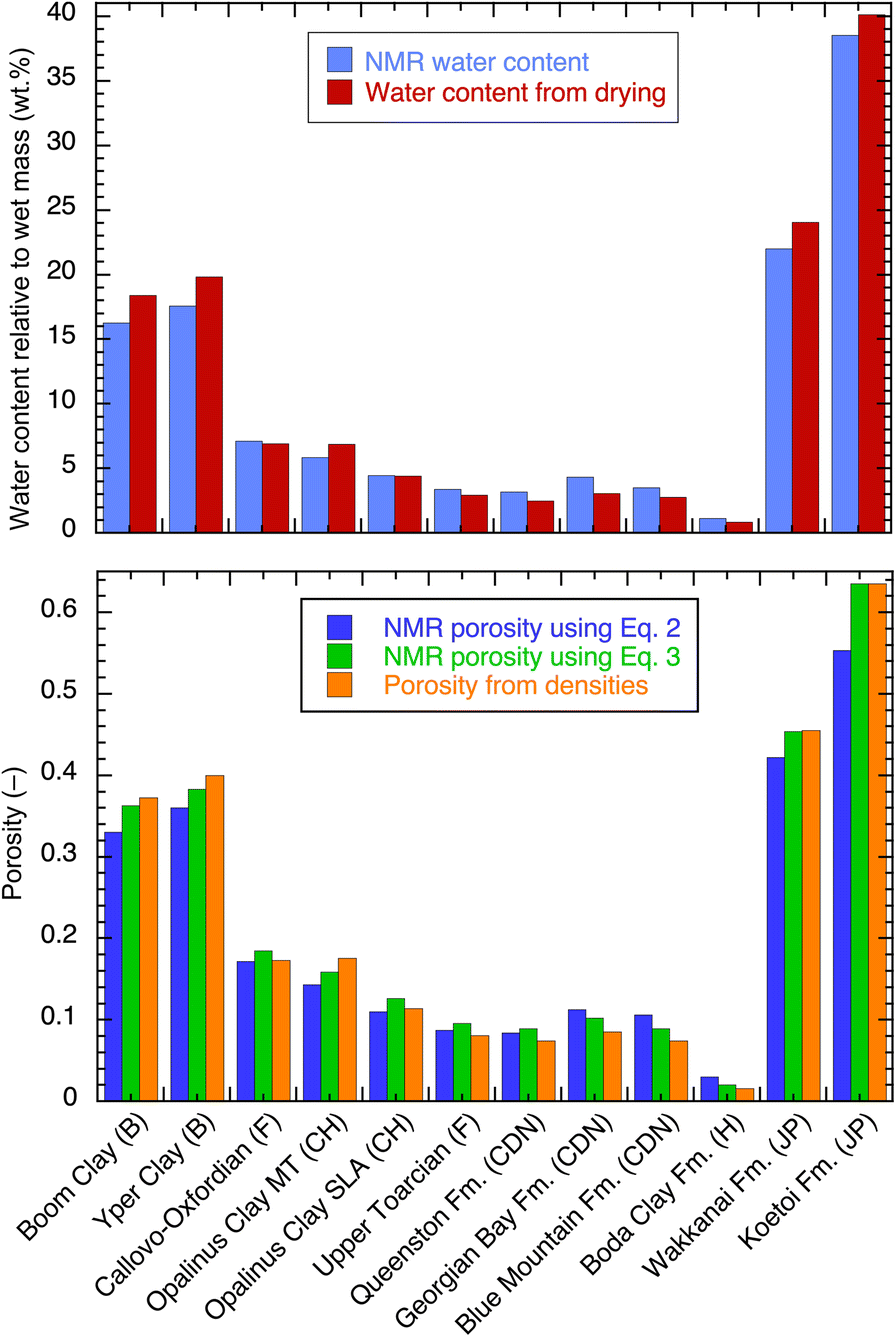
Water content and porosity measured by NMR on cylindrical samples (diameter = 15 mm) as received without any resaturation (except for the Canadian samples) are listed in Table 3 and shown in Fig. 10. The data are compared to values obtained from the drying technique performed on adjacent materials. Two values of porosity were calculated according to Eqs 2 and 3. The total volume for the porosity calculation was obtained from the measurements of the diameter and length of the cylinders; these cylinders were sometimes imperfect, e.g. end faces may not have been strictly perpendicular to the longitudinal axis, yielding in general slightly overestimated geometrical volumes and, therefore, slightly underestimated porosities. Hence, the comparison in terms of gravimetric water content was considered to be more precise than the comparison in terms of porosity, because the former did not include geometrical volume uncertainties. For the Canadian samples, the water content and porosity values were obtained after exchanging the native porewater with a 20 g/L KCl solution; compared to the initial porosity value measured by NMR at high salinities (not indicated in Table 3), increases from 13 to 28% were observed. For all other samples, salinity was not an issue. After KCl exchange, no swelling was observed visually.
Porosity and water content from NMR and from drying at 105°C (Mazurek et al., Reference Mazurek, Gimmi, Dohrmann, Emmerich, Fleury and Balcom2022). The NMR porosity was calculated excluding T 2 < 0.15 ms (see text). For the Canadian samples, porosities are given after KCl exchange

Water content and porosity from NMR, compared with data from drying techniques and density measurements on adjacent materials

The NMR porosity values were mostly very close to those obtained from the drying technique at 105°C, differing by a few percent (larger or smaller) only. When porosities obtained from the NMR and grain densities were considered (Eq. 3), the differences were even smaller. This also applied to the comparison of the water contents. As the uncertainty on the water-content measurement was very small, these small differences were attributed to sample variability and/or sample handling. The milling technique used to prepare small samples from large cores was considered to be very efficient at preserving the water content; most of the samples were indeed at a saturation of >90%. This comparison also confirmed that the removal of short T 2 components as explained above was meaningful. Larger differences were observed for the Canadian samples. The special case of the Boda Clay sample is discussed further in the Relaxation-time Distribution section below.
Pore-size Distribution by Cryoporometry
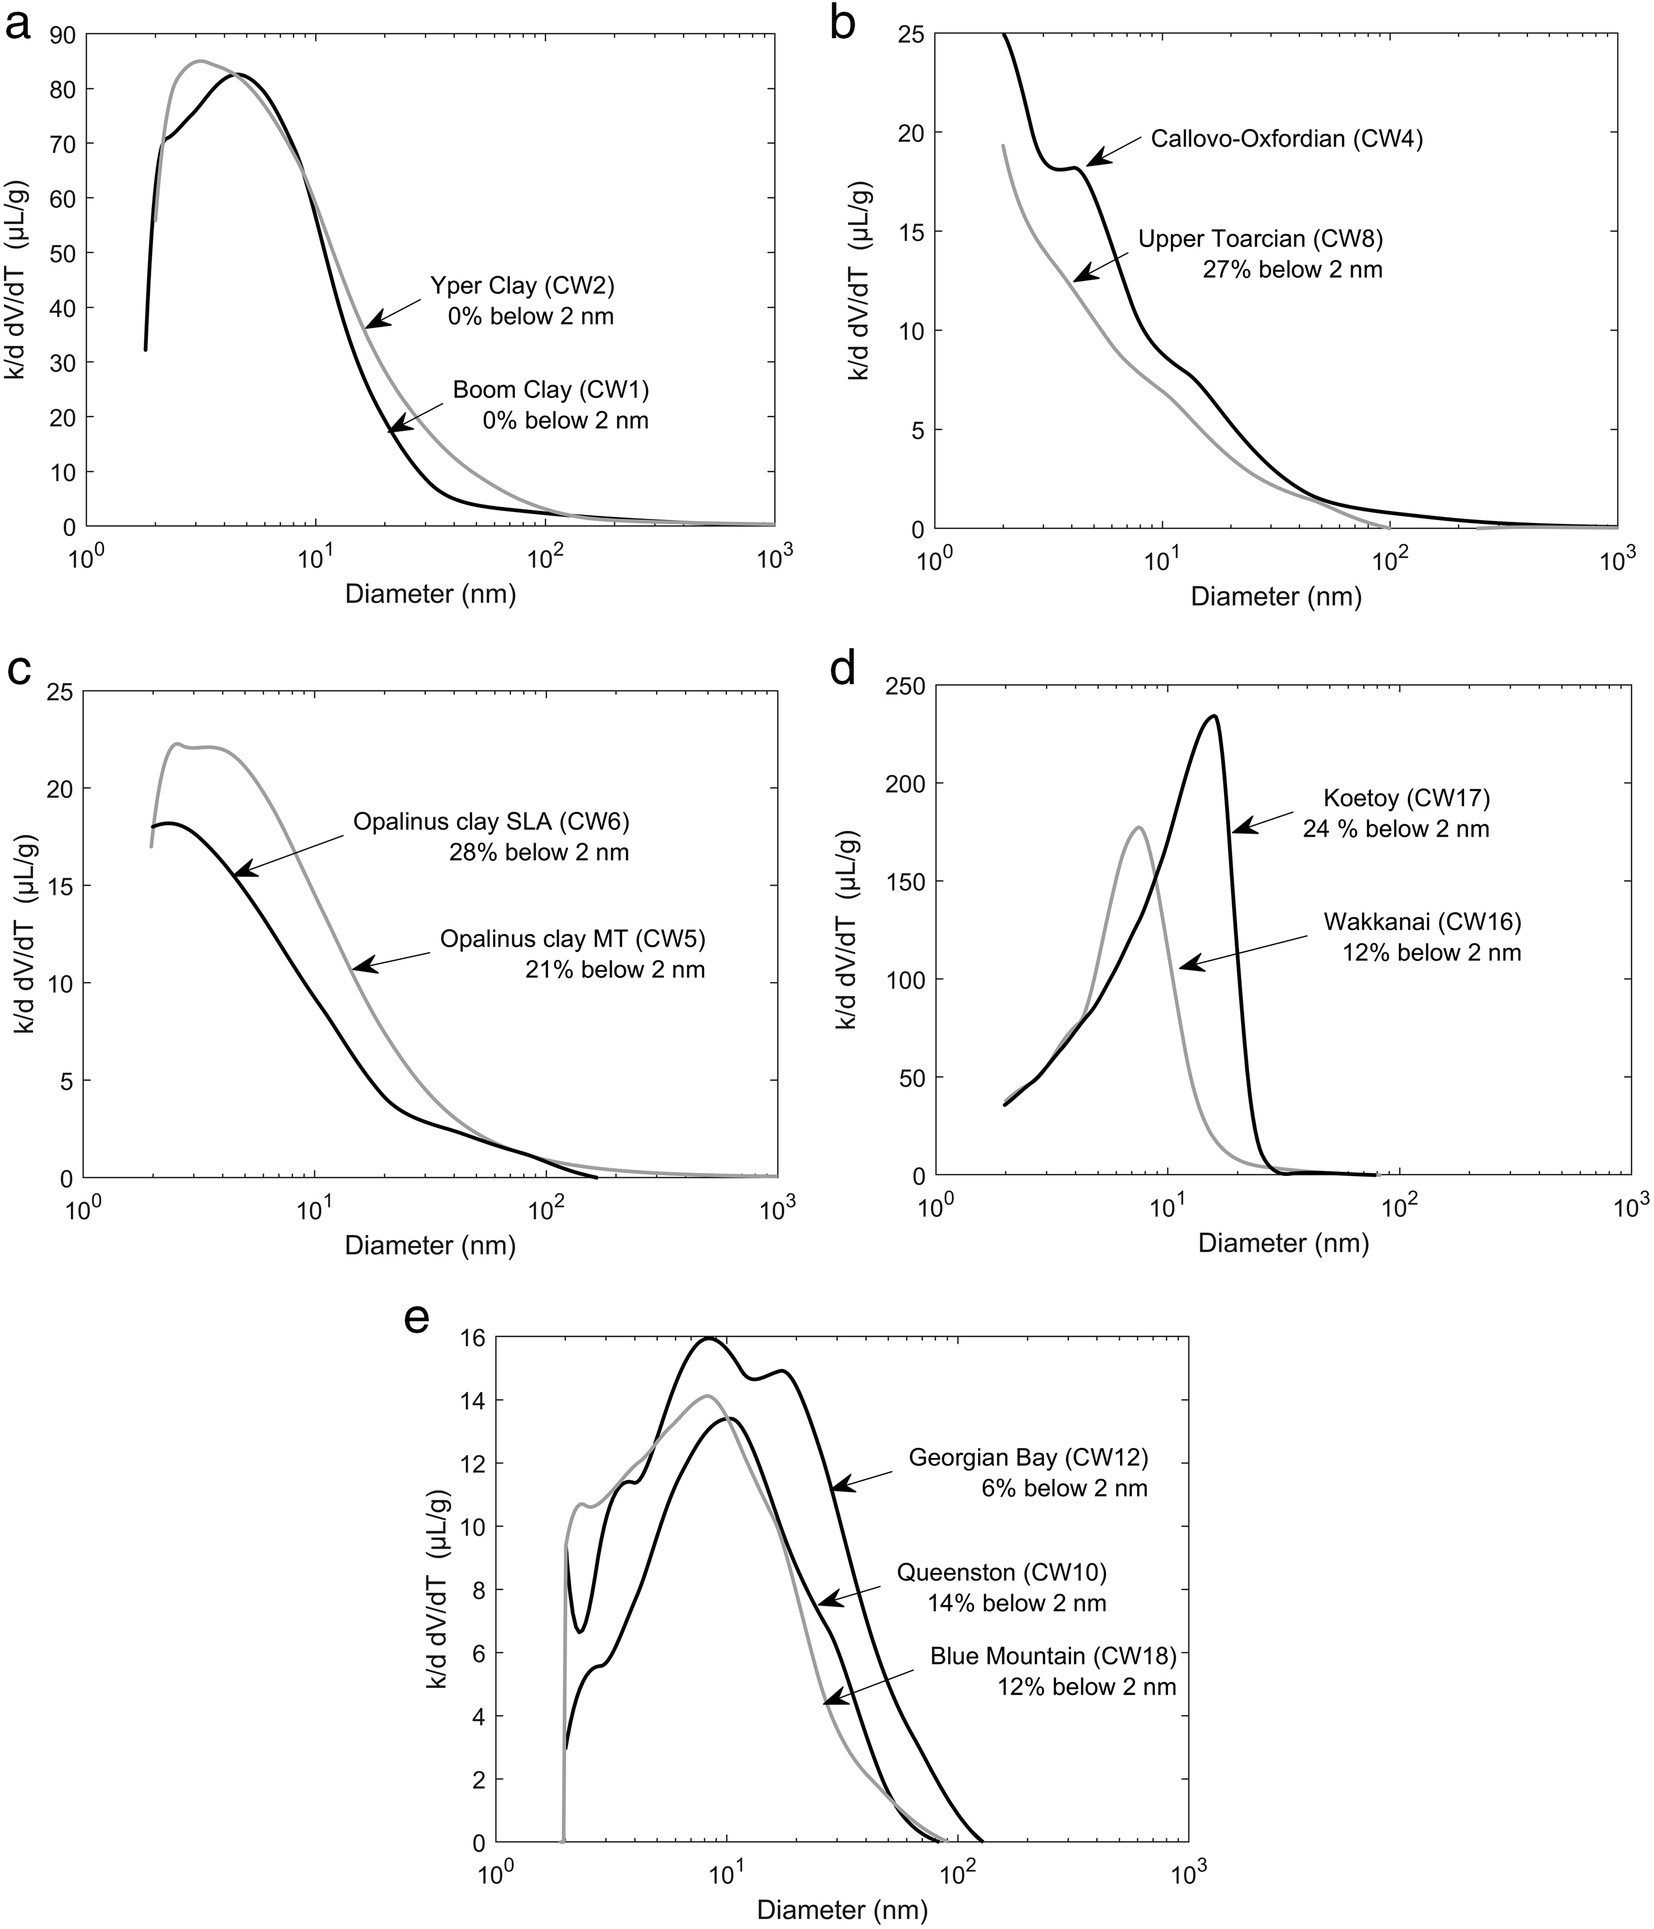
Results are listed in Table 4 and are shown graphically in Fig. 11, grouped by country without any specific geological argument. The lowest resolution is 2 nm linked to the lowest attainable temperature of –29°C. However, the amount of water not frozen at that temperature allowed a determination of the volume at <2 nm; this was indicated in each distribution (Fig. 11, Table 4) as a percentage of the total volume. With the methodological limitations detailed in the section on the NMR cryoporometry technique, these percentages might be slightly underestimated. As already mentioned, the brine in place was exchanged with a 20 g/L KCl solution to make the measurement possible for the Canadian samples (CW10, CW12, and CW18). For all other samples, the native porewater was used without any attempt to re-saturate the sample. For the Boda Clay sample (CW15) with a very low porosity (3% or less), the sensitivity of the device used was insufficient, and the melting curve was dominated by noise with no opportunity to derive a distribution.
Pore-size distributions from NMR cryoporometry. All samples contained the original porewater except for the Canadian samples (CW10, CW12, and CW18). When available, the amount of water from pores of <2 nm was also indicated as a fraction of the total pore volume

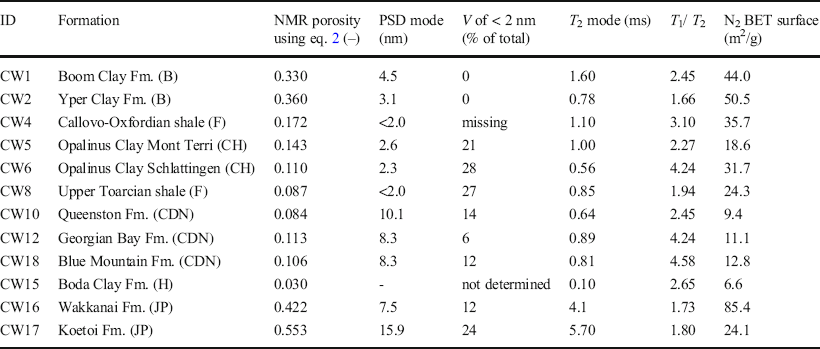
Main features of the pore size and T 2 distributions. The unfrozen water volume (V) at –29°C corresponds to pore sizes of <2 nm. For the Boda Clay CW15, the pore-size distribution could not be determined. T 1 /T 2 ratios for the Canadian samples CW10, CW12, and CW18 refer to measurements after exchange with a 20 g/L KCl solution. The N2 BET surface area was taken from the CLAYWAT report (Mazurek et al., 2021)

For all samples, no pore sizes >100 nm were observed and the most frequent pore sizes were <20 nm. The width of the distributions usually exceeded one order of magnitude, in contrast with the T 2 distributions presented below, except for the Japanese samples CW16 and CW17. The mode of the distribution was sometimes close to or at the resolution limit of 2 nm (French and Swiss samples CW4, CW8, CW5, CW6, Fig. 11) with the highest fraction at <2 nm (21–28%). These distributions are analyzed further in the Discussion section to deduce a pore-shape factor.
Relaxation-time Distribution
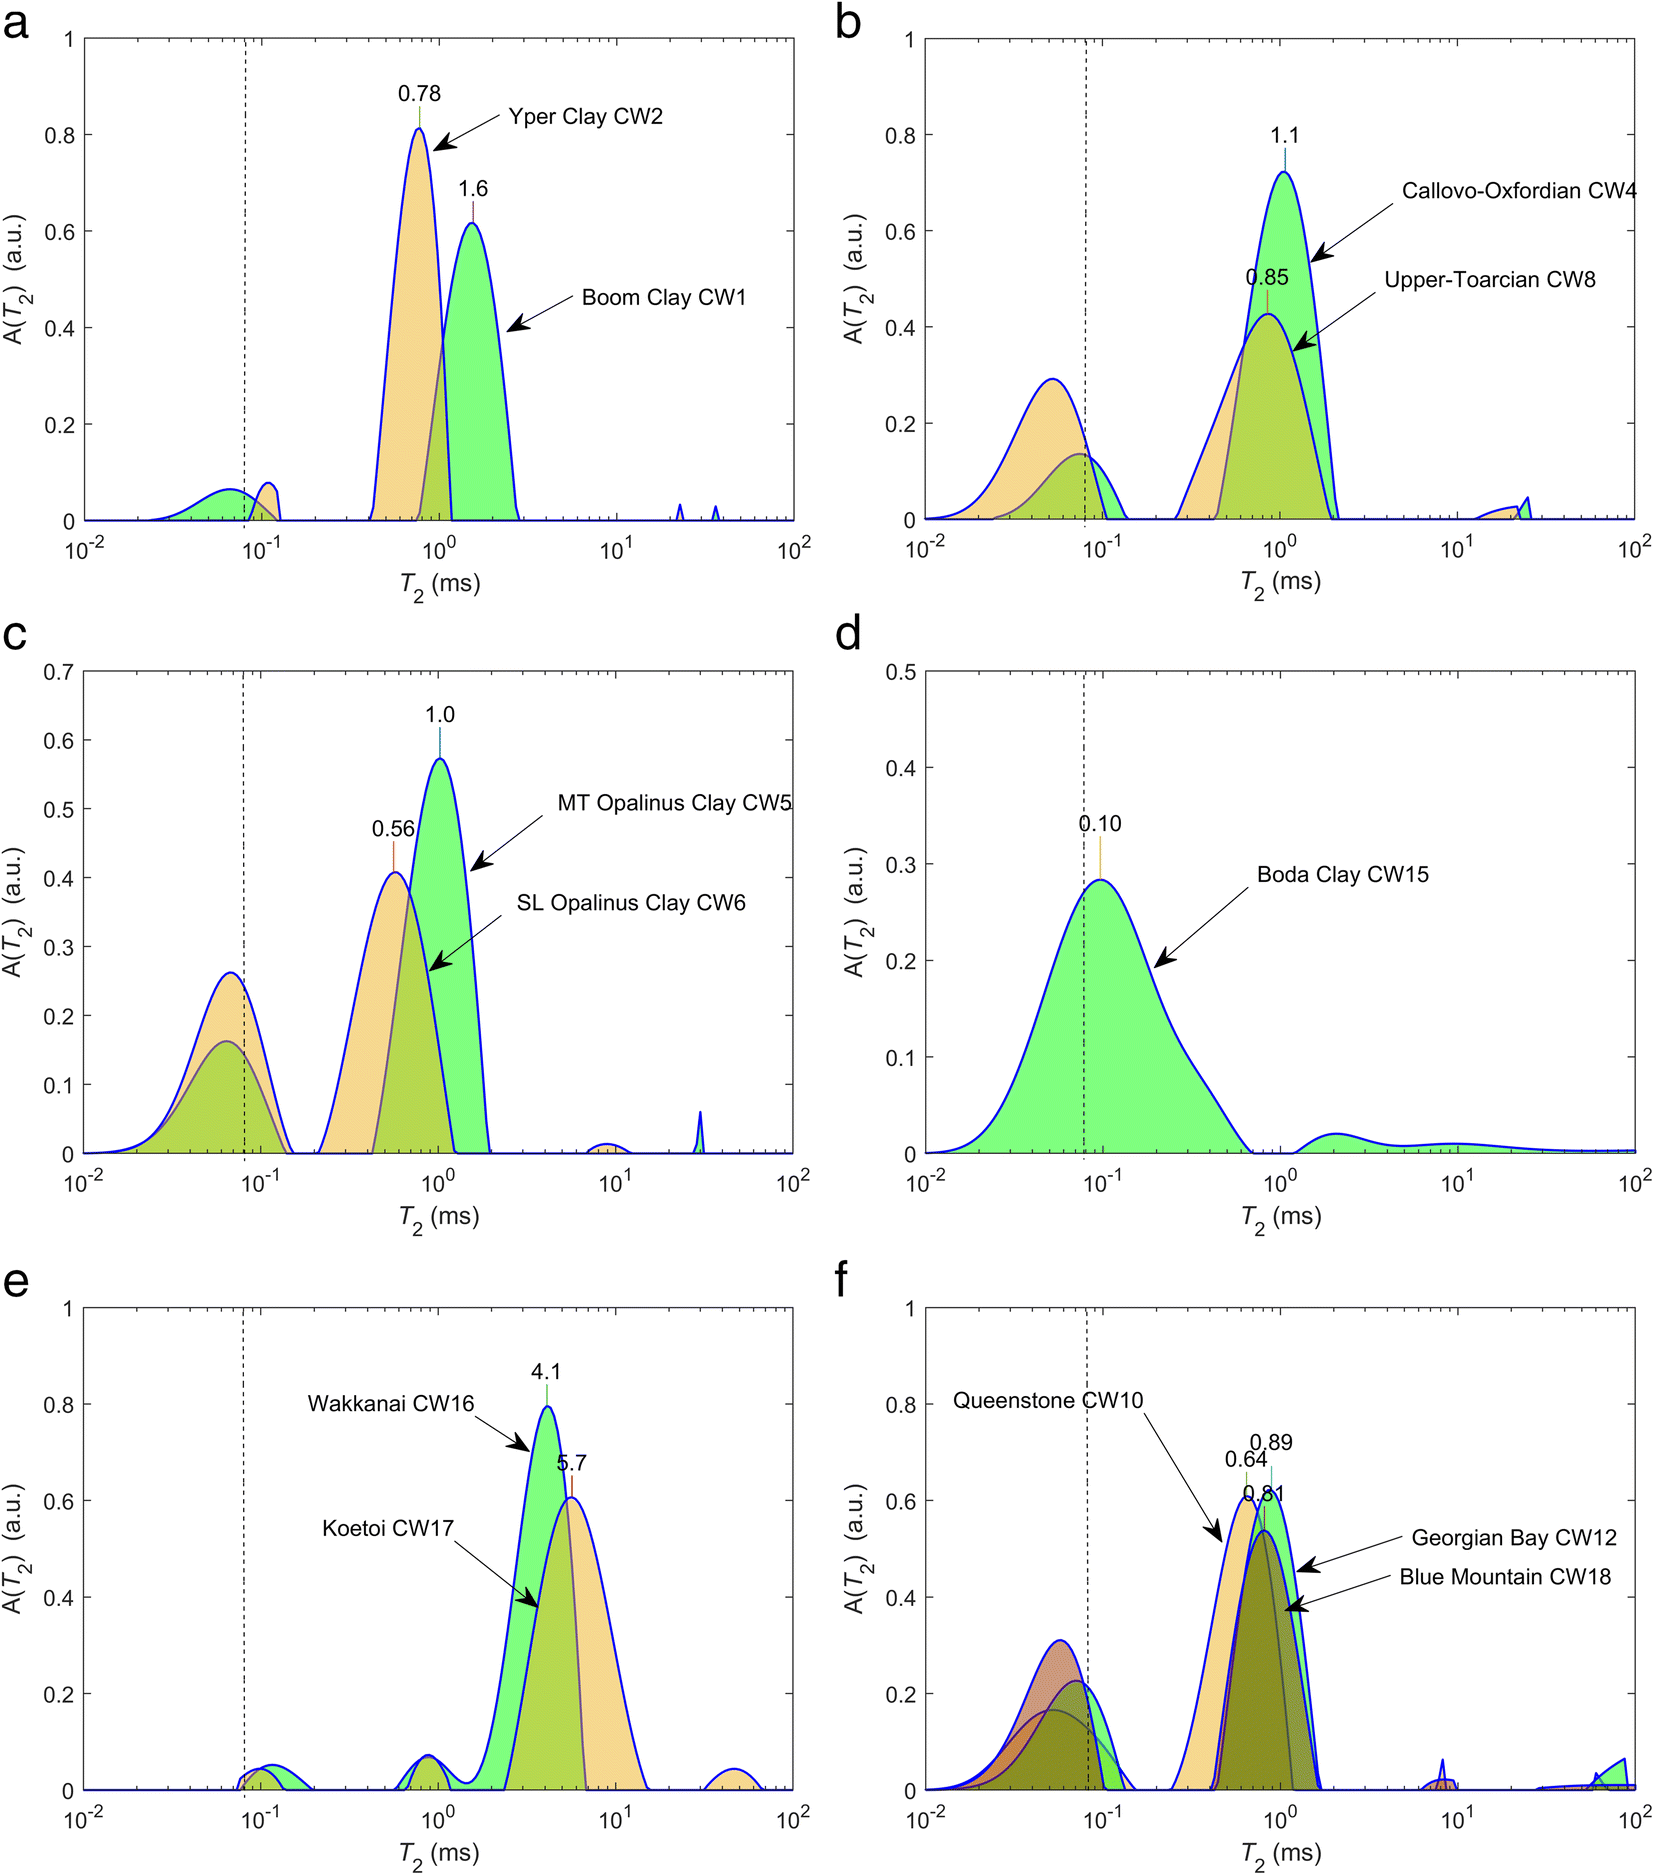
The relaxation-time distributions (Fig. 12) were grouped in a similar way as the cryoporometry data. First, in all cases, short components close to the resolution limit of 0.08 ms were observed, extending to 0.15 ms. As will be shown further with T 1-T 2 maps, these components have a large T 1/T 2 ratio and can be associated clearly with hydroxyls, not to be taken into account in porosity calculations. Note that the presence of hydroxyl components at 0.1 ms at the resolution limit does not mean that their relaxation time is 0.1 ms; other NMR techniques must be used to quantify these components (e.g. Fleury et al., Reference Fleury, Kohler, Norrant, Gautier, M'Hamdi and Barré2013). For the Boda Clay sample, no clear separation was noted between hydroxyls and porewater; in this case, the same cut-off of 0.15 ms was used to calculate water content and yielded reasonable values compared to the drying technique (Fig. 10).
T 2 relaxation-time distribution for the 11 formations studied. The dashed line indicates the resolution limit. The value of the mode is indicated on top of each distribution. A(T 2) is the amplitude of the distribution at the value T 2

The second important observation for most samples was a narrow distribution for components >0.15 ms, much smaller than for PSDs determined with NMR cryoporometry. A narrow width here means that the smallest and the largest values of the distribution are separated by a factor of 5 or less. This was obvious particularly for the Canadian samples CW10, CW12, and CW18. Moreover, no specific signature was observed for interlayer water (or water at <2 nm) as a distinct peak at a low T 2 value. These two observations confirmed a fast molecular diffusive exchange within the pore network during the magnetization lifetime. Therefore, T 2 distributions are not representative of the pore-size distribution (distribution of V/S) but rather the ratio of total volume V T over total surface area S T, unless the connectivity is poor. The latter is particularly the case for CW16 and CW17 (Japanese formations) exhibiting bimodal (Wakkanai Fm.) or even trimodal (Koetoi Fm.) distributions. For these samples, the T 2 distributions did not contradict their corresponding PSDs because a significant proportion of pore volume was <2 nm (12 and 24%), probably corresponding to components at 1 ms. They represent 8% and 4% of the pore volume, respectively, for CW16 and CW17 (these fractions were underestimated, however, because a diffusive exchange occurred between these populations as shown later in the T 2-T 2 maps).
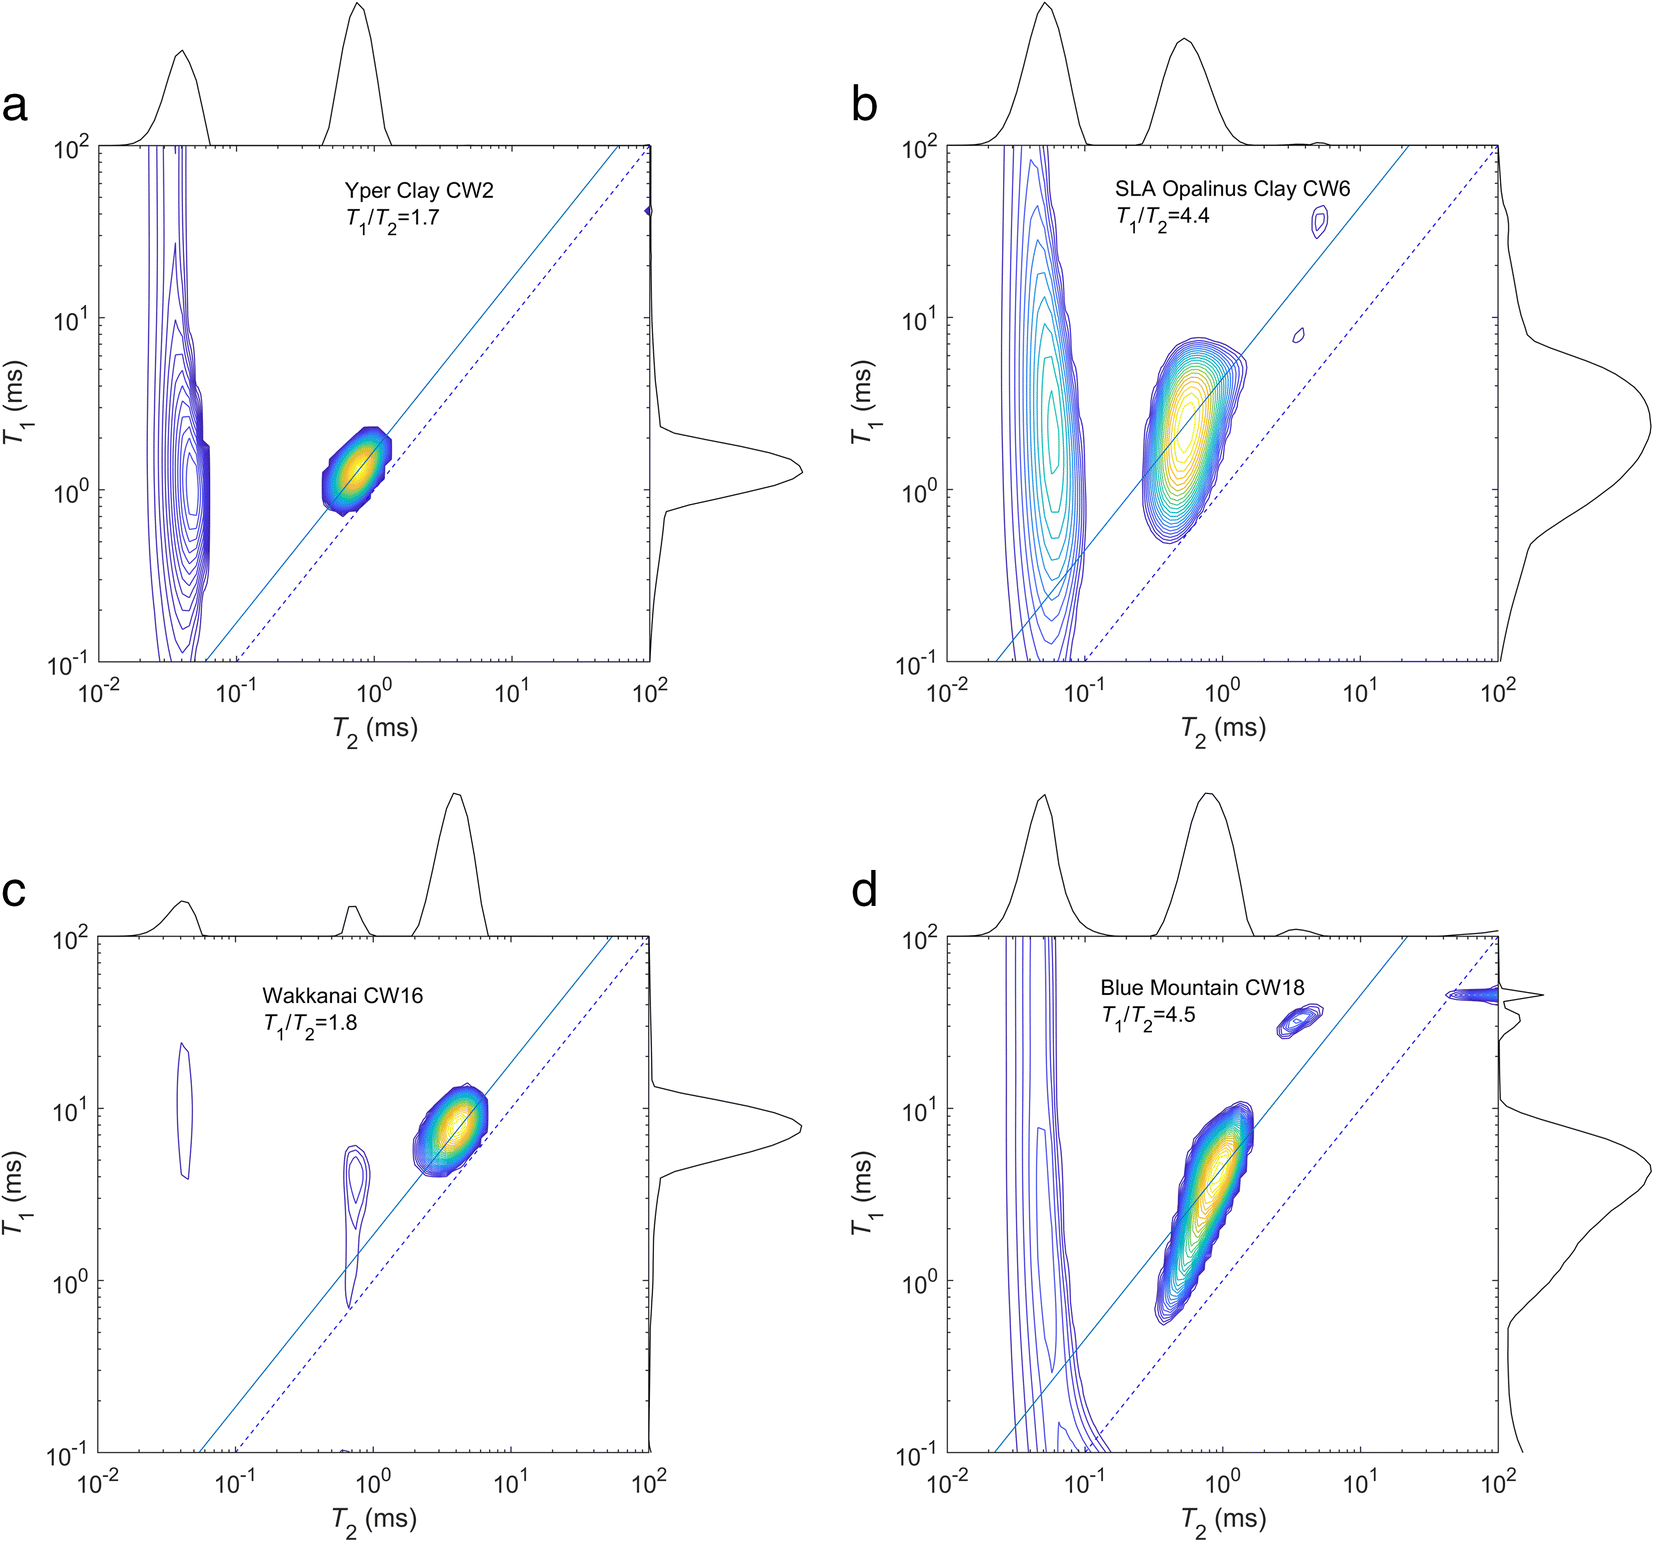
T 1-T 2 Maps
The first use of T 1-T2 maps was to differentiate proton populations. Regarding the interaction of the protons from water molecules with the solid surface, one expects from the literature a T 1/T 2 ratio of ~2 in permeable geological formations, such as sandstones (Dunn et al., Reference Dunn, Bergman and Latorraca2002), reaching 4 in cement (McDonald et al., Reference McDonald, Korb, Mitchell and Monteilhet2005). In the present case, the analysis was sensitive to the hydroxyl contribution as mentioned earlier when describing T 2 distributions because the instrument has a low T 2 resolution (0.08 ms). Clearly, a different population for T 2 around 0.1 ms in all cases can be proven (Fig. 13); hydroxyls are characterized by a quasi-solid behavior yielding very large T 1/T 2 ratios (>10). In a similar way as for T 2 distributions, however, these components are not located precisely in the maps because they are at the limit of resolution on both axes. The use of exponential models for these components may also be an issue (Washburn et al., Reference Washburn, Anderssen, Vogt, Seymour, Birdwell, Kirkland and Codd2015).
Examples of T 1-T 2 maps for four formations with various T 1/T 2 ratios. For the sample from the Blue Mountain Fm., the map was collected after KCl exchange. The dashed line indicates the diagonal T 1 = T 2; the solid line indicates the T 1/T 2 ratio of the mode

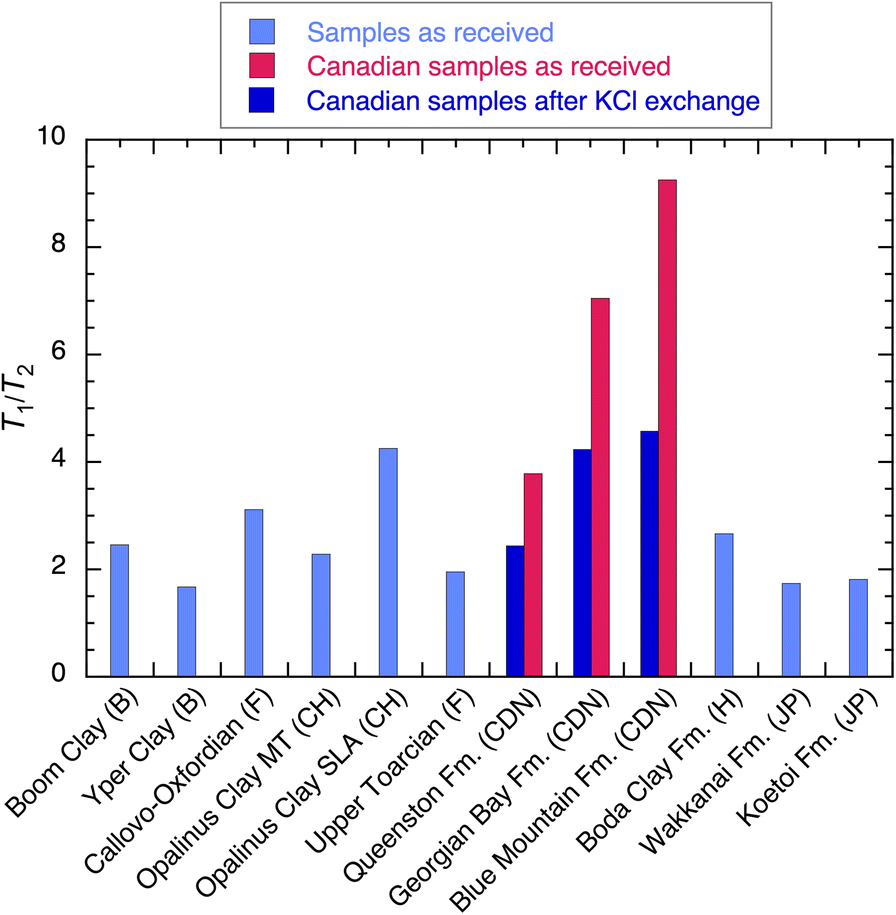
The second use is to compare T 1/T 2 ratios of the liquid components for the entire set of samples (Fig. 14), taken at the maximum of the map as indicated by the solid line. Remarkably, a large variation ranging from 1.7 to 4.5 was observed excluding the Canadian samples saturated with the in situ brine. According to the model summarized by Fig. 4, the correlation times, τm, and desorption time, τs, must be varied by at least one order of magnitude to reach a ratio of 4 compared to 2. The affinity of water for the solid surface could be qualified as normal below 2 and unusually high when reaching 4. The very high values (3.8 to 9.3) observed for the Canadian samples when saturated with the native brine (red in Fig. 14) must be related to a bulk fluid effect (very high salinity) in addition to a surface relaxation effect. Hence, T 1/T 2 ratios should be compared when the porewater has a low salinity.
T 1/T 2 ratio measured at 20.9 MHz for all samples

T 2-T 2 Maps
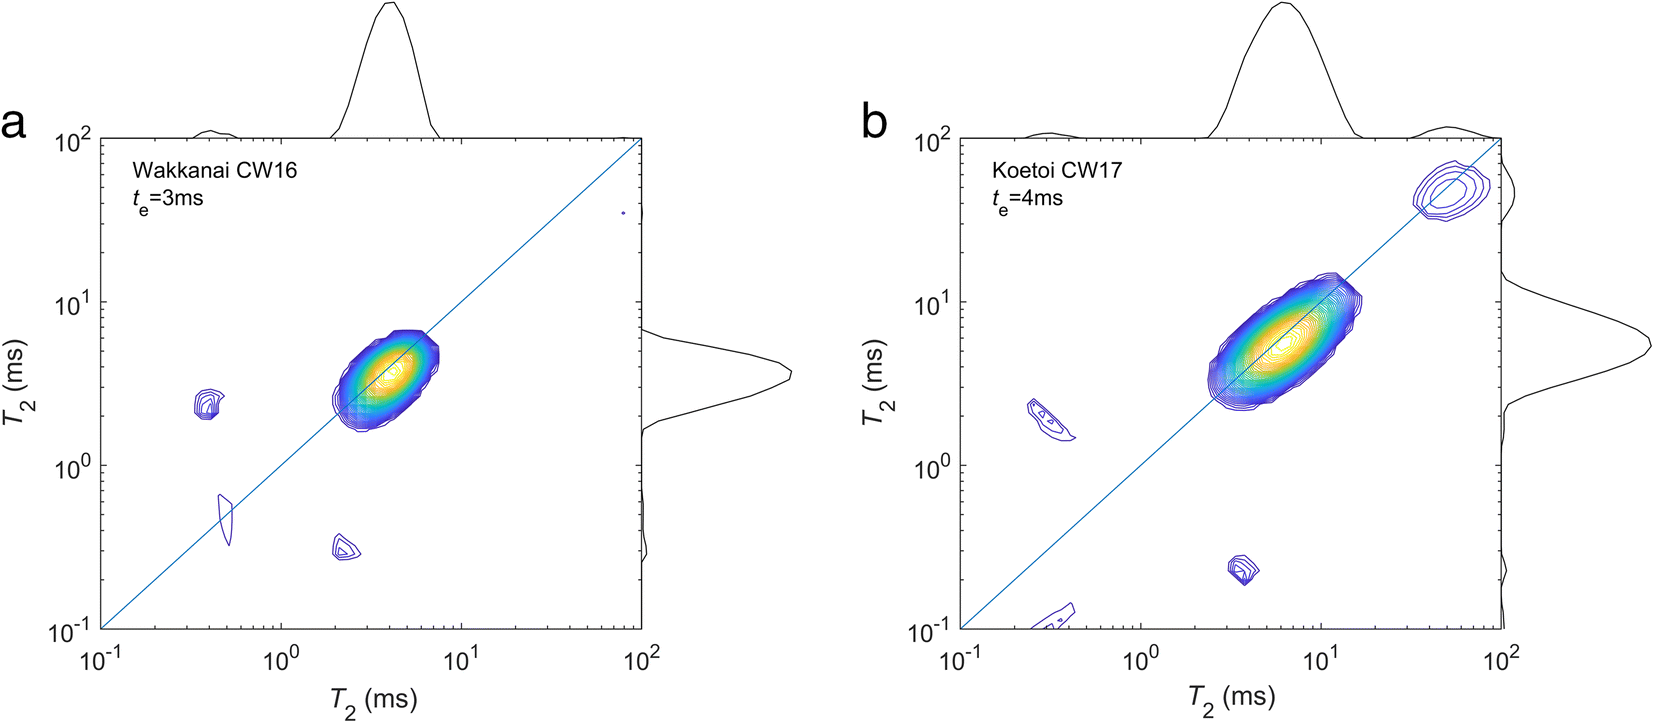
The measurement of T 2-T 2 maps expressing the diffusive exchange between two relaxation environments is of interest only in the presence of multimodal T 2 distributions, and this is the case only for the Japanese samples (Fig. 15). For the other samples, a narrow unimodal distribution reflected a strong coupling within the pore-size system as explained above, and reducing the diffusion coefficient would be necessary to prove different pore populations. For example, in smectite powders, ethylene glycol can be used to prove the existence of interlayer water (Fleury & Canet, Reference Fleury and Canet2014). In the case of the Japanese samples, a significant pore volume at <2 nm (micropores) was demonstrated and the T 2 components around 1 ms in the 1D distributions were associated with the micropores. An exchange between the micro- and mesopores was observed by the presence of off-diagonal peaks approximately at the expected positions (cf. Fig. 5). Because the micropore peak was small, the off-diagonal peaks were also very small and difficult to interpret. They were detected in a convincing way only at a long exchange time t e (3 and 4 ms) for which their amplitudes were at a maximum (Fleury & Soualem, Reference Fleury and Soualem2009). The reason why the exchange between the micro- and mesopores was limited for these particular porous systems is not understood and will require further imaging studies at the nanometer scale. As a working hypothesis, one may assume that the additional porewater reservoir that shows limited exchange is related to opal-CT and/or amorphous silica.
Measurement of T 2-T 2 maps on the Japanese sample CW16 and C17 showing diffusive coupling between two pore populations (off diagonal peaks). The exchange time is t e.

Discussion
Pore-size Distribution and N2 Adsorption (BET) Surface
From the distribution, P(d), of diameters based on cryoporometry, the mesopore surface area, S m, can be calculated according to:

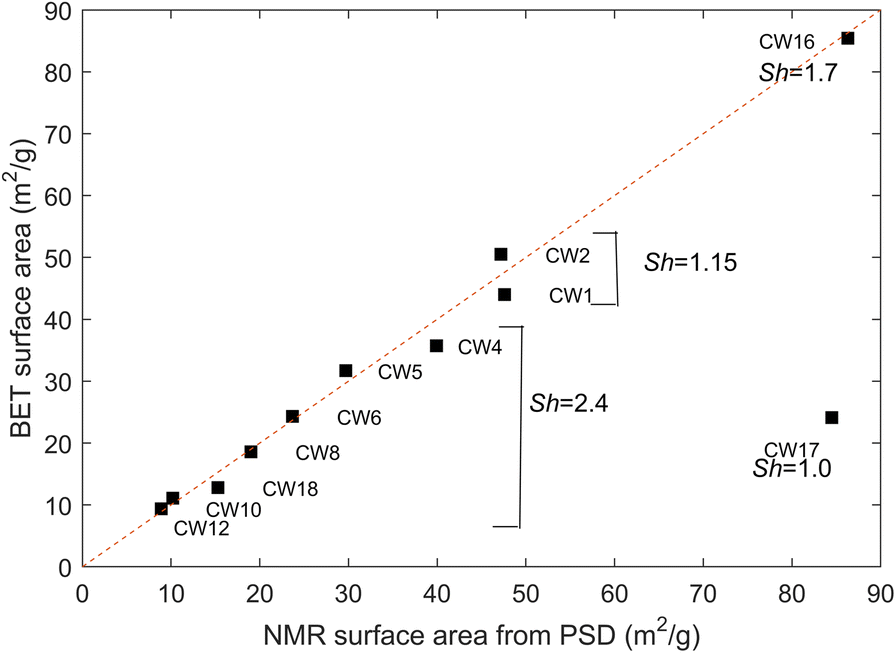
where Sh is a shape factor (d = Sh*V/S, Sh = 1 for a planar sheet and 4 for a cylinder). After normalization by the dry mass of the sample deduced from the NMR pore-volume measurements and the wet weight, S m can be compared directly to the N2 BET surface areas, S BET, taken from the CLAYWAT report (Mazurek et al., Reference Mazurek, Gimmi, Dohrmann, Emmerich, Fleury and Balcom2022). Nitrogen is generally considered unable to access the interlayer space of dried clay samples (Pennell, Reference Pennell, Dane and Topp2002) and also enters other micropores to only a limited extent (Thommes et al., 2015). Thus, the N2 BET surface area represents external surfaces only, and does not include interlayer micropores; a comparison with values derived from the NMR P(d) above is justified, therefore. The surface area for each measured distribution was calculated numerically and the shape factor adjusted to the value of 2.4 in order to agree with most samples except CW1, CW2, CW16, and CW17, as shown in Fig. 16. The shape factor of 2.4 corresponds neither to a planar sheet nor to a cylinder but to a combination of both or an intermediate shape. For samples CW1 and CW2 (Boom Clay and Yper Clay), a shape factor of 1.15 would be required to agree with the BET data. A shape factor of close to 1 (sheet-like) is in agreement with the N2 isotherm hysteresis shapes determined for these two samples (Mazurek et al., 2021). The Boom Clay and the Yper Clay are weakly consolidated, clay-rich formations with an essentially uncemented matrix, so a sheet-like pore-space architecture appears plausible. This is also confirmed by SEM studies using BIB/FIB polishing techniques (e.g Desbois et al., Reference Desbois, Urai and Kukla2009). For CW16 (Wakkanai Fm.), a specific shape factor of 1.7 is required. For CW17 (Koetoi Fm.), there is no possibility of reconciling the two measurements. Note that this sample contained ~50% amorphous silica, known to be highly porous, with a substantial surface area. Further, N2 adsorption measurements may take more time than is used in standard experimental protocols for the determination of the BET surface area, potentially leading to an underestimation of S BET (Ke et al., Reference Ke, Wu, Lin, Wang, Li, Xu, Yang, Han and Zhang2020).
Comparison of BET- and NMR-derived mesopore surfaces using the measured pore-size distributions and a shape factor of 2.4. To reconcile NMR and BET surfaces for CW1 and CW2, a shape factor of 1.15 would be required. The dashed line indicates the diagonal

Relaxation Time and N2 Adsorption (BET) Surface
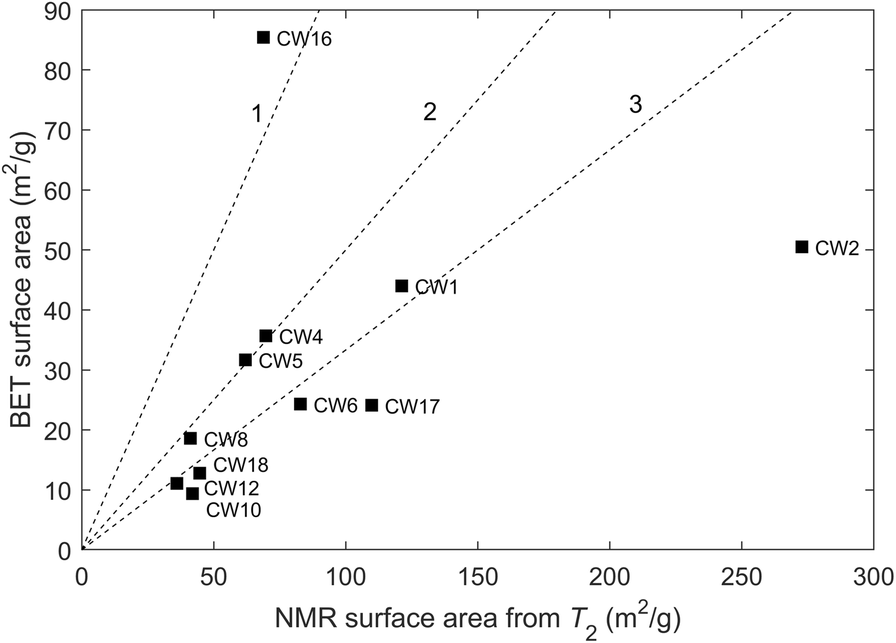
Another attempt to estimate surface areas was made using the mode of the T 2 relaxation-time distributions. As discussed in the section Relaxation-time Distribution, above, molecules can diffuse and explore the entire pore system during the magnetization lifetime. Hence, the mode of the distribution T 2m may be considered as representative of the ratio V T/S T of total volume over total surface area and the total surface area, S T, can, therefore, be calculated according to:

where the surface relaxivity, ρ2, is unknown. The surface areas deduced from T 2 are likely to be greater or much greater than those measured from N2 adsorption (BET), the latter representing only external (no interlayer) surfaces. Indeed, the surface in the microporosity can be very important in some cases. As an illustration, consider a double porosity system with two pore sizes of 1 and 10 nm in which the smaller size represents only 10% of the total volume. In this case, the contributions to the surface area of the micro- and mesopores are equal, i.e. the surface area determined from T 2 would be twice as large as the BET surface area representing mainly mesopores. However, the determination of the surface relaxivity is a difficult task because it depends on paramagnetic impurities at the solid surface; hence, the order of magnitude is known but substantial variations can arise between samples with a similar composition. In clay slurries (Matteson et al., Reference Matteson, Tomanic, Herron, Allen and Kenyon2013), the surface relaxivity was determined for smectite (ρ2 ≈ 1 μm/s), kaolinite (ρ2 ≈ 1 μm/s), illite (ρ2 ≈ 9 μm/s), and glauconite (ρ2 ≈ 22 μm/s) by comparing BET surface areas and T 2m using Eq. 8. For smectite, the value was certainly overestimated because the total surface area was underestimated by the BET area. Assuming ρ2 = 1 μm/s, the results indicated in Fig. 17 were obtained, in which S T was calculated from the total volume from NMR measurements and was then normalized by the dry mass of the sample. The T 2-based surface areas are strongly influenced by variations of the surface relaxivity; in particular, the case of CW1 and CW2 is of interest. Assuming that the BET surface area represents approximately the total surface area because little or no microporosity was observed for these two samples (Table 4, volume < 2 nm), the shape factor, Sh, was adjusted to 1.15 (see discussion above) and V T/S T can be calculated from the pore-size distribution, and finally ρ2 can be obtained from Eq. 8. For CW1 and CW2, values for ρ2 = 2.54 and 5.78 μm/s, respectively, were obtained; a variation between these two samples of more than a factor of 2 was observed but was within the expected range.
Comparison of N2 BET- and NMR-derived surfaces using the mode of the measured T 2 distributions and a surface relaxivity of 1 μm/s. The dashed lines indicates NMR values equal to or greater than by a factor of 1, 2, or 3

Summary and Conclusions
Several low-field NMR techniques were applied to preserved rock samples to characterize the state of porewater and the pore structure. A specific milling technique was used to extract small-diameter plugs (15 and 4 mm) from the cores originating from 11 clay-rich sedimentary formations. The key finding was that NMR cryoporometry was useful when the pore-size distributions were in the range 2–1000 nm; the distributions could be measured with the native saline porewater in place except for the Canadian samples (Queenston, Georgian Bay, and Blue Mountain Formations) for which the hypersaline porewater was replaced by a 20 g/L KCl solution. The cryoporometry technique was complemented by the measurement of pore volumes at <2 nm. The cryoporometry technique could not be applied in the special case of the Boda Clay Formation for which the porosity was too small. Porosities measured from T 2 relaxation data were comparable with values obtained from the drying technique at 105°C if the signals from solid-like components (hydroxyls) that are part of the solid structure are excluded. These components also have a clear signature in T 1-T 2 maps. For most samples, the narrow T 2 distributions compared to the PSD obtained from cryoporometry indicated that the pore network is well connected and that molecules diffuse throughout the entire pore system, including the smallest pore sizes of <2 nm, in the timescale of the magnetization lifetime (~1 ms). Therefore, T 2 distributions cannot be considered as proxies for the pore size distributions for such nanometric pore systems. This pore coupling effect has the advantage of permitting an easy measurement of the total pore volume, including pore sizes of <2 nm. In addition, the ratio T 1/T 2 allowed a relative classification between the samples in terms of strength of interaction of water with the mineral surfaces; a range of values from 1.7 to 4.6 was observed, expressing a variation by at least one order of magnitude of the characteristic surface diffusion coefficient or surface desorption times. These observations have yet to be correlated with other surface-sensitive measurements. Finally, for the poorly connected Japanese samples (Koetoi and Wakkanai Formations), T 2-T 2 maps were useful to show comparably slow diffusive pore exchange, implying the existence of strong diffusive barriers between the micro- and meso-porosity.
Acknowledgments
The authors thank the Clay Club, a working group of the OECD Nuclear Energy Agency, for supplying well characterized samples from the CLAYWAT project of which this study is part. Two anonymous reviewers and Editor-in-Chief, J. W. Stucki, provided valuable comments and criticisms.
Funding
This study was partially funded by the OECD Nuclear Energy Agency and by “Agence Nationale pour la Gestion des Déchets Radioactifs” (ANDRA).
Declarations
Conflict of Interest
The authors state that there is no conflict of interest.