



%20--%3e%3c!DOCTYPE%20svg%20PUBLIC%20'-//W3C//DTD%20SVG%201.0//EN'%20'http://www.w3.org/TR/2001/REC-SVG-20010904/DTD/svg10.dtd'%3e%3csvg%20version='1.0'%20id='Layer_1'%20xmlns='http://www.w3.org/2000/svg'%20xmlns:xlink='http://www.w3.org/1999/xlink'%20x='0px'%20y='0px'%20width='64px'%20height='64px'%20viewBox='5.5%20-3.5%2064%2064'%20enable-background='new%205.5%20-3.5%2064%2064'%20xml:space='preserve'%3e%3cg%3e%3ccircle%20fill='%23FFFFFF'%20fill-opacity='0'%20cx='37.785'%20cy='28.501'%20r='28.836'/%3e%3cpath%20fill='%23595959'%20d='M37.441-3.5c8.951,0,16.572,3.125,22.857,9.372c3.008,3.009,5.295,6.448,6.857,10.314%20c1.561,3.867,2.344,7.971,2.344,12.314c0,4.381-0.773,8.486-2.314,12.313c-1.543,3.828-3.82,7.21-6.828,10.143%20c-3.123,3.085-6.666,5.448-10.629,7.086c-3.961,1.638-8.057,2.457-12.285,2.457s-8.276-0.808-12.143-2.429%20c-3.866-1.618-7.333-3.961-10.4-7.027c-3.067-3.066-5.4-6.524-7-10.372S5.5,32.767,5.5,28.5c0-4.229,0.809-8.295,2.428-12.2%20c1.619-3.905,3.972-7.4,7.057-10.486C21.08-0.394,28.565-3.5,37.441-3.5z%20M37.557,2.272c-7.314,0-13.467,2.553-18.458,7.657%20c-2.515,2.553-4.448,5.419-5.8,8.6c-1.354,3.181-2.029,6.505-2.029,9.972c0,3.429,0.675,6.734,2.029,9.913%20c1.353,3.183,3.285,6.021,5.8,8.516c2.514,2.496,5.351,4.399,8.515,5.715c3.161,1.314,6.476,1.971,9.943,1.971%20c3.428,0,6.75-0.665,9.973-1.999c3.219-1.335,6.121-3.257,8.713-5.771c4.99-4.876,7.484-10.99,7.484-18.344%20c0-3.543-0.648-6.895-1.943-10.057c-1.293-3.162-3.18-5.98-5.654-8.458C50.984,4.844,44.795,2.272,37.557,2.272z%20M37.156,23.187%20l-4.287,2.229c-0.458-0.951-1.019-1.619-1.685-2c-0.667-0.38-1.286-0.571-1.858-0.571c-2.856,0-4.286,1.885-4.286,5.657%20c0,1.714,0.362,3.084,1.085,4.113c0.724,1.029,1.791,1.544,3.201,1.544c1.867,0,3.181-0.915,3.944-2.743l3.942,2%20c-0.838,1.563-2,2.791-3.486,3.686c-1.484,0.896-3.123,1.343-4.914,1.343c-2.857,0-5.163-0.875-6.915-2.629%20c-1.752-1.752-2.628-4.19-2.628-7.313c0-3.048,0.886-5.466,2.657-7.257c1.771-1.79,4.009-2.686,6.715-2.686%20C32.604,18.558,35.441,20.101,37.156,23.187z%20M55.613,23.187l-4.229,2.229c-0.457-0.951-1.02-1.619-1.686-2%20c-0.668-0.38-1.307-0.571-1.914-0.571c-2.857,0-4.287,1.885-4.287,5.657c0,1.714,0.363,3.084,1.086,4.113%20c0.723,1.029,1.789,1.544,3.201,1.544c1.865,0,3.18-0.915,3.941-2.743l4,2c-0.875,1.563-2.057,2.791-3.541,3.686%20c-1.486,0.896-3.105,1.343-4.857,1.343c-2.896,0-5.209-0.875-6.941-2.629c-1.736-1.752-2.602-4.19-2.602-7.313%20c0-3.048,0.885-5.466,2.658-7.257c1.77-1.79,4.008-2.686,6.713-2.686C51.117,18.558,53.938,20.101,55.613,23.187z'/%3e%3c/g%3e%3c/svg%3e)
%20--%3e%3c!DOCTYPE%20svg%20PUBLIC%20'-//W3C//DTD%20SVG%201.0//EN'%20'http://www.w3.org/TR/2001/REC-SVG-20010904/DTD/svg10.dtd'%3e%3csvg%20version='1.0'%20id='Layer_1'%20xmlns='http://www.w3.org/2000/svg'%20xmlns:xlink='http://www.w3.org/1999/xlink'%20x='0px'%20y='0px'%20width='64px'%20height='64px'%20viewBox='5.5%20-3.5%2064%2064'%20enable-background='new%205.5%20-3.5%2064%2064'%20xml:space='preserve'%3e%3cg%3e%3ccircle%20fill='%23FFFFFF'%20fill-opacity='0'%20cx='37.637'%20cy='28.806'%20r='28.276'/%3e%3cg%3e%3cpath%20fill='%23595959'%20d='M37.443-3.5c8.988,0,16.57,3.085,22.742,9.257C66.393,11.967,69.5,19.548,69.5,28.5c0,8.991-3.049,16.476-9.145,22.456%20C53.879,57.319,46.242,60.5,37.443,60.5c-8.649,0-16.153-3.144-22.514-9.43C8.644,44.784,5.5,37.262,5.5,28.5%20c0-8.761,3.144-16.342,9.429-22.742C21.101-0.415,28.604-3.5,37.443-3.5z%20M37.557,2.272c-7.276,0-13.428,2.553-18.457,7.657%20c-5.22,5.334-7.829,11.525-7.829,18.572c0,7.086,2.59,13.22,7.77,18.398c5.181,5.182,11.352,7.771,18.514,7.771%20c7.123,0,13.334-2.607,18.629-7.828c5.029-4.838,7.543-10.952,7.543-18.343c0-7.276-2.553-13.465-7.656-18.571%20C50.967,4.824,44.795,2.272,37.557,2.272z%20M46.129,20.557v13.085h-3.656v15.542h-9.944V33.643h-3.656V20.557%20c0-0.572,0.2-1.057,0.599-1.457c0.401-0.399,0.887-0.6,1.457-0.6h13.144c0.533,0,1.01,0.2,1.428,0.6%20C45.918,19.5,46.129,19.986,46.129,20.557z%20M33.042,12.329c0-3.008,1.485-4.514,4.458-4.514s4.457,1.504,4.457,4.514%20c0,2.971-1.486,4.457-4.457,4.457S33.042,15.3,33.042,12.329z'/%3e%3c/g%3e%3c/g%3e%3c/svg%3e)
1. Introduction
The reflection of sound at an impermeable body is a fundamental problem in continuum acoustics that has been studied extensively over the years (Howe Reference Howe1998; Pierce Reference Pierce2019). In particular, the scattering of acoustic perturbations at a solid edge, generating high sound levels due to the singular type of fluid–surface interaction involved, has received much attention. Such scenarios occur frequently where flow non-uniformities pass in the vicinity of a finite structure, as prevalent in high-lift devices (e.g. in airfoil–vortex interactions) and turbomachinery applications. The benchmark problem considers the sound generated by a point source placed in the vicinity of a body sharp end, where specific treatments differ in details such as surface geometry and acoustic source properties.
While edge scatter noise has been treated in detail in continuum acoustics, the counterpart problem at non-continuum conditions has not been addressed hitherto. Considering gaseous media, non-continuum conditions take place in set-ups where the length or time scales become of the order of the molecular mean free path or time, respectively. Motivated by low-pressure and small-scale technologies, investigations on sound propagation in rarefied gases commenced in the 1950s, focusing primarily on one-dimensional propagation generated by solid surface mechanical (Maidanik, Fox & Heckl Reference Maidanik, Fox and Heckl1965; Sirovich & Thurber Reference Sirovich and Thurber1965; Loyalka & Cheng Reference Loyalka and Cheng1979; Stefanov, Gospodinov & Cercignani Reference Stefanov, Gospodinov and Cercignani1998; Sharipov & Kalempa Reference Sharipov and Kalempa2008; Kalempa & Sharipov Reference Kalempa and Sharipov2009; Struchtrup Reference Struchtrup2012; Tsuji & Aoki Reference Tsuji and Aoki2013) or thermal (Manela & Hadjiconstantinou Reference Manela and Hadjiconstantinou2007, Reference Manela and Hadjiconstantinou2010; Kalempa & Sharipov Reference Kalempa and Sharipov2012; Manela, Radtke & Pogorelyuk Reference Manela, Radtke and Pogorelyuk2014; Ben-Ami & Manela Reference Ben-Ami and Manela2020a) excitations. These works were complemented more recently by two-dimensional studies, where non-uniform actuations were considered in semi-infinite (Manela & Ben-Ami Reference Manela and Ben-Ami2021) or channel-confined (Hadjiconstantinou & Garcia Reference Hadjiconstantinou and Garcia2001; Hadjiconstantinou Reference Hadjiconstantinou2002; Hadjiconstantinou & Simek Reference Hadjiconstantinou and Simek2003; Handford et al. Reference Handford, O'Connor, Anderson and Long2008; Wu Reference Wu2016; Liu et al. Reference Liu, Chi, Guo and Yang2018; Manela & Ben-Ami Reference Manela and Ben-Ami2022) geometries.
In a separate set of studies, the effect of gas rarefaction on the propagation of flow-induced disturbances was investigated. Here, set-ups with gas-fluidic thermal sources, having specific relevance in the areas of microscale heat transfer (Chen Reference Chen2002; Tzou Reference Tzou2015) and ultrafast heating processes (Tzou & Pfautsch Reference Tzou and Pfautsch2002), were analysed. Logan (Reference Logan1963), and then Berkovsky & Bashtovoi (Reference Berkovsky and Bashtovoi1977), focused on the propagation of thermal disturbances in an infinite gas medium, applying Grad's moment equations and other model approximations of the Boltzmann equation in their calculations. Later investigations included the impact of boundaries reflections, yet were limited to the continuum limit of small Knudsen numbers (Zappoli & Bailly Reference Zappoli and Bailly1990; Herczynski & Kassoy Reference Herczynski and Kassoy1991). The counterpart nonlinear near-continuum gas response to local compression was studied by Danforth & Long (Reference Danforth and Long2004), who carried out numerical simulations in a non-confined set-up.
The impact of gas rarefaction on the interaction of flow disturbances with a solid surface was studied recently in one- (Ben-Ami & Manela Reference Ben-Ami and Manela2020b) and two-dimensional (Manela & Ben-Ami Reference Manela and Ben-Ami2023) configurations. Considering a half-space gas medium confined by an infinite planar wall, the propagation of small-amplitude thermodynamic perturbations at non-continuum conditions was investigated. Specifically, the system response to locally imposed density and temperature non-uniformities was analysed, and the effect of kinetic wall conditions was examined. Closed-form solutions were derived at free-molecular and continuum-limit conditions, and the acoustic force on the planar surface, acting normal to the boundary, was computed.
In view of the above, the objective of the present work is to extend existing works and study the effect of gas rarefaction on the two-dimensional scattering of sound at a solid edge. To the best of our knowledge, the interaction of acoustic perturbations with a sharp-edged body in a rarefied gas has not been considered hitherto. Primarily, we are interested in a detailed description of the near-field gas interaction with a sharp solid end at arbitrary Knudsen numbers. Additionally, the problem is applied as a means for detecting the applicability of acoustic reciprocity at non-continuum conditions.
Initially introduced by Helmholtz and Rayleigh (Reference Rayleigh1945), acoustic reciprocity serves as a fundamental property in continuum acoustics, allowing for the interchange of point source and listener positions. Having considerable practical significance, the reciprocity principle has been consequently used to facilitate numerous numerical calculations and experimental measurements (Fokkema & van den Berg Reference Fokkema and van den Berg1993; Howe Reference Howe1998; Pierce Reference Pierce2019). While being effective in the majority of applications, recent studies have reported on non-reciprocal acoustic phenomena, illustrating that the coupling between geometrical asymmetry and fluid viscosity may result in the breakdown of reciprocality (Fleury et al. Reference Fleury, Sounas, Haberman and Alú2015; Heo et al. Reference Heo, Walker, Zubov, Shymkiv, Wages, Krokhin, Choi and Neogi2020; Nassar et al. Reference Nassar, Yousefzadeh, Fleury, Ruzzene, Alú, Daraio, Norris, Huang and Haberman2020). Since viscous and compressible effects inherently prevail in rarefied gas flows, it is of particular interest to examine whether local source and listener positions may be symmetrically interchanged at non-continuum conditions.
Towards this end, we consider a canonical set-up of a thin finite plate immersed in an infinite two-dimensional gas expanse. Acoustic excitation is imposed as initial density and temperature perturbations, prescribed in the vicinity of the plate. In practice, such inhomogeneities may occur due to gas local compression or heating, respectively, and serve as useful means for introducing flow perturbation. The system time response is followed, and the evolution of the acoustic disturbance is examined. Closed-form results are derived in the free-molecular limit, highlighting the system behaviour far from equilibrium. Our findings are complemented by direct simulation Monte Carlo (DSMC) calculations, to test the breakdown of free-molecular conditions and capture the system response at intermediate rarefaction rates. Advantageously, DSMC computations may also be carried out at exceedingly low Knudsen numbers, enabling a comparison between the ballistic- and continuum-limit behaviours. Due to problem complexity, the near-field characteristics in the latter limit were not tackled analytically, where DSMC calculations offer a viable alternative.
In the next section the finite-plate problem is stated. The analysis of the free-molecular limit is detailed in § 3 and the DSMC scheme, applied to solve the problem at arbitrary rarefaction rates, is described in § 4. Our results for the cases of initial impulse and Gaussian excitations are presented in §§ 5 and 6, respectively, followed by concluding comments in § 7. Technical details are relegated to the appendices.
2. Statement of the problem
A schematic of the problem is shown in figure 1. Consider a two-dimensional expanse of an ideal monatomic gas surrounding a thin flat plate of length  $L^*$. The plate is placed along the
 $x^*$ axis (
 $y^*=0$) with its edge points located at
 $(x^*,y^*)=(0,\pm L^*/2)$ (hereafter, asterisks denote dimensional quantities). At time
 $t^*=0$, the gas is set at rest, with prescribed initial non-uniform distributions of its hydrodynamic density and temperature,
 \begin{equation} \rho_{{tot}}^*(0,x^*,y^*)=\rho_0^*+\varepsilon\rho^*_{{in}}(x^*,y^*) \quad \mathrm{and} \quad T_{{tot}}^*(0,x^*,y^*)=T_0^*+\varepsilon T^*_{{in}}(x^*,y^*),\end{equation}
respectively. In (2.1a,b),  $\varepsilon \ll 1$, so that the system linearised response may be considered. It is assumed that the initial disturbances are confined to a narrow zone in the vicinity of the plate, located at a characteristic distance
 $L_y^*$ from the boundary and a shift
 $L_x^*$ from its midpoint (see the dashed circle in figure 1). In practice, such scenarios may occur due to any small thermodynamic non-uniformities imposed by external disturbances of local compression or heating. We apply the above model problem to investigate the effect of gas rarefaction on two-dimensional sound scattering at a sharp edge. Additionally, by interchanging between the locations of the initial disturbance and the observer, we test the impact of non-continuum conditions on the applicability of acoustic reciprocity. To this end, the system response to pointwise delta-function (impulse) perturbation will be analysed.
Schematic of the problem. A thin flat plate of length  $L^*$ is placed in an unbounded two-dimensional monatomic gas expanse. The gas uniform density
 $\rho _0^*$ and temperature
 $T_0^*$ are locally perturbed at time
 $t^*=0$ at a characteristic distance
 $L_y^*$ from the plate and a shift
 $L_x^*$ from its midpoint.

The interaction between the acoustic disturbance and the plate is strongly affected by the boundary conditions applied at the solid surface. Here, we compare between perfectly reflecting (specular) and fully diffuse (isothermal) wall surfaces, representing limit realisations of completely smooth and accommodating boundaries, respectively. Diffuse scattering occurs over ‘rough’ surfaces, where the colliding particles attain thermal equilibrium with the reflecting wall and evaporate accordingly. Specular interactions take place where the incident molecules collide with a solid surface and rebound elastically as if hitting a perfectly smooth wall. While none of these idealised scenarios exists in reality, it is commonly accepted that wall reflections from realistic surfaces may be described, in a variety of applications, as a combination of diffuse and specular interactions, as formulated in the prevalent Maxwell-type surface condition (Sone Reference Sone2007). Since the combined diffuse-specular case merely superposes the above two limits in the present linear formulation, it is not discussed in detail hereafter.
Considering the problem formulation in the isothermal-surface configuration, the wall temperature is assumed equal to the gas reference temperature  $T^*_0$. In both isothermal- and specular-wall set-ups, a dimensionless description of the problem is obtained by scaling the position by the plate length
 $L^*$, the velocity by the most probable speed of a gas molecule
 $U_{{mp}}^{*}=\sqrt {2\mathcal {R}^{*}T_{0}^{*}}$ (with
 $\mathcal {R}^{*}$ denoting the specific gas constant) and the time by the consequent time scale
 $L^{*}/U_{{mp}}^{*}$. The density and temperature are normalised by
 $\rho _{0}^{*}$ and
 $T_{0}^{*}$, respectively, and the pressure by
 $\rho _{0}^{*}\mathcal {R}^{*}T_{0}^{*}$. The non-dimensional problem is then governed by the scaled initial disturbance fields
 $\rho _{{in}}(x,y)$ and
 $T_{{in}}(x,y)$, together with the reference Knudsen number
 \begin{equation} {Kn}=l^*/L^* ,\end{equation}
marking the ratio between the mean free path of a gas molecule  $l^*$ and the system characteristic length scale. The non-dimensional counterparts of the characteristic source-plate distance
 $L_y^*$ and offset
 $L_x^*$ are incorporated in the specific form taken for
 $\rho _{{in}}(x,y)$ and
 $T_{{in}}(x,y)$. Assuming a monatomic hard-sphere gas, the molecular mean free path is given by
 $l^*=m^*/(\sqrt {2}{\rm \pi} \rho _0^*d^{*2})$, where
 $m^*$ and
 $d^*$ denote the molecular atomic mass and diameter, respectively (Sone Reference Sone2007).
In § 3 the gas response in the free-molecular limit is analysed. The application of the DSMC method to the problem solution is described in § 4 . Closed-form collisionless results are presented in § 5 for the case of impulse excitation. A comparison between the collisionless and DSMC predictions at non-infinite Knudsen numbers is carried out in § 6 for the case of Gaussian excitation, to validate the free-molecular description and examine its breakdown with decreasing Knudsen numbers. Advantageously, DSMC calculations could be carried out through relatively low rarefaction rates, capturing the system behaviour in the continuum limit, and providing a quantitative examination of the differences from the counterpart gas response in the free-molecular regime. The normal and shear acoustic forces imposed on the plate are presented and discussed.
3. Free-molecular limit
In the framework of gas kinetic theory and the present two-dimensional unsteady flow configuration, the gas state is governed by the velocity distribution function  $f=f(t,x,y,\boldsymbol {\xi })$ of finding a gas molecule with velocity about
 $\boldsymbol {\xi }=(\xi _x,\xi _y,\xi _z)$ at a position near
 $(x,y)$ at time
 $t$. At the linearised conditions assumed we set
 \begin{equation} f(t,x,y,\boldsymbol{\xi})=F[1+\varepsilon\phi(t,x,y, \boldsymbol{\xi})],\end{equation}
where  $F={\rm \pi} ^{-3/2}\exp [-\xi ^{2}]$ denotes the non-dimensional Maxwellian equilibrium distribution and
 $\phi (t,x,y,\boldsymbol {\xi })$ marks the velocity distribution perturbation function (Kogan Reference Kogan1969). Assuming the Knudsen number to be large, we consider the collisionless two-dimensional unsteady Boltzmann equation for
 $\phi (t,x,y,\boldsymbol {\xi })$,
 \begin{equation} \frac{\partial\phi}{\partial t}+\xi_x\frac{\partial\phi}{\partial x}+\xi_y\frac{\partial\phi}{\partial y}=0 .\end{equation}
The equation is supplemented by the initial condition
 \begin{equation} \phi(0,x,y,\boldsymbol{\xi}) = \phi_{{in}}(x,y,\boldsymbol{\xi}),\end{equation}
which, in accordance with (2.1a,b), takes the linearised form of deviation from equilibrium
 \begin{equation} \phi_{{in}}(x,y,\boldsymbol{\xi})=\rho_{{in}}(x,y)+T_{{in}}(x,y)(\xi^2-3/2).\end{equation}
The velocity distribution perturbation function is additionally subject to a far-field decay condition and a boundary condition imposed at the solid plate surface. For the case of a fully diffuse isothermal boundary, the latter takes the linearised half-range form
 \begin{equation} \phi^{{(iso)}}(t,-1/2\leq x\leq1/2,0^{{\pm}},\boldsymbol{\xi}\boldsymbol{\cdot}\boldsymbol{\hat{y}} \gtrless0)=\rho^{{\pm}}_w(t,x),\end{equation}
along the upper ( $y=0^+$) and lower (
 $y=0^-$) solid surfaces. Here,
 $\boldsymbol {\hat {y}}$ is a unit vector directed in the positive
 $y$ direction (normal to the plate) and
 $\rho ^{\pm }_w(t,x)$ are treated unknown. Considering a specular-wall set-up, the probability perturbation function satisfies the symmetry condition
 \begin{align} \phi^{{(spec)}}(t,-1/2\leq x\leq1/2,0^\pm,\xi_x,\xi_y,\xi_z)=\phi^{{(spec)}}(t,-1/2\leq x\leq1/2,0^\pm,\xi_x,-\xi_y,\xi_z).\end{align}
The isothermal- and specular-wall set-ups are subsequently analysed in §§ 3.1 and 3.2, respectively. In § 3.3, expressions for the acoustic force imposed on the plate are detailed. To simplify the presentation, and without loss of generality, we consider cases where the initial disturbance is imposed at the upper half-plane only,  $y>0$. Cases where the disturbance is initialised at the lower half-plane (
 $y<0$), or at both lower and upper parts of the plane, may be obtained through simple manipulations of the following analysis.
3.1. Isothermal plate
Considering a fully diffuse isothermal wall and an initial disturbance that is confined to the upper half-plane, the solution for (3.2) subject to the initial condition (3.3) and boundary condition (3.5) is conveniently divided into its upper- and lower-half-plane parts. For  $y>0$ and particles that have not hit the wall since the initial
 $t=0$ time,
 \begin{equation} \phi^{{(iso)}}(t,x,y>0,\boldsymbol{\xi}) = \rho_{{in}}(x_{{in}},y_{{in}})+T_{{in}} (x_{{in}},y_{{in}})(\xi^2-3/2),\end{equation}
where
 \begin{equation} x_{{in}}\equiv x-\xi_xt \quad \mathrm{and} \quad y_{{in}}\equiv y-\xi_yt \end{equation}
denote the initial (at  $t=0$) coordinates of the gas molecule. The above distribution applies to gas particles approaching the plate (
 $\xi _y<0$) or moving away from the surface (
 $\xi _y>0$) with a free-flight path that has not been affected by the wall since
 $t=0$. For
 $\xi _y>0$, this further implies that the retarded
 $x$ coordinate of the particles satisfies
 \begin{equation} x_{{ret}}\equiv x-(\xi_x/\xi_y)y\gtrless\pm1/2,\end{equation}
i.e. that the particle trajectory has passed sideways to the plate, or
 \begin{equation} {-}1/2\leq x_{{ret}}\leq1/2 \quad \mathrm{and} \quad t_{{ret}}\equiv t-y/\xi_y<0,\end{equation}
implying that at the initial time the particle was located within  $-1/2\leq x\leq 1/2$ and in the upper half-plane. The velocity distribution perturbation function for particles at
 $y>0$ that have collided with the surface since
 $t=0$ is given by
 \begin{equation} \phi^{{(iso)}}(t,x,y>0,\boldsymbol{\xi}) = \rho^+_w(t_{{ret}},x_{{ret}}) .\end{equation}
Complementary to (3.7), this distribution applies to gas molecules maintaining  $\xi _y>0, -1/2\leq x_{{ret}}\leq 1/2$ and
 $t_{{ret}}\geq 0$.
Traversing to the lower  $y<0$ half-plane and considering particles that have not hit the wall since
 $t=0$, we obtain
 \begin{equation} \phi^{{(iso)}}(t,x,y<0,\boldsymbol{\xi}) = \rho_{{in}}(x_{{in}},y_{{in}})+T_{{in}} (x_{{in}},y_{{in}})(\xi^2-3/2),\end{equation}
applicable to gas molecules with  $\xi _y>0$ or with
 $\xi _y<0$ and
 $x_{{ret}}\gtrless \pm 1/2$. Additionally, since the initial disturbance is confined to the upper half-plane and molecular collisions are ignored, the lower
 $y=0^-$ plate surface does not interact with particles carrying the perturbation signal. Consequently,
 $\rho ^-_w(t,x)=0$ and
 \begin{equation} \phi^{{(iso)}}(t,x,y<0,\boldsymbol{\xi}) = 0,\end{equation}
for molecules with  $\xi _y<0$ and
 $-1/2\leq x_{{ret}}\leq 1/2$.
The wall function  $\rho ^+_w(t,x)$ appearing in (3.11) is determined via imposition of the linearised form of the impermeability condition at the upper plate surface. Applying (3.1), we obtain
 \begin{align}
& v^{{(iso)}}(t,-1/2\leq x\leq
1/2,0^+)\nonumber\\
& \qquad=\frac{1}{{\rm \pi}^{3/2}}\int_{-\infty}^{\infty}\xi_y\phi^{{(iso)}}(t,-1/2\leq
x\leq 1/2,0^+,\boldsymbol{\xi})\exp[-\xi^2]\,
\mathrm{d}\boldsymbol{\xi}=0,
\end{align}
where  $\mathrm {d}\boldsymbol {\xi }=\mathrm {d}\xi _x\,\mathrm {d}\xi _y\,\mathrm {d}\xi _z$. Substituting (3.7) and (3.11) into (3.14), carrying the
 $\xi _z$ integration and making the changes of variables
 $s=x-\xi _xt$ and
 $q=-\xi _yt$, we find that
 \begin{align} \rho_w^+(t,x)&=
\frac{2}{\sqrt{\rm \pi} t^3}
\int_0^{\infty}q\exp\left[-\left(\frac{q}{t}\right)^2\right]
\int_{-\infty}^{\infty}\left[\rho_{{in}}(s,q)+
T_{{in}}(s,q)\left(\left(\frac{x-s}{t}\right)^2\right.\right.\nonumber\\
&\quad\left.\left.+\vphantom{\left(\frac{x-s}{t}\right)^2}
\left(\frac{q}{t}\right)^2-1\right)\right]
\times\exp\left[-\left(\frac{x-s}{t}\right)^2\right]\,
\mathrm{d}s\,\mathrm{d}q.
\end{align}
Having determined  $\rho _w^+(t,x)$ and consequent
 $\phi (t,x,y,\boldsymbol {\xi })$, appropriate quadratures over the velocity space yield expressions for the
 $O(\varepsilon )$-scaled hydrodynamic perturbations. The density perturbation
 $\rho (t,x,y)$, tangential velocity
 $u(t,x,y)$, normal velocity
 $v(t,x,y)$ and stress component deviations
 $P_{ij}(t,x,y)$ (with
 $i$ and
 $j$ being
 $x$,
 $y$ or
 $z$) are given by (Sone Reference Sone2007)
 \begin{align} \left.\begin{array}{@{}c@{}}
\displaystyle
\rho(t,x,y)={\rm \pi}^{{-}3/2}\int_{-\infty}^{\infty}\phi\,
\mathrm{e}^{-\xi^2}\,\mathrm{d}\boldsymbol{\xi},\\
\displaystyle
u(t,x,y)={\rm \pi}^{{-}3/2}\int_{-\infty}^{\infty}\xi_x\phi\,
\mathrm{e}^{-\xi^2}\,\mathrm{d}\boldsymbol{\xi} , \quad
v(t,x,y)={\rm \pi}^{{-}3/2}\int_{-\infty}^{\infty}\xi_y\phi\,
\mathrm{e}^{-\xi^2}\,\mathrm{d}\boldsymbol{\xi} ,\\
\displaystyle
P_{xx}(t,x,y)={\rm \pi}^{{-}3/2}\int_{-\infty}^{\infty}\xi_x^2\phi\,
\mathrm{e}^{-\xi^2}\,\mathrm{d}\boldsymbol{\xi} , \quad
P_{yy}(t,x,y)={\rm \pi}^{{-}3/2}\int_{-\infty}^{\infty}\xi_y^2\phi\,
\mathrm{e}^{-\xi^2}\,\mathrm{d}\boldsymbol{\xi} ,\\
\displaystyle
P_{xy}(t,x,y)={\rm \pi}^{{-}3/2}\int_{-\infty}^{\infty}\xi_x\xi_y\phi\,
\mathrm{e}^{-\xi^2}\,\mathrm{d}\boldsymbol{\xi} \quad
\mathrm{and} \quad
P_{zz}(t,x,y)={\rm \pi}^{{-}3/2}\int_{-\infty}^{\infty}
\xi_z^2\phi\,\mathrm{e}^{-\xi^2}\,\mathrm{d}\boldsymbol{\xi}
, \end{array}\right\}
\end{align}
respectively, where  $\phi =\phi ^{{(iso)}}$ is substituted to obtain the results in the isothermal-plate case. The integrations over
 $\xi _x$ and
 $\xi _y$ at each
 $(x,y)$ location follow the
 $(\xi _x,\xi _y)$ space divisions specified above, as detailed in Appendix A. The acoustic pressure and temperature perturbations are consequently given by
 \begin{align} \begin{aligned}
p^{{(iso)}}(t,x,y)&=\frac{2}{3}(P^{{(iso)}}_{xx}
+P^{{(iso)}}_{yy}+P^{{(iso)}}_{zz}) \quad \mathrm{and}\\
T^{{(iso)}}(t,x,y)&=p^{{(iso)}}(t,x,y)-
\rho^{{(iso)}}(t,x,y),\end{aligned}
\end{align}
respectively, with the latter marking the linearised form of the gas equation of state.
3.2. Specular plate
Similar to the diffuse-wall case, for particles that have not hit the wall since the initial  $t=0$ time,
 \begin{equation} \phi^{{(spec)}}(t,x,y,\boldsymbol{\xi}) = \rho_{{in}}(x_{{in}},y_{{in}})+T_{{in}}(x_{{in}},y_{{in}}) (\xi^2-3/2).\end{equation}
In the upper half-plane ( $y>0$), this applies to all gas molecules with
 $\xi _y<0$ or those with
 $\xi _y>0$ satisfying (3.9) or (3.10a,b). In the lower half-plane (
 $y<0$), (3.18) is valid for molecules with
 $\xi _y>0$ or with
 $\xi _y<0$ and
 $x_{{ret}}\gtrless \pm 1/2$. Particles affected by the initial perturbation that have hit the specular wall after
 $t=0$ may be found in the upper half-plane only, and satisfy
 \begin{equation} \phi^{{(spec)}}(t,x,y>0,\boldsymbol{\xi}) = \rho_{{in}}(x_{{in}},y_{{spec}})+T_{{in}} (x_{{in}},y_{{spec}})(\xi^2-3/2),\end{equation}
where
 \begin{equation} y_{{spec}}\equiv\xi_yt_r=\xi_yt-y>0\end{equation}
denotes the particle initial  $y$ location prior to wall reflection. Equation (3.19) applies to gas molecules with
 $\xi _y>0, -1/2\leq x_{{ret}}\leq 1/2$ and
 $t_{{ret}}\geq 0$.
Substituting (3.18) and (3.19) into (3.16), the expressions for the acoustic fields follow by quadratures over the velocity space, as detailed in Appendix A.
3.3. Acoustic force on plate
The acoustic loading on the plate, to be discussed in §§ 5 and 6, consists of normal- and shear-force components, calculated via
 \begin{equation} N(t)={-}\int_{{-}1/2}^{1/2}P_{yy}(t,x,0^+)\,\mathrm{d}\kern0.7pt x \quad \mathrm{and} \quad S(t)={-}\int_{{-}1/2}^{1/2}P_{xy}(t,x,0^+)\,\mathrm{d}\kern0.7pt x, \end{equation}
respectively. In both expressions, integration of the stress components is carried out over the upper plate surface only, as no contribution to the force arrives from the lower side of the plate for upper-half-plane perturbations. Substituting (A4) and its specular-wall counterpart into (3.21a,b), we obtain, for the normal force in the isothermal- and specular-plate set-ups,
 \begin{align} N^{{(iso)}}(t)={-}\int _{{-}1/2}^{1/2} \left(\frac{1}{4}\rho_w^+(t,x)+h(t,x)\right)\,\mathrm{d}\kern0.7pt x \quad \mathrm{and} \quad N^{{(spec)}}(t)={-}2\int _{{-}1/2}^{1/2}h(t,x)\,\mathrm{d}\kern0.7pt x, \end{align}
respectively, where
 \begin{align} h(t,x)=\frac{1}{\rm \pi}\int_{-\infty}^{0}\int_{-\infty}^{\infty} \xi_y^2 [\rho_{{in}}(x_{{in}},-\xi_yt)+T_{{in}}(x_{{in}},-\xi_yt) (\xi_x^2+\xi_y^2-1)]\, \mathrm{e}^{-\xi_x^2-\xi_y^2}\,\mathrm{d}\xi_x\,\mathrm{d}\xi_y. \end{align}
For the shear force in the isothermal-wall set-up, we find that
 \begin{align}
S^{{(iso)}}(t)&=\frac{1}{\rm \pi}\int_{{-}1/2}^{1/2}
\int_{-\infty}^{0}\int_{-\infty}^{\infty} \xi_x\xi_y
[\rho_{{in}}(x_{{in}},-\xi_yt)+T_{{in}}(x_{{in}},-\xi_yt) (\xi_x^2+\xi_y^2-1)]\nonumber\\ &\quad \times
\mathrm{e}^{-\xi_x^2-\xi_y^2}\,\mathrm{d}\xi_x\,\mathrm{d}\xi_y
\,\mathrm{d}\kern0.7pt x.
\end{align}
The shear force on a specular wall vanishes identically,
 \begin{equation} S^{{(spec)}}(t)\equiv0, \end{equation}
since  $P^{{(spec)}}_{xy}(t,-1/2\leq x\leq 1/2,0^+)\equiv 0$ in line with the symmetrical wall condition.
4. Numerical scheme: DSMC method
The DSMC method, initially introduced by Bird (Reference Bird1994), is a stochastic particle-based method, commonly applied to simulate gas flows at non-continuum conditions. In the present work we make use of the DSMC scheme to validate our analytical free-molecular predictions and explore the system behaviour at arbitrary Knudsen numbers. We accordingly adopt Bird's algorithm, and apply it for a hard-sphere gas model (Bird Reference Bird1994), to simulate the system response.
In each simulation the initial gas state was set in accordance with (2.1a,b) and the chosen distributions of temperature and density fields. In the temperature-driven case, the particles were allocated with uniform distribution of their initial positions. Their velocities were assigned according to a Maxwellian distribution, with the temperature (governing the variance of the particles' velocity distribution) following the prescribed initial profile. In the density-driven set-up the particles were assigned random uniformly distributed initial positions. A uniform-temperature Maxwellian distribution was imposed, with particles added at positions in accordance with the initial density perturbation. Each simulation was followed in time and terminated at  $t_{{sim}}^{*}\approx 1.5L^{*}/U_{mp}^*$, which proved sufficient to describe the interaction between the disturbance front (initially peaked at a distance
 $(x^*,y^*) \lesssim L^*/2$ from the plate) and the finite wall. The wall surface was assumed either specular or fully diffuse with prescribed uniform temperature
 $T_0^*$.
The size of the computational domain was set such that the signal does not reach (and is therefore not affected by) virtual outer boundaries placed at  $y_{{top}}^{*}= 3 L^{*}$,
 $y_{{bottom}}^{*}= -1.5 L^{*}$ and
 $x_{{left/right}}^{*}= \mp 3 L^{*}$. The
 $(x^*,y^*)\in ([x^*_{{left}}, x^*_{{right}}], [y_{{bottom}}^{*}, y^*_{{top}}])$ domain was divided into
 $\approx 10^4$ cells. An additional division of each cell into collisional subcells was carried out to comply with the mean-free-path limitations (Bird Reference Bird1994). A typical run consisted of
 $\approx 10^{8}$ particles, where
 $\approx 10^3$ realisations were followed to sufficiently reduce the numerical noise. In line with the linearised problem formulation, a value of
 $\varepsilon =0.1$ was taken for the level of initial perturbations (see (2.1a,b)), for which nonlinear effects proved to be negligible. The calculations were made using a 32-core Threadripper 3975WX machine, with each computation lasting several days.
5. Impulse response
Applying the free-molecular analysis in § 3, our results may be obtained for arbitrary choices of the gas initial density and temperature perturbations,  $\rho _{{in}}(x,y)$ and
 $T_{{in}}(x,y)$. In this section we discuss the system response to an impulse input of either the density or temperature fields, by setting
 \begin{equation} \rho_{{in}}(x,y)=\delta(x-x_\delta)\delta(y-y_\delta) \quad \mathrm{or} \quad T_{{in}}(x,y) =\delta(x-x_\delta)\delta(y-y_\delta),\end{equation}
where  $\delta ({\cdot })$ marks the Dirac delta function and
 $y_\delta >0$, in accordance with assuming that the initial perturbation is imposed at the upper
 $y>0$ half-plane. The delta-function analysis enables the study of the system response to a point-localised source, which may be conveniently applied for testing the applicability of acoustic reciprocity at non-continuum conditions. The DSMC scheme, however, could not be used in this context due to the ambiguous representation of a delta-function source in simulations. The numerical validation of our calculations and analysis of the system response at finite Knudsen numbers are deferred to § 6, where a Gaussian input perturbation is considered.
In practice, the significance of studying the impulse response in the free-molecular limit is two fold. First, any non-localised excitation signal may be expressed as a convolution over a distribution of delta functions with the desired source form. Consequently, since the system is linear, the delta-function response may be considered as a ‘building block’ for any other non-localised source. Second, our numerical results presented in § 6 indicate that the free-molecular description remains quantitatively valid at  $O(1)$ Knudsen numbers and somewhat lower, making the collisionless point-source analysis of practical relevance.
5.1. Analysis
Starting with the upper half-plane, we substitute (5.1) into (3.15) and integrate to obtain the wall function in the case of a density impulse
 \begin{equation} \rho_w^{(\delta_{\rho})}(t,x)=\frac{2y_\delta}{\sqrt{\rm \pi}t^3}{H}(y_\delta) \exp\left[-\left(\frac{x-x_\delta}{t}\right)^2-\left(\frac{y_\delta}{t}\right)^2\right],\end{equation}
and a temperature perturbation
 \begin{align}
\rho_w^{(\delta_T)}(t,x)=
\frac{2y_\delta}{\sqrt{\rm \pi}t^3}{H}(y_\delta) \left[
\left(\frac{x-x_\delta}{t}\right)^2+\left(\frac{y_\delta}{t}\right)^2-1
\right] \exp\left[-\left(\frac{x-x_\delta}{t}\right)^2-
\left(\frac{y_\delta}{t}\right)^2\right].\end{align}
Here,  ${H}({\cdot })$ denotes the Heaviside step function. Equations (5.2) and (5.3) can now be used, upon substitution to the pertinent expressions in Appendix A, to derive the free-molecular system impulse response, as detailed in Appendix B.
Advantageously, the above analysis yields closed-form results for the acoustic perturbations along the plate upper ( $-1/2\leq x\leq 1/2,y=0^+$) surface. For the density perturbation in response to the
 $\delta _{\rho }$ and
 $\delta _T$ excitations, we find that
 \begin{align}
\left.\begin{array}{@{}c@{}} \displaystyle
\rho^{({iso},\delta_\rho)}(t,-1/2< x<1/2,0^+)=
\dfrac{\rho_w^{(\delta_{\rho})}(t,x)}{2}+\dfrac{1}{{\rm \pi}
t^2} \mathrm{e}^{-\xi_{x_1}^2-\xi_{y_{10}}^2} \quad
\mathrm{and} \\
\displaystyle \rho^{({iso},\delta_T)}(t,-1/2< x<1/2,0^+)=
\dfrac{\rho_w^{(\delta_T)}(t,x)}{2}+\dfrac{1}{{\rm \pi} t^2}
(\xi_{x_1}^2+\xi_{y_{10}}^2-1)
\,\mathrm{e}^{-\xi_{x_1}^2-\xi_{y_{10}}^2}
\end{array}\right\}, \end{align}
respectively, over an isothermal plate, and
 \begin{equation}
\left.\begin{array}{@{}c@{}} \displaystyle
\rho^{({spec},\delta_\rho)}(t,-1/2<
x<1/2,0^+)=\dfrac{2}{{\rm \pi} t^2}
\,\mathrm{e}^{-\xi_{x_1}^2-\xi_{y_{10}}^2} \quad
\mathrm{and} \\ \displaystyle
\rho^{({spec},\delta_T)}(t,-1/2< x<1/2,0^+)=\dfrac{2}{{\rm \pi}
t^2}(\xi_{x_1}^2+\xi_{y_{10}}^2-1)
\,\mathrm{e}^{-\xi_{x_1}^2-\xi_{y_{10}}^2}
\end{array}\right\}, \end{equation}
for a specular surface, where
 \begin{equation} \xi_{x_1} = \frac{x-x_\delta}{t} \quad \mathrm{and}\quad \xi_{y_{10}}={-}\frac{y_\delta}{t}.\end{equation}
Following to the  $x$-velocity component, we find that in the isothermal-wall case
 \begin{equation} \left.\begin{array}{@{}c@{}}
\displaystyle u^{({iso},\delta_\rho)}(t,-1/2< x<1/2,0^+)=
\dfrac{1}{{\rm \pi}
t^2}\xi_{x_1}\,\mathrm{e}^{-\xi_{x_1}^2-\xi_{y_{10}}^2}
\quad \mathrm{and} \\ \displaystyle
u^{({iso},\delta_T)}(t,-1/2< x<1/2,0^+)=\dfrac{1}{{\rm \pi}
t^2}\xi_{x_1} (\xi_{x_1}^2+\xi_{y_{10}}^2-1)\,
\mathrm{e}^{-\xi_{x_1}^2-\xi_{y_{10}}^2}
\end{array}\right\}, \end{equation}
and over a specular plate
 \begin{equation} \left.\begin{array}{@{}c@{}}
\displaystyle u^{({spec},\delta_\rho)}(t,-1/2<
x<1/2,0^+)=\dfrac{2}{{\rm \pi} t^2}
\xi_{x_1}\mathrm{e}^{-\xi_{x_1}^2-\xi_{y_{10}}^2} \quad
\mathrm{and} \quad \\ \displaystyle
u^{({spec},\delta_T)}(t,-1/2< x<1/2,0^+)=\dfrac{2}{{\rm \pi}
t^2} \xi_{x_1}(\xi_{x_1}^2+\xi_{y_{10}}^2-1)
\mathrm{e}^{-\xi_{x_1}^2-\xi_{y_{10}}^2}
\end{array}\right\}. \end{equation}
The  $y$-velocity component vanishes at the plate in accordance with surface impermeability, and the normal and shear stresses are given by
 \begin{align} \left.\begin{array}{@{}c@{}}
\displaystyle P_{yy}^{({iso},\delta_\rho)}(t,-1/2<
x<1/2,0^+)= \dfrac{y_\delta}{\sqrt{\rm \pi}
t^3}\left(\dfrac{1}{2}+
\dfrac{y_\delta}{\sqrt{\rm \pi}t}\right)\mathrm{e}^{-\xi_{x_1}^2
-\xi_{y_{10}}^2},\\
\displaystyle
P_{yy}^{({iso},\delta_T)}(t,-1/2< x<1/2,0^+)=
\dfrac{y_\delta}{\sqrt{\rm \pi} t^3}\left(\dfrac{1}{2}+
\dfrac{y_\delta}{\sqrt{\rm \pi}t}\right)(\xi_{x_1}^2+\xi_{y_{10}}^2-1)
\,\mathrm{e}^{-\xi_{x_1}^2-\xi_{y_{10}}^2},\\
\displaystyle
P_{yy}^{({spec},\delta_\rho)}(t,-1/2< x<1/2,0^+)=
\dfrac{2}{{\rm \pi} t^2}\xi_{y_{10}}^2
\,\mathrm{e}^{-\xi_{x_1}^2-\xi_{y_{10}}^2},\\
\displaystyle
P_{yy}^{({spec},\delta_T)}(t,-1/2< x<1/2,0^+)=
\dfrac{2}{{\rm \pi}
t^2}\xi_{y_{10}}^2(\xi_{x_1}^2+\xi_{y_{10}}^2-1)\,
\mathrm{e}^{-\xi_{x_1}^2-\xi_{y_{10}}^2},
\end{array}\right\} \end{align}
and
 \begin{align}
\left.\begin{array}{@{}c@{}} \displaystyle
P_{xy}^{({iso},\delta_\rho)}(t,-1/2< x<1/2,0^+)
={-}\dfrac{y_\delta(x-x_\delta)}{{\rm \pi}
t^4}\mathrm{e}^{-\xi_{x_1}^2-\xi_{y_{10}}^2},\\
\displaystyle P_{xy}^{({iso},\delta_T)}(t,-1/2<
x<1/2,0^+)={-}\dfrac{y_\delta(x-x_\delta)}{{\rm \pi}
t^4}(\xi_{x_1}^2+\xi_{y_{10}}^2-1)\,
\mathrm{e}^{-\xi_{x_1}^2-\xi_{y_{10}}^2},\\
\displaystyle
P_{xy}^{({spec},\delta_\rho)}(t,-1/2< x<1/2,0^+)=
P_{xy}^{({spec},\delta_T)}(t,-1/2< x<1/2,0^+)=0,
\end{array}\right\} \end{align}
respectively. Substituting (5.9) and (5.10) into (3.21a,b) and integrating, we obtain expressions for the acoustic force on the plate. For the normal force, we find that
 \begin{align} \left.\begin{array}{@{}l@{}}
\displaystyle
N^{({iso},\delta_\rho)}(t)={-}\dfrac{y_\delta}{2t^2}\left(\dfrac{1}{2}+\dfrac{y_\delta}{\sqrt{\rm \pi}t}
\right)\mathrm{e}^{-({y_\delta}/{t})^2}\left[
\mathrm{erfc}\left(-\dfrac{1/2+x_\delta}{t}\right)-
\mathrm{erfc}\left(\dfrac{1/2-x_\delta}{t}\right)\right]
,\\
\displaystyle
N^{({iso},\delta_T)}(t)={-}\dfrac{y_\delta}{\sqrt{\rm \pi}
t^2}\mathrm{e}^{-({y_\delta}/{t})^2}
\left(\dfrac{1}{2}+\dfrac{y_\delta}{\sqrt{\rm \pi}t}\right)
\left\{\dfrac{\sqrt{\rm \pi}}{2}\left[\left(\dfrac{y_\delta}{t}\right)^2-
\dfrac{1}{2}\right]\right.\\
\displaystyle \quad \times
\left[\mathrm{erfc}\left(-\dfrac{1/2+x_\delta}{t}\right)-
\mathrm{erfc}\left(\dfrac{1/2-x_\delta}{t}\right)\right]-
\dfrac{1}{2t} \left[\left(\dfrac{1}{2}-x_\delta\right)
\mathrm{e}^{-{(1/2-x_\delta)^2}/{t^2}}\right.\\
\displaystyle \quad +
\left.\left.\left(\dfrac{1}{2}+x_\delta\right)
\mathrm{e}^{-{(1/2+x_\delta)^2}/{t^2}}\right]\right\},\\
\displaystyle
N^{({spec},\delta_\rho)}(t)={-}\dfrac{y_\delta^2}{\sqrt{\rm \pi}t^3}\,
\mathrm{e}^{-({y_\delta}/{t})^2}
\left[\mathrm{erfc}\left(-\dfrac{1/2+x_\delta}{t}\right)-
\mathrm{erfc}\left(\dfrac{1/2-x_\delta}{t}\right) \right]
\quad \mathrm{and}\\
\displaystyle
N^{({spec},\delta_T)}(t)={-}\dfrac{2y_\delta^2}{{\rm \pi}
t^3}\mathrm{e}^{-({y_\delta}/{t})^2}\left\{
\dfrac{\sqrt{\rm \pi}}{2}\left[\left(\dfrac{y_\delta}{t}\right)^2-\dfrac{1}{2}\right]
\left[\mathrm{erfc}\left(-\dfrac{1/2+x_\delta}{t}\right)\right.\right.\\
\displaystyle \quad -\left.\left.
\mathrm{erfc}\left(\dfrac{1/2-x_\delta}{t}\right)\right]- \dfrac{1}{2t}
\left[\left(\dfrac{1}{2}-x_\delta\right)\mathrm{e}^{-{(1/2-x_\delta)^2}/{t^2}}+
\left(\dfrac{1}{2}+x_\delta\right)
\mathrm{e}^{-{(1/2+x_\delta)^2}/{t^2}}\right]\right\},
\end{array}\right\} \end{align}
in the isothermal- and specular-plate set-ups with density and temperature perturbations, respectively, where  $\mathrm {erfc}(s)=(2/\sqrt {{\rm \pi} })\int _s^\infty \mathrm {e}^{-q^2}\mathrm {d}q$ denotes the complementary error function. The counterpart tangential shear-force components are
 \begin{equation} \left.\begin{array}{@{}l@{}}
\displaystyle
S^{({iso},\delta_\rho)}(t)=\dfrac{y_\delta}{2{\rm \pi}
t^2}\mathrm{e}^{-({y_\delta}/{t})^2}(
\mathrm{e}^{-{(1/2-x_\delta)^2}/{t^2}}-\mathrm{e}^{-{(1/2+x_\delta)^2}/{t^2}}
) ,\\ \displaystyle S^{({iso},\delta_T)}(t)=
\dfrac{y_\delta}{2{\rm \pi} t^2}\mathrm{e}^{-({y_\delta}/{t})^2}
\left[\vphantom{\left(\dfrac{1/2+x_\delta}{t}\right)^2} \left(\dfrac{y_\delta}{t}\right)^2
(\mathrm{e}^{-{(1/2-x_\delta)^2}/{t^2}}-\mathrm{e}^{-{(1/2+x_\delta)^2}/{t^2}}
)\right.\\ \displaystyle \quad +
\left(\dfrac{1/2-x_\delta}{t}\right)^2\mathrm{e}^{-{(1/2-x_\delta)^2}/{t^2}}
-\left.\left(\dfrac{1/2+x_\delta}{t}\right)^2\mathrm{e}^{-{(1/2+x_\delta)^2}/{t^2}}
\right], \end{array}\right\}
\end{equation}
and  $S^{({spec},\delta _\rho )}(t)=S^{({spec},\delta _T)}(t)=0$. The above results are further discussed below.
5.2. Results
To present our findings, we focus primarily on a case where the point source is located at  $(x_\delta,y_\delta )=(0.5,0.5)$, in the relative vicinity of the plate
 $x=0.5$ edge. For this set-up, we examine the effects of plate wall conditions (specular or isothermal) and source type (initial temperature or density impulses) on the flow properties. Other source locations are then considered to examine their impact on the acoustic loading on the plate, as well as on the applicability of acoustic reciprocity.
Figure 2 shows time-snapshot colour maps of the free-molecular acoustic pressure in response to a temperature impulse imposed at  $(x_\delta,y_\delta )=(0.5,0.5)$. The results are depicted at times
 $t=0.1,0.5$ and
 $1$ and compared between specular- and isothermal-plate systems. For clarity of presentation, each figure is divided into three zones, confined by the dashed lines. In zone I the acoustic field is affected by the source only and not by plate reflections; zone II is obscured by the plate and not affected by the source; and zone III is influenced by both source and plate. Assuming collisionless flow conditions, this division is based on problem kinematics. Specifically, zone II is delineated in the lower
 $y<0$ half-plane by the straight lines emanating at the source and passing through the plate edge points. In the absence of molecular collisions, no free-flight particle trajectories may originate at the source and pass through this zone, which is consequently obstructed by the solid wall. In contrast, all points in zone III may be reached either by particles emitted directly from the source or after being reflected from the plate. Notably, these zone boundaries differ between specular- and diffuse-plate systems: while it contains the entire upper
 $y>0$ half-plane in the latter, it is restricted by the
 $x=1/2$ and
 $x=-8y/3-1/2$ lines in the former, determined by possible specular-reflection trajectories of particles emanating at the source and emitted at the wall
 $x=\pm 0.5$ edges. Zone I then complements the
 $(x,y)$ plane division, where the acoustic signal may be reached directly from the source, yet not after being reflected from the solid surface.
Free-molecular acoustic pressure in response to a temperature impulse imposed at  $(x_\delta,y_\delta )=(0.5,0.5)$. The impulse and plate locations are marked by a cross and a solid line in each figure, respectively. The results are shown at times
 $t=0.1$ (a,b),
 $t=0.5$ (c,d) and
 $t=1$ (e,f). Panels (a,c,e) present the specular-plate field and panels (b,d,f) are for an isothermal-plate configuration. The dashed lines divide the
 $(x,y)$ plane into domains affected by the impulse but not by the plate (zone I), obscured by the plate (zone II) and affected by both impulse and plate (zone III).

At the earliest  $t=0.1$ time presented in figure 2(a,b), the interaction of the acoustic perturbation with the plate is negligible. Consequently, there are no visible differences between the specular-plate (in figure 2a) and diffuse-plate (figure 2b) system responses, where the perturbation propagates isotropically in the radial direction away from
 $(x_\delta,y_\delta )=(0.5,0.5)$. The acoustic pressure peaks at a dimensional distance
 $U^*_{{mp}}t^*$ from the initial source location, in line with the mean propagation speed
 $\sim U^*_{{mp}}$ of perturbations in the free-molecular regime.
Following to the later  $t=0.5$ time snapshot in figure 2(c,d), the interaction between the acoustic disturbance and the plate is clearly seen through the peak pressure forming along the boundary upper side. This interaction is found weaker in figure 2(d), as the acoustic signal energy is partially absorbed by the isothermal plate, in contrast with the specular-wall configuration. In line with free-molecular flow kinematics, the lower plate surface (contained in zone II) is not affected by the perturbation. Notably, the maximum pressure level at
 $t=0.5$ (reaching
 $\approx 0.7$ in figure 2c,d) is considerably lower than at earlier times, in line with the exponential (
 $\sim \exp [-\xi ^2_{x_1}-\xi ^2_{y_{10}}]$) time decay of all fields indicated in (5.4)–(5.10). This trend becomes more pronounced at the latest
 $t=1$ time presented in figure 2(e,f), where the acoustic perturbation turns smaller and more dispersed. Excluding zone II, the differences between zones I and III in figure 2(e) for the specular-plate system are clearly seen, with higher pressure levels appearing in the latter, reflecting the added impact of plate emission. These differences are less visible in the isothermal-wall field in figure 2(f), since the transition between boundary-affected and non-affected zones is more smooth in a diffuse-wall configuration.
To examine the interaction between the acoustic perturbation and the plate surface in more detail, figure 3 focuses on an isothermal-plate set-up and presents the pressure (figure 3a,b) and velocity (figure 3c,d) fields at time  $t=0.5$, when the signal ‘front’ reaches the
 $x=0.5$ plate end. The figure compares between non-uniform temperature (figure 3a,c) and density (figure 3b,d) acoustic excitations.
Effect of acoustic source type on the free-molecular velocity and acoustic pressure fields in an isothermal-plate system: time snapshots at  $t=0.5$ of the pressure perturbation (a,b) and velocity magnitude (c,d) in response to a temperature (a,c) and a density (b,d) impulse imposed at
 $(x_\delta,y_\delta )=(0.5,0.5)$. The impulse and plate locations are marked by a cross and a solid line in each figure, respectively. The dashed lines confine the plane zone obstructed by the plate. The blue solid curves in figure 3(c,d) show the instantaneous flow streamlines.
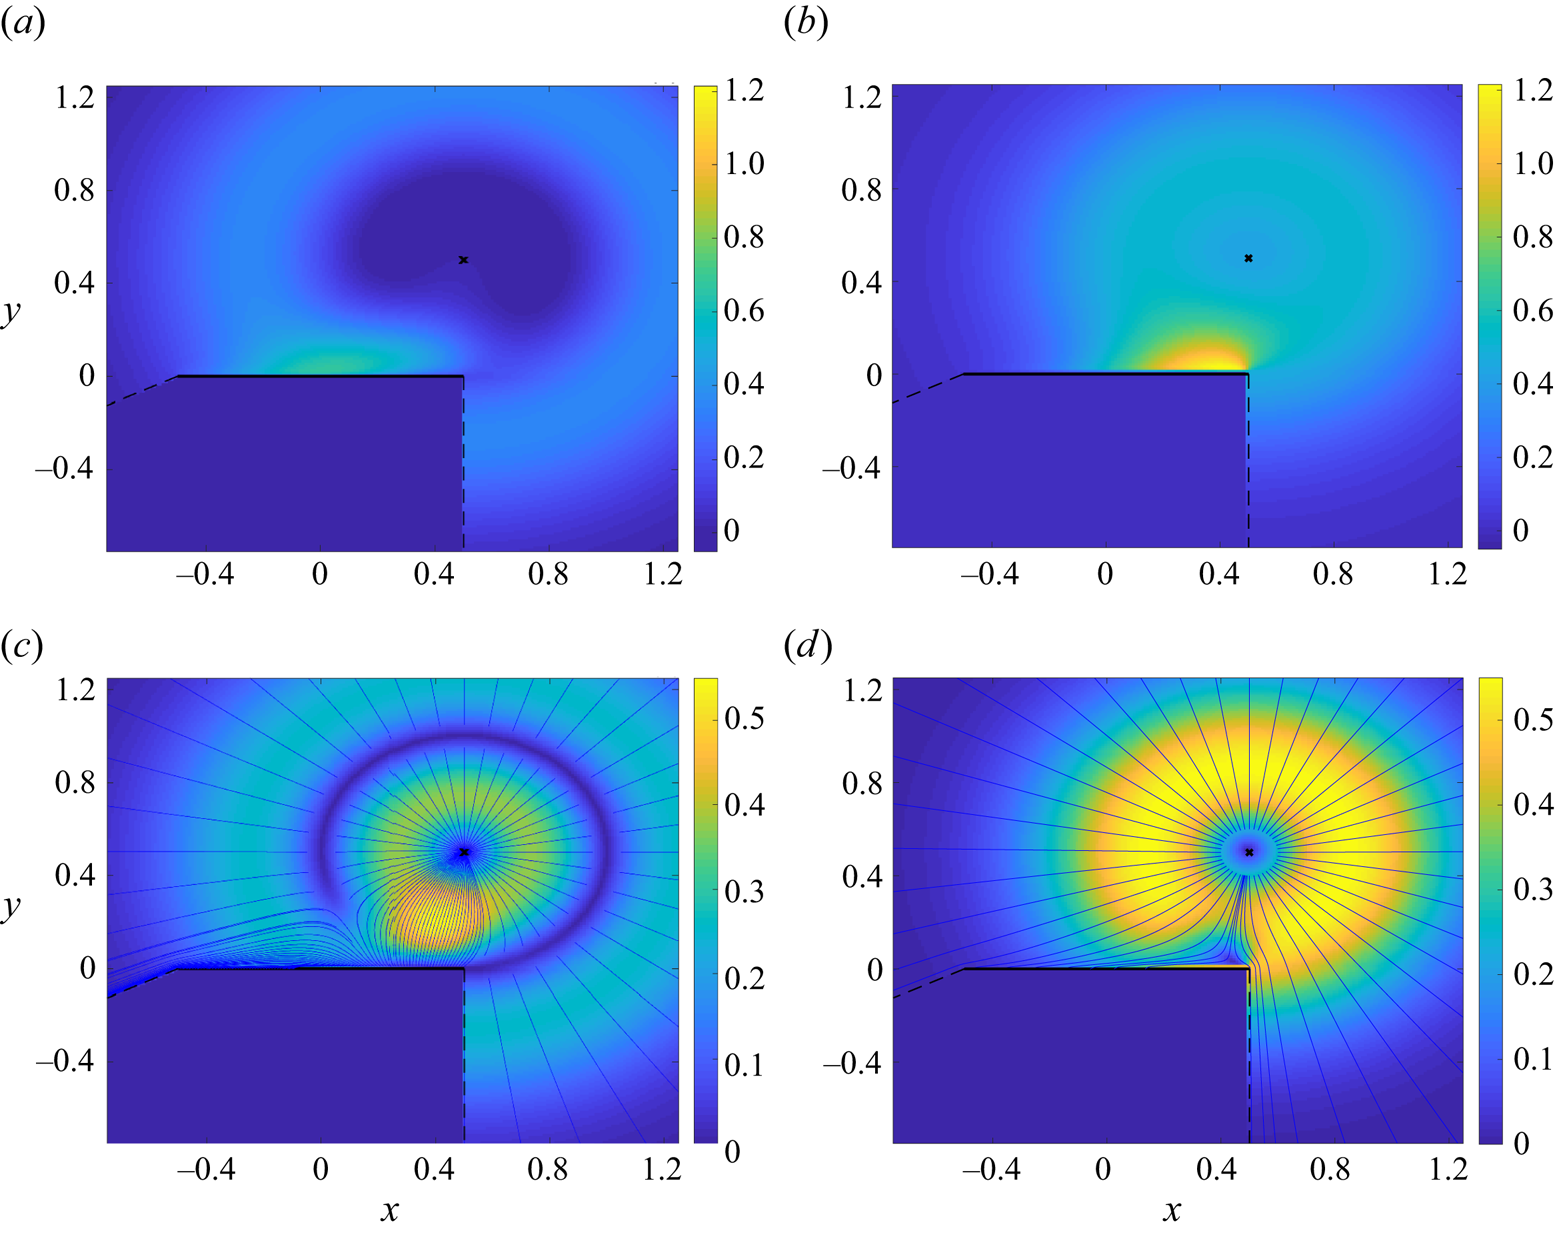
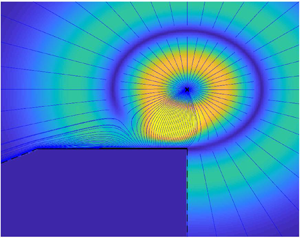
The free-space (in the absence of the plate) system response to density and temperature perturbations follows characteristically different flow patterns. In the former, the acoustic signal propagates in a ‘source-type’ manner, with the velocity streamlines directed radially away from the initial perturbation location. In the latter, local heating serves as an effective ‘sink’, with the acoustic front propagating at the most probable speed, generating radial flow towards and away from  $(x_\delta,y_\delta )$ at scaled distances
 $< t$ and
 $>t$ from
 $(x_\delta,y_\delta )$, respectively. In figure 3(a,b) the free-space patterns are manifested as zones of low and high acoustic pressures in the vicinity of
 $(x_\delta,y_\delta )$, respectively. The interaction of flow perturbation with the solid plate is then viewed as regions of higher pressures along the upper wall surface. The distortion of the free-space flow streamlines near the plate edge is illustrated in figure 3(c,d), where the velocity vector close to the surface
 $(0.5,0)$ end point is directed towards and away from
 $(x_\delta,y_\delta )$ in the density- and temperature-driven set-ups, respectively. These, in turn, are reflected in late-time opposite ‘attraction’ and ‘suction’ forces on the plate, to be discussed below.
The distribution of the acoustic pressure over the upper plate surface ( $-0.5\leq x\leq 0.5,y=0^+$) is presented in figure 4, showing time variations of the free-molecular pressure perturbation at fixed points along the solid boundary. Considering an isothermal-plate system, the figure examines the effects of source type and initial location. Set-ups excited by temperature and density non-uniformities are compared between figures 4(a,c) and 4(b,d), respectively. Maintaining
 $x_\delta =0.5$, the source
 $y$ coordinate is varied between
 $y_\delta =0.5$ in figure 4(a,b) and
 $y_\delta =0.25$ in figure 4(c,d). To track the propagation of the acoustic disturbance in time, the dotted line in each figure marks the locus of maximum pressure values along the plate, indicating the advance and decay of the perturbation front with increasing
 $t$. This follows the propagation of the high-pressure zone along the upper plate surface observed in figures 2 and 3.
Time variations of the free-molecular acoustic pressure at the indicated  $x=0.5,0.2,-0.2$ and
 $-0.5$ locations along the upper part of the plate (
 $y=0^+$). The results are presented for an isothermal-plate system with temperature (a,c) and density (b,d) impulses imposed at
 $(x_\delta,y_\delta )=(0.5,0.5)$ (a,b) and
 $(x_\delta,y_\delta )=(0.5,0.25)$ (c,d). The dotted line in each figure connects the maximum pressure values obtained at each
 $x$ location, which follows the propagation of the acoustic front along the plate.
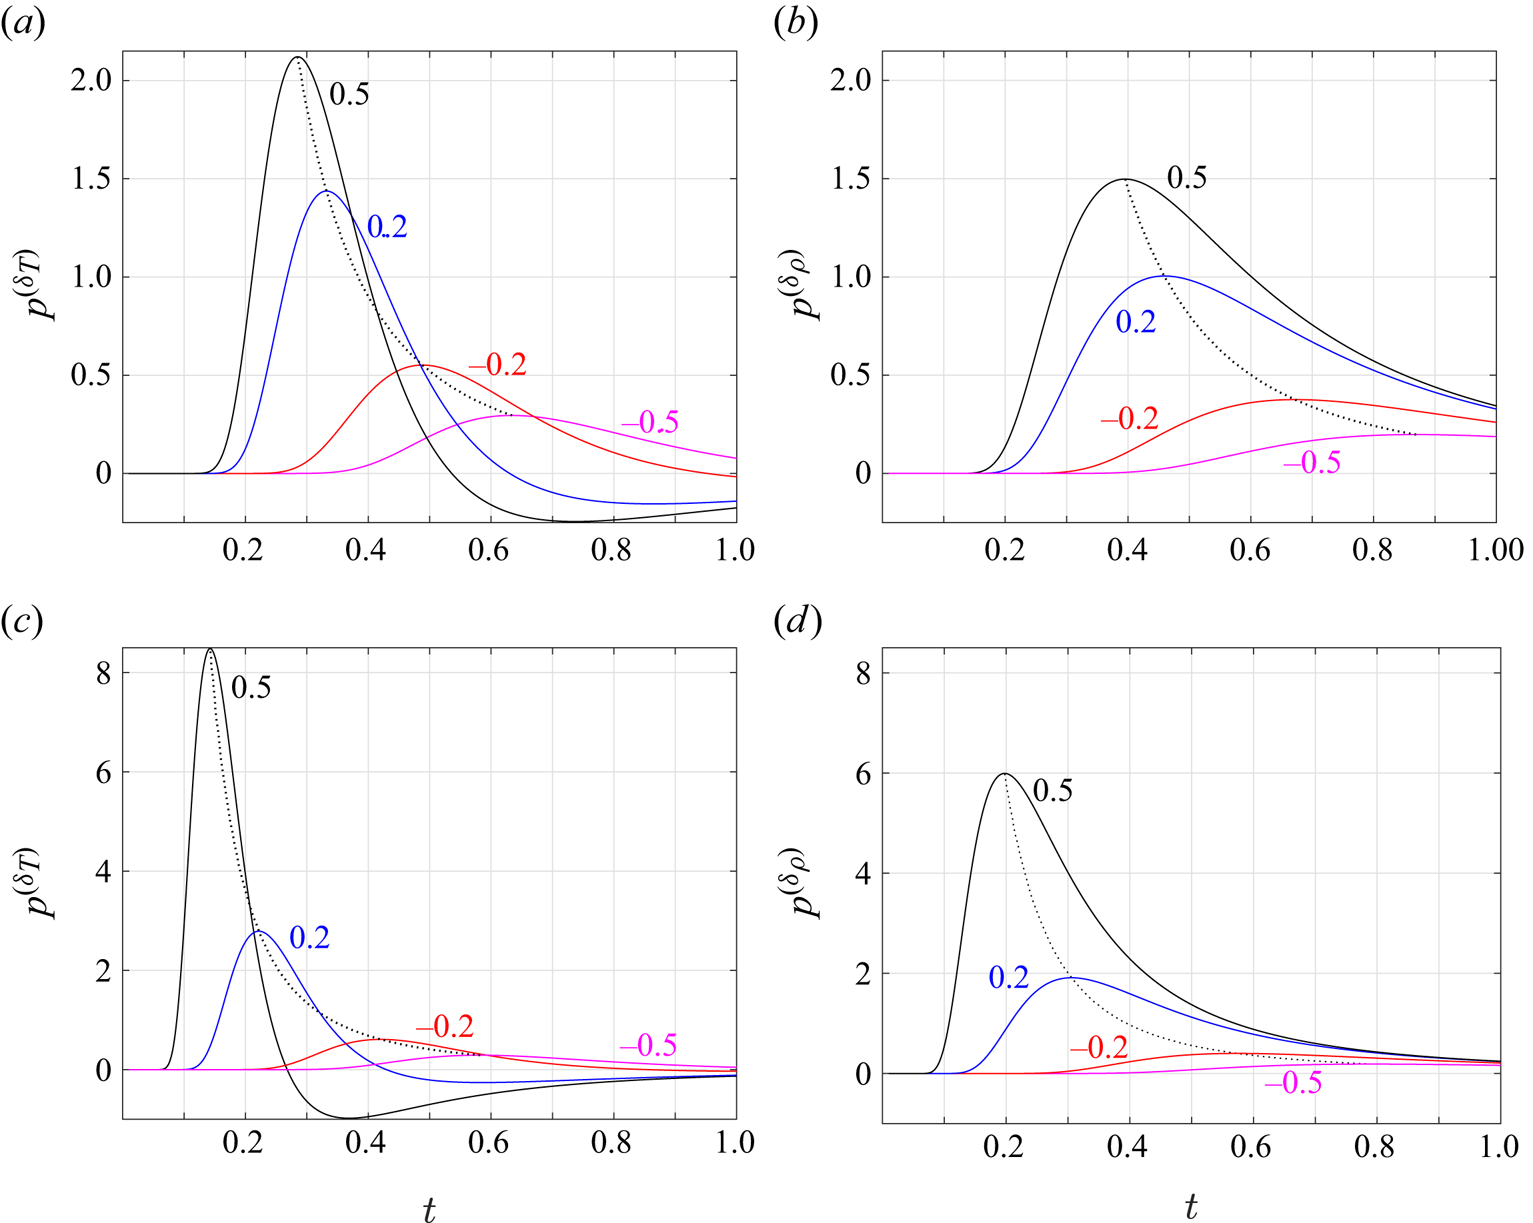
All pressure variations contain an initial time interval during which the acoustic disturbance vanishes. This reflects the time it takes for the signal to reach the plate, being shorter in the case where the source is located closer to the solid boundary (cf. figures 4c,d and 4a,b). Once the perturbation has reached the plate, the pressure increases to its maximum value, after which it decays gradually. While the time decay at each  $x$ location is monotonic in the density-driven case in figure 4(a,c), it varies non-monotonically in the temperature-excited set-up described in figure 4(b,d). The non-monotonic decay, containing a minimum negative acoustic pressure, is in line with the flow field discussed in figure 3(c). Specifically, while creating an early increase in the pressure perturbation due to the initial interaction of the acoustic disturbance with the plate, the ‘sink-like’ propagation in the temperature-excited configuration is characterised by a suction flow field that exhibits a negative pressure fluctuation at the solid surface. This trend is not viewed in the density-excited configuration, where the pressure perturbation is positive at all times. The decrease in the initial distance between the source and the plate has the general effect of magnifying the pressure levels along the plate. Quantitatively, the halving of
 $y_\delta$ between figures 4(a,b) and 4(c,d) results in a pressure increase by a factor of 4, which is supported by the closed-form expressions obtained in § 5.1.
Having discussed the pointwise pressure distribution along the plate, figure 5 presents the time variations of the integral acoustic force on the solid surface. To this end, figures 5(a) and 5(b) show the normal (figure 5a) and shear (figure 5b) loadings on an isothermal boundary in response to temperature (blue lines) and density (black curves) impulses imposed at  $(x_\delta,y_\delta )=(0.5,0.5)$ (solid lines) and
 $(x_\delta,y_\delta )=(0.5,0.25)$ (dashed curves). The plotted results follow from the closed-form expressions in (5.11) and (5.12). In line with the discussion in figure 4, fluid loading on the plate vanishes through an initial time interval, during which the imposed disturbance has not yet reached the solid surface. Once arriving at the plate, the acoustic interaction commences, resulting in an integral force on the boundary. The force acts initially in the negative
 $x$ and
 $y$ directions, extending to a larger maximum magnitude at an earlier time in the case where the impulse is imposed closer to the plate. At late times, both normal and shear forces become positive in the temperature-driven case, marking a suction force on the plate towards the initial source location. In the density-driven set-up,
 $N<0$ and
 $S<0$ invariably, indicating that an integral repelling force is imposed at all
 $t>0$. The shear force is characteristically smaller than the normal loading, yet maintaining a similar order of magnitude. In the case where the impulse is imposed at a position
 $x_\delta$ closer to the plate midchord (not illustrated here for brevity),
 $S$ diminishes. The shear force vanishes identically for
 $x_\delta =0$, due to problem symmetry.
(a,b) Time variations of the acoustic normal (a) and shear (b) forces on an isothermal plate in response to temperature (blue lines) and density (black curves) impulses imposed at  $(x_\delta,y_\delta )=(0.5,0.5)$ (solid lines) and
 $(x_\delta,y_\delta )=(0.5,0.25)$ (dashed curves). (c,d) The
 $x$ variations of the normal
 $P_{yy}$ (c) and shear
 $P_{xy}$ (d) stresses along the upper part of the isothermal plate in response to a temperature impulse imposed at
 $(x_\delta,y_\delta )=(0.5,0.5)$ at the indicated time instants. The circles in figures 5(a) and 5(b) denote the times along the normal- and shear-force curves at which the normal and shear stress distributions are plotted in figures 5(c) and 5(d), respectively.

In line with (3.21a,b),  $N$ and
 $S$ are calculated via quadratures of the negative sign of the normal and shear stresses over the plate upper surface. To gain further insight into the results in figures 5(a) and 5(b), figures 5(c) and 5(d) present the distributions of
 $P_{yy}$ and
 $P_{xy}$, respectively. Focusing on a temperature-driven set-up with
 $(x_\delta,y_\delta )=(0.5,0.5)$, the
 $x\in [-1/2,1/2]$ variations of
 $P_{yy}$ (in figure 5c) and
 $P_{xy}$ (in figure 5d) at
 $y=0^+$ are shown in black at the time instant when the repelling force amplitude is maximal. Additionally, the stress distributions at
 $t=0.99$, when both force components are positive, are shown in red, and the blue curves denote the stress variations at an intermediate time
 $t=0.55$.
Starting with the black curves, the strong interaction of the acoustic front with the plate is reflected as relatively sharp maxima in both  $P_{yy}$ and
 $P_{xy}$ along the
 $0< x<0.5$ half of the plate. At the later
 $t=0.55$ presented, the wave-like distribution propagates to lower
 $x$ values, while reducing in magnitude. Simultaneously, a zone where both stresses turn negative appears close to the
 $x=0.5$ edge, indicating the creation of the ‘suction’ field developed at later times. At
 $t=0.99$, the stresses turn negative almost invariably, resulting in the positive values of
 $N$ and
 $S$ marked in figures 5(a) and 5(b) by the red circles. The overall trends found in figures 5(c) and 5(d) agree with the time variations found for the pressure along the plate, discussed in figure 4.
We make use of the impulse-response set-up to examine the applicability of acoustic reciprocity at free-molecular conditions. Towards this end, figure 6 presents time variations of the acoustic pressure (figure 6a) and density (figure 6b) fields in response to a temperature impulse imposed at the indicated  $(x_\delta,y_\delta )$ locations. The blue and red curves mark the results calculated at points
 $(0,0.1)$ and
 $(0.2,1)$, respectively, in an isothermal-plate system. The dashed curves present the counterpart pressure and density variations in a specular-wall system, where the source and listener are located at
 $(0,0.1)$ and
 $(0.2,1)$, respectively, or interchanged.
Acoustic non-reciprocity in a diffuse-plate system: time variations of the acoustic pressure (a) and density (b) in response to a temperature impulse imposed at the indicated  $(x_\delta,y_\delta )$ locations. The red lines show the pressure and density calculated at
 $(x,y)=(0.2,1)$ in the case where the impulse is imposed at the indicated
 $(x_\delta,y_\delta )=(0,0.1)$. The blue curves present the pressure and density calculated at
 $(x,y)=(0,0.1)$ in the case where the impulse is set at
 $(x_\delta,y_\delta )=(0.2,1)$. The dashed lines depict the counterpart variations in a specular-wall system where the source and listener are located at
 $(0,0.1)$ and
 $(0.2,1)$, respectively, or vice versa.

Considering the specular-system time response, we observe that the acoustic fields remain unchanged when the source and listener are replaced, indicating that acoustic reciprocity holds. This is in line with the smooth-boundary wall condition, where no transfer of energy occurs between the gas and the surface. The particles are emitted in a mirror-like reflection, and symmetry is preserved when replacing between the impulse and observer positions. At the macroscopic level of description, specular-wall conditions impose impermeability over the solid wall, while other hydrodynamic fields are left undetermined. In a sense, this is equivalent to the inviscid (ideal compressible flow) limit of  ${Kn}\rightarrow 0$, where thermal and no-slip conditions cannot be imposed at a boundary. Consequently, acoustic reciprocity holds in both scenarios, as applicable in continuum linear acoustics (Howe Reference Howe1998; Pierce Reference Pierce2019).
Traversing to the isothermal-wall case, we note that acoustic reciprocity does not hold. This observation is supported by both pressure and density scalar perturbations, which are considered for the present inspection. Specifically, starting at  $t\approx 0.4$ and following to later times, significant differences are viewed between the measured quantities, marked by the blue and red curves. Different from the specular-wall set-up, diffuse-wall conditions model relatively ‘rough’ surfaces, where each colliding particle transfers momentum and energy with the solid surface to attain thermal equilibrium with its reflecting wall. This introduces distinct asymmetry between a source and a listener that are placed at different distances from the wall, particularly at free-molecular conditions, where wall information is carried undisturbed by particles emitted from the surface. Indeed, at early times (
 $t\lesssim 0.4$), when wall reflection of the acoustic disturbance has not yet reached the observer, the blue and red curves are nearly identical. The observed discrepancies at later times are directly attributed to the combined impacts of gas–wall interactions and asymmetry in the trajectories of particles reflected from the boundary to different locations in the gas. In essence, the mechanism driving acoustic non-reciprocity in the present set-up is similar to that mentioned in counterpart continuum-limit studies (Fleury et al. Reference Fleury, Sounas, Haberman and Alú2015; Heo et al. Reference Heo, Walker, Zubov, Shymkiv, Wages, Krokhin, Choi and Neogi2020; Nassar et al. Reference Nassar, Yousefzadeh, Fleury, Ruzzene, Alú, Daraio, Norris, Huang and Haberman2020), coupling geometrical considerations with fluid viscosity. Yet, while viscous effects are commonly confined to the very vicinity of solid walls at high Reynolds (with low Knudsen) number gas flows, they affect wider portions of the flow field in the absence of molecular interactions, causing non-reciprocity to become apparent.
Summarising the above, we find that acoustic reciprocity at non-continuum conditions breaks down in the presence of non-smooth surfaces. Taking the diffuse-wall model as an extreme set-up of a rough wall, non-reciprocal effects are expected to be stronger with increasing Knudsen numbers, as the mitigating impact of intermolecular collisions weakens and the asymmetry caused by particle–surface interactions is carried over larger distances from the wall. These observations are further illustrated in the next section (see figure 10 et seq.), where the system response to Gaussian excitation is analysed.
6. Gaussian excitation
While the free-molecular system response to an impulse could be analysed in detail, counterpart DSMC realisation of a delta-function source is numerically ambiguous. To facilitate DSMC calculations, we therefore consider a continuous Gaussian excitation input of either the density or the temperature,
 \begin{align}\begin{aligned}
\rho_{{in}}(x,y)&=\exp[-\alpha((x-x_G)^2+(y-y_G)^2)] \quad
\mathrm{or} \\ T_{{in}}(x,y) &=
\exp[-\alpha((x-x_G)^2+(y-y_G)^2)],\end{aligned}
\end{align}
marking a smooth signal peaked at  $(x,y)=(x_G,y_G)$. A value of
 $\alpha =80$
 $(\gg 1)$ with
 $y_G>0$ is taken to mimic a localised excitation at the upper half-plane that decays sharply about its peak and does not interact with the plate at
 $t=0^+$. The Gaussian distribution, which is related to the above-studied impulse perturbation via the limit
 $\delta (s)=\lim _{\alpha \rightarrow \infty }\sqrt {\alpha /{\rm \pi} }\exp [-\alpha s^2]$, is also considered to test acoustic reciprocity at various Knudsen numbers. In what follows, the free-molecular gas response is calculated and compared with DSMC predictions at finite Knudsen numbers, to test its applicability and breakdown. Based on the scaling introduced in § 2, the expected flow regime should be governed by the ratio between the Knudsen number and the time elapsed since the initiation of flow disturbance. Strictly, free-molecular flow conditions should prevail at
 $t/{Kn}\ll 1$ and break down with increasing
 $t/{Kn}$. At
 $t/{Kn}\gg 1$, the continuum flow regime should hold. To make the presentation concise, our results focus on the case of thermal system excitation with isothermal-plate conditions. Results for the case of density perturbation and specular-plate set-ups were added as supplementary material, available at https://doi.org/10.1017/jfm.2024.1003, yet are skipped in the main text as they do not provide additional insight.
Figure 7 presents the effect of gas rarefaction on the isothermal-plate system response to a Gaussian temperature excitation peaked at  $(x_G,y_G)=(0.5,0.5)$. The figure shows time snapshots of the density perturbation at time
 $t=0.5$ and descending Knudsen numbers, including the free-molecular (
 ${Kn}\rightarrow \infty$) field and
 ${Kn}=10,1,0.1,0.05$ and
 $0.01$ results. The non-infinite Knudsen number plots are based on DSMC computations.
Effect of gas rarefaction on the isothermal-plate system response to a Gaussian temperature excitation peaked at  $(x_G,y_G)=(0.5,0.5)$ with
 $\alpha =80$: density perturbations at time
 $t=0.5$ with (a)
 ${Kn}\rightarrow \infty$, (b)
 ${Kn}=10$, (c)
 ${Kn}=1$, (d)
 ${Kn}=0.1$, (e)
 ${Kn}=0.05$ and (f)
 ${Kn}=0.01$. The results in (a) are based on the free-molecular solution and in (b–f) present DSMC data. The dashed lines in each figure confine the plane zone obstructed by the plate in the free-molecular regime for an instantaneous point source located at
 $(x,y)=(0.5,0.5)$. The crosses denote the Gaussian peak location and the thick solid lines mark the plate position.
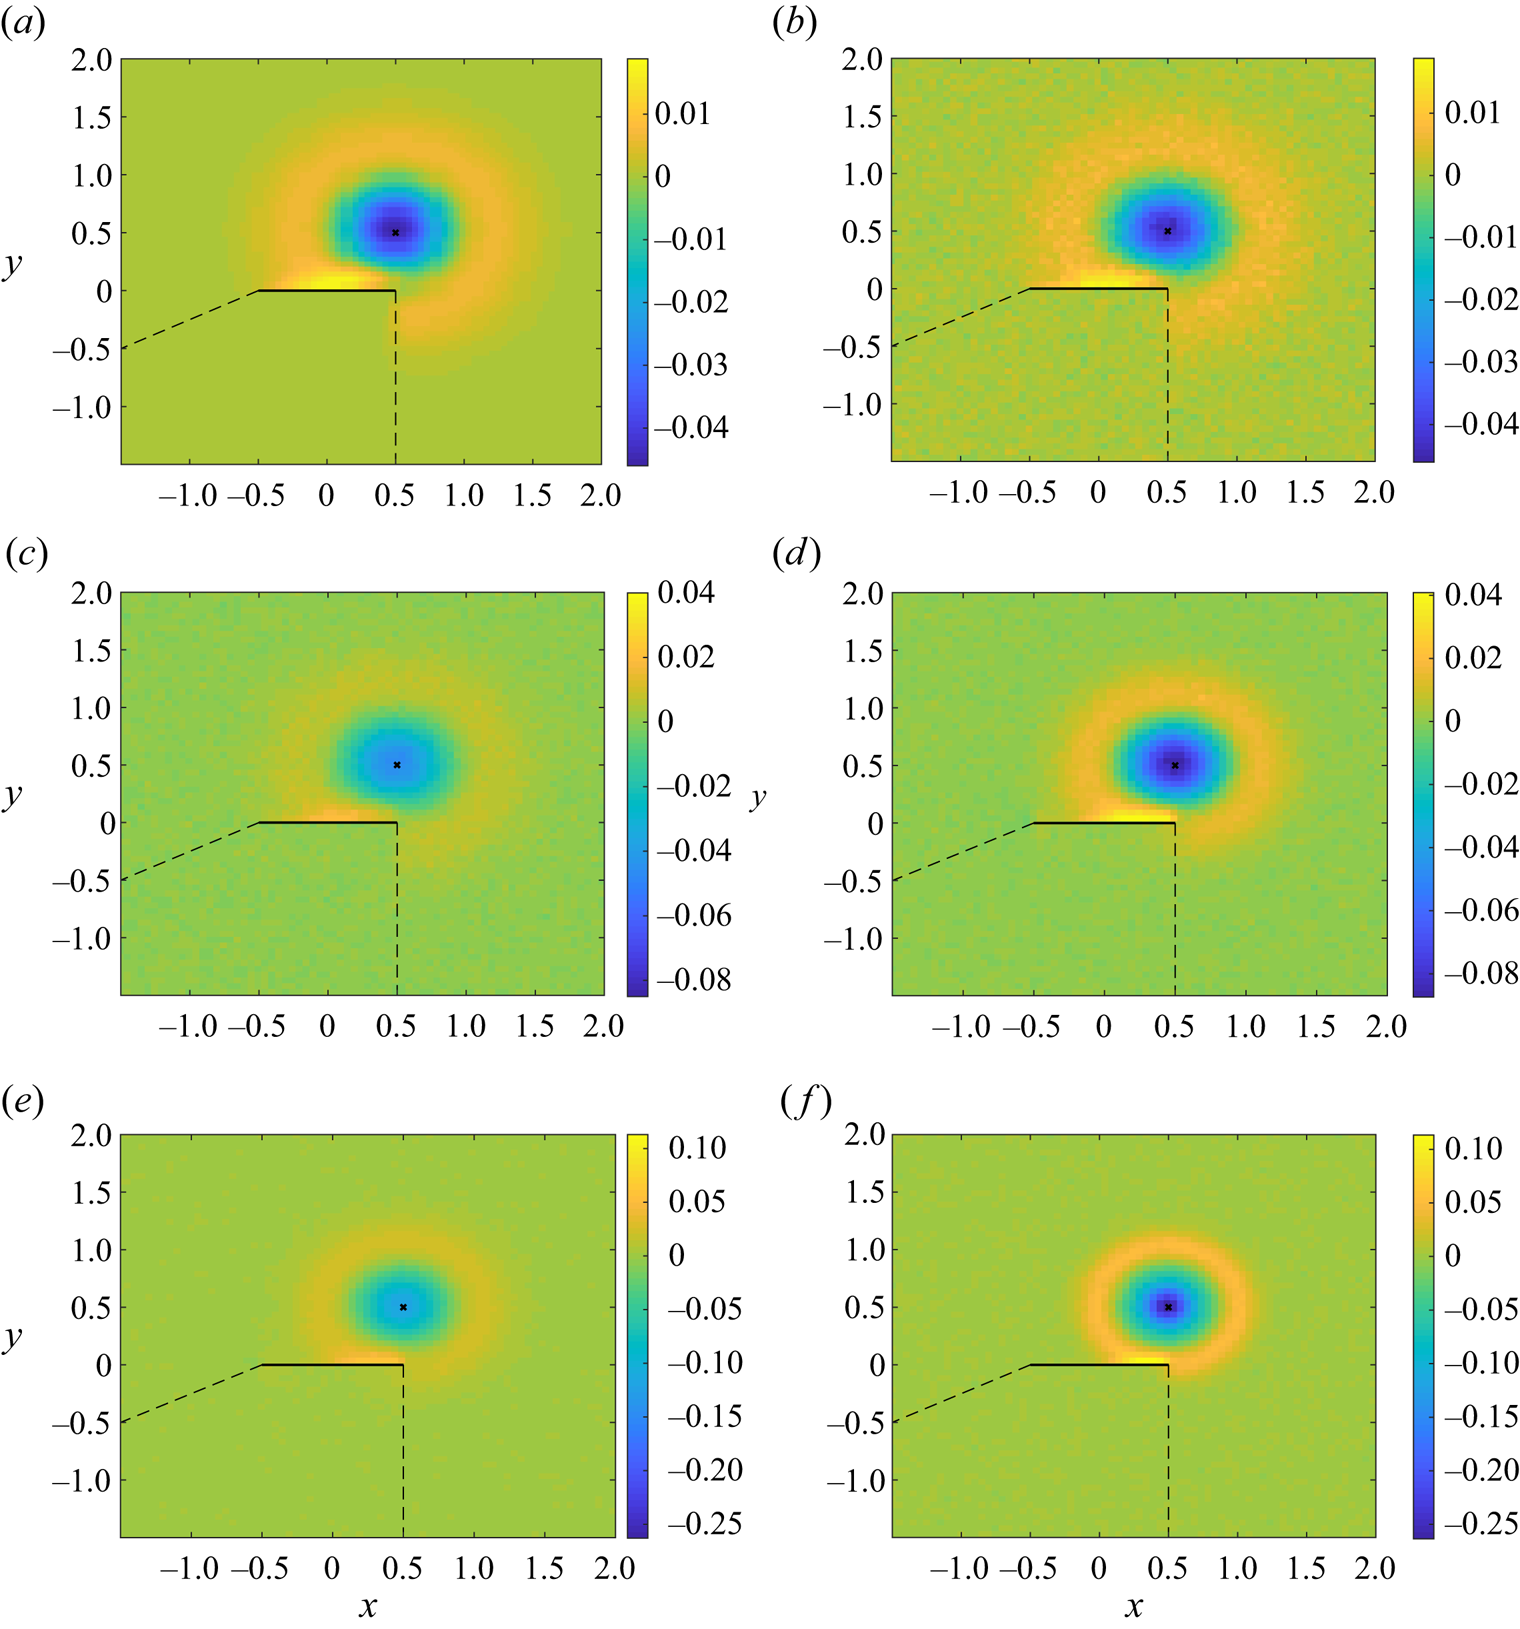
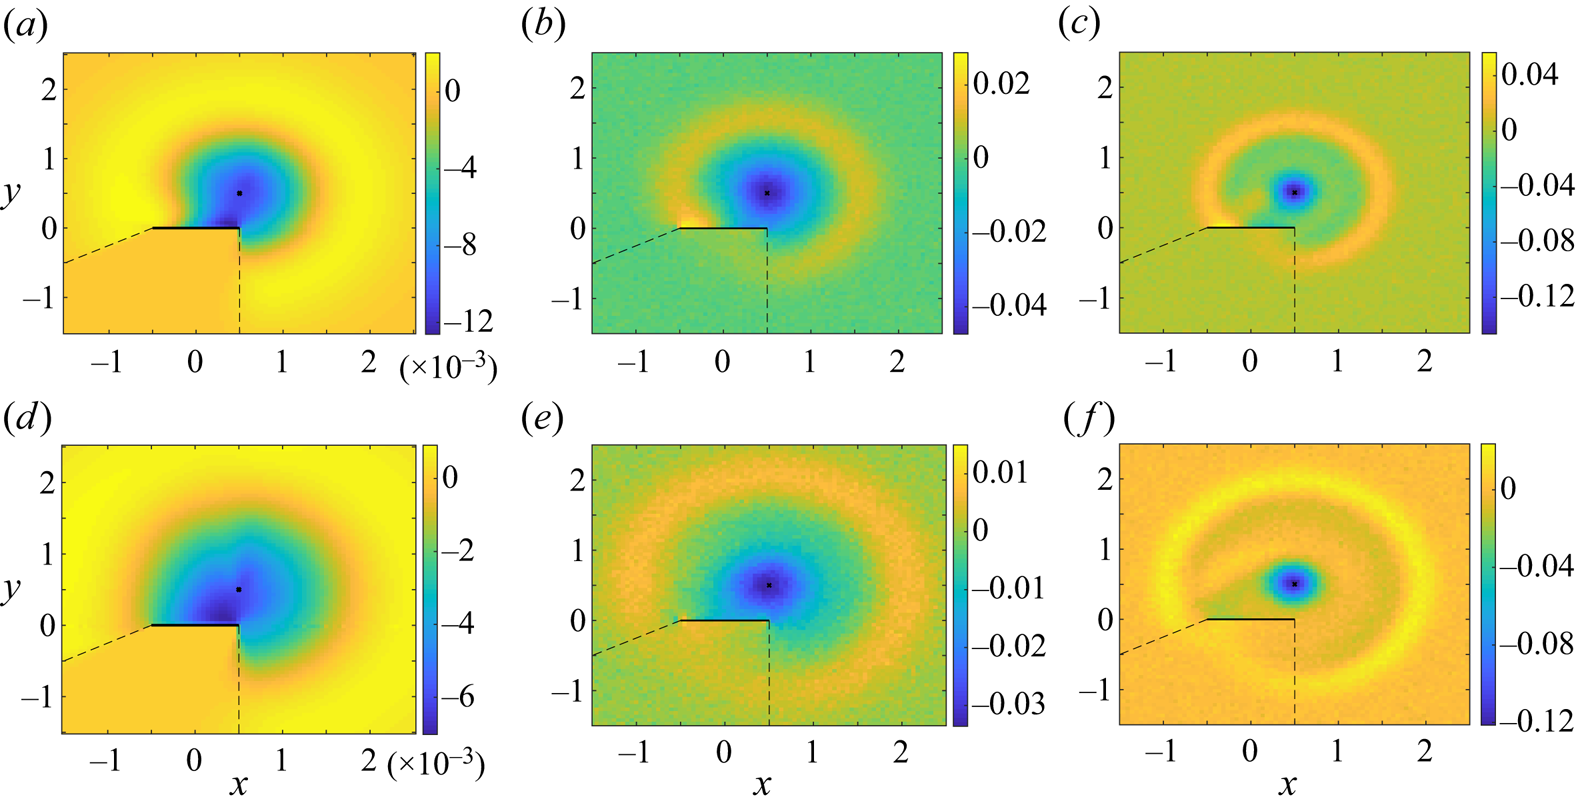
Comparing between figures 7(a) and 7(b), we find that the free-molecular and  ${Kn}=10$ fields are practically identical, exhibiting the same hydrodynamic pattern and perturbation level. Different from the smooth analytical result in figure 7(a), and in view of the relatively low
 $O(10^{-2})$ perturbation level, the signal-to-noise ratio in the simulation is not large and the DSMC output in figure 7(b) is relatively scattered. Notably, the density perturbation remains nearly unchanged also in the
 ${Kn}=1$ case shown in figure 7(c) (where
 $t/{Kn}=0.5$), indicating that the free-molecular regime persists through
 $t/{Kn}\lesssim O(1)$ (cf. the results in figure 9). The difference in colour spread between figures 7(a,b) and 7(c) is merely due to the different colour range depicted to facilitate comparison between figures 7(c) and 7(d) for
 ${Kn}=0.1$. Maintaining the same
 $[-0.085,0.04]$ scale range, we observe that the free-molecular description breaks down by passing between
 $t/{Kn}=0.5$ (for
 ${Kn}=1$) and
 $t/{Kn}=5$ (for
 ${Kn}=0.1$). This is visualised through the considerable increase in the perturbation magnitude combined with the more focused propagation pattern in figure 7(d). These are in line with previous studies on the propagation of acoustic disturbances in the free-molecular and continuum limits, indicating that the decay rate of the latter is typically much lower than the exponential decay characterising collisionless sound emission (Kalempa & Sharipov Reference Kalempa and Sharipov2009; Manela & Ben-Ami Reference Manela and Ben-Ami2021, Reference Manela and Ben-Ami2023). With increasing field magnitude, the computational signal-to-noise ratio rises, yielding a smoother result. The above trends become more pronounced at the near-continuum
 ${Kn}=0.05$ and
 ${Kn}=0.01$ conditions presented in figures 7(e) and 7(f), respectively, where the propagating disturbance decays slower and retains its thin-circular form through later times.
Considering the interaction between the propagating disturbance and the plate in figure 7, we observe that the gas zone obstructed by the plate for a counterpart point source imposed at  $(x,y)=(0.5,0.5)$ is nearly unaffected by the present acoustic disturbance at non-small Knudsen numbers. Yet, a slight effect is visible to the left of the
 $x=0.5$ dashed line even for
 ${Kn}\rightarrow \infty$, as the excitation signal considered herein is a smoothly varying Gaussian and not a point impulse. With increasing
 $t/{Kn}$ towards continuum conditions, it is expected that the disturbance bypasses the plate and penetrates the ‘obstructed’ zone to a larger extent. Physically, this is attributed to the effect of intermolecular collisions, missing at highly rarefied conditions, transferring momentum and energy between gas particles at non-small
 $t/{Kn}$ numbers. This phenomenon is illustrated in figure 8, showing the system response to the same
 $(x_G,y_G)=(0.5,0.5)$ Gaussian disturbance as in figure 7, yet at times later than
 $t=0.5$, corresponding to higher
 $t/{Kn}$ values. Specifically, figures 8(a–c) and 8(d–f) compare between the density perturbation fields obtained at times
 $t=1$ and
 $t=1.5$, respectively, with
 ${Kn}\rightarrow \infty$ (in figure 8a,d),
 ${Kn}=0.05$ (in figure 8b,e) and
 ${Kn}=0.01$ (in figure 8c,f). Noting the variations in colour map grid scales, we observe again the large differences in perturbation magnitudes between the collisionless and continuum limits, manifesting the higher decay rate of the former. Distinctly, while the dashed-line confined zone is practically quiescent in figure 8(a,d), the mechanism of molecular collisions results in the propagation of the imposed disturbance into the obstructed area. This, together with the retained ‘focused’ form of the disturbance at late times, form the primary differences between the system response in the continuum and ballistic limits.
Time evolution of the system response to a Gaussian temperature excitation peaked at  $(x_G,y_G)=(0.5,0.5)$ with
 $\alpha =80$: density perturbations in an isothermal-plate set-up at times
 $t=1$ (a–c) and
 $t=1.5$ (d–f) with
 ${Kn}\rightarrow \infty$ (a,d),
 ${Kn}=0.05$ (b,e) and
 ${Kn}=0.01$ (c,f). Panels (a,d) are based on the free-molecular solution and all other results are obtained via DSMC calculations. The crosses denote the peak location of the initial perturbation and the thick solid lines mark the plate position. The dashed lines confine the plane zone obstructed by the plate in the free-molecular regime for a point source imposed at
 $(x,y)=(0.5,0.5)$.
The effect of gas rarefaction on the acoustic force imposed on the plate is considered in figure 9. Keeping  $(x_G,y_G)=(0.5,0.5)$, the solid curves in figures 9(a) and 9(b) present the free-molecular normal- and shear-force components, respectively, and the symbols denote counterpart DSMC data at the indicated Knudsen numbers. The free-molecular results indicate similar trends to those discussed in figures 5(a) and 5(b) for an impulse signal, yet with expectedly lower magnitudes. As in figure 7, the free-molecular and
 ${Kn}=1$ DSMC predictions largely agree, indicating that the collisionless regime prevails through
 $t/{Kn}\lesssim O(1)$. With decreasing
 ${Kn}$, the maximum magnitude of the normal force increases, while the shear component reduces. The peak location shifts to later times in both cases.
Effect of gas rarefaction on the time variation of the acoustic normal (a) and shear (b) forces on an isothermal plate in response to a Gaussian temperature perturbation peaked at  $(x_G,y_G)=(0.5,0.5)$ with
 $\alpha =80$. The solid lines present the free-molecular result (
 ${Kn}\rightarrow \infty$) and the symbols mark DSMC data at the indicated values of
 ${Kn}$. The dashed curves depict the
 $N=0$ and
 $S=0$ lines for reference.
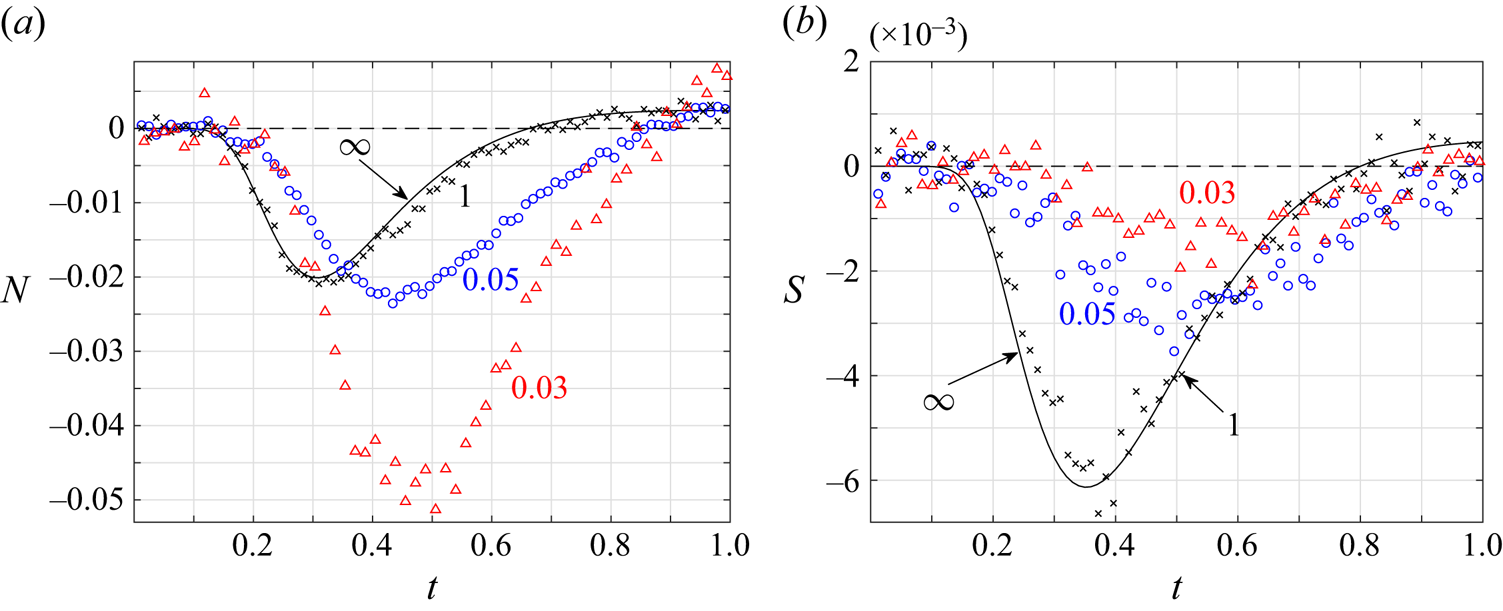
The wall acoustic interaction is expected most intense when the signal ‘front’, initially peaked at  $(x_G,y_G)=(0.5,0.5)$, reaches the plate
 $(0.5,0)$ edge. At continuum conditions, this should occur at time
 $t=0.5\sqrt {2/\gamma }=0.5\sqrt {6/5}\approx 0.548$ in most-probable-speed time units. This value, common for both temperature and density excitations at
 ${Kn}\ll 1$, is indeed approached in figure 9(a) with decreasing
 ${Kn}$. Traversing to the free-molecular regime and starting with the density-driven case, the results in figure 5 (see the black solid lines in figure 5a,b) show that the maximum force amplitude occurs at
 $t\approx 0.5$, in agreement with the propagation of sound in the most probable speed at
 ${Kn}\gg 1$. The counterpart value in the temperature-excited case is lower, as depicted by the blue solid lines in figures 5(a) and 5(b) and by the solid curves in figure 9. This decrease is attributed to the effect of higher-order moments that travel faster in the collisionless limit for thermal perturbations, as discussed in Ben-Ami & Manela (Reference Ben-Ami and Manela2020b). Notably, the time instants for maximal free-molecular normal- and shear-force amplitudes in figures 9(a) (
 $t\approx 0.31$) and 9(b) (
 $t\approx 0.35$), respectively, are close to their impulse-response counterparts in figures 5(a) and 5(b), respectively (cf. the blue solid lines therein). We may consequently rely on the closed-form expressions for these forces, derived in (5.11) and (5.12), to quantitatively predict the times of maximum magnitudes.
We conclude the discussion by illustrating the effect of gas rarefaction on the applicability of acoustic reciprocity. To this end, figure 10 presents time variations of the pressure perturbation in response to a Gaussian temperature source imposed at interchanged locations. Specifically, the blue curves show  $p(t)$ at
 $(x,y)=(0,0.25)$ for a source peaked at
 $(x_G,y_G)=(0,1)$. Reciprocity is tested via comparison with the calculated
 $p(t)$ at
 $(x,y)=(0,1)$ for a source peaked at
 $(x_G,y_G)=(0,0.25)$, marked by the red lines. The results are presented at highly rarefied (free molecular and DSMC
 ${Kn}=10$ in figure 10a) and continuum-limit (DSMC calculated
 ${Kn}=0.01$ in figure 10b) conditions. While the present Gaussian-response analysis is different from the impulse-signal discussion carried out in § 5.2 (and is therefore less suitable for the study of reciprocity), the results clearly indicate that acoustic reciprocity, holding at continuum conditions, breaks down with increasing rarefaction. This is viewed through the departure between the blue and red curves and symbols in figure 10(a), initiating at
 $t\approx 0.55$, and missing in figure 10(b). Starting at the noted time instance, acoustic non-reciprocity at non-continuum conditions is driven by the effect of isothermal-wall reflection, reaching the different observers at different times after wall emission, and missing the mitigating impact of molecular collisions that otherwise permit reciprocal symmetry.
Effect of gas rarefaction on acoustic reciprocity in a diffuse-plate system: time variations of the pressure perturbation in response to a Gaussian temperature excitation with  $\alpha =80$ peaked at the indicated
 $(x_G,y_G)$ locations. The blue curves show the acoustic pressure calculated at
 $(x,y)=(0,0.25)$ with the Gaussian peaked at
 $(x_G,y_G)=(0,1)$, and the red curves present the pressure at
 $(x,y)=(0,1)$ with the Gaussian centred at
 $(x_G,y_G)=(0,0.25)$. Panel (a) depicts free-molecular and DSMC
 ${Kn}=10$ results in solid lines and symbols, respectively. Panel (b) presents DSMC predictions at
 ${Kn}=0.01$.

7. Conclusion
We investigated the effect of gas rarefaction on the interaction of small thermodynamic non-uniformities with a finite body. Considering a two-dimensional set-up, the initial system perturbations were modelled as small-amplitude density or temperature inhomogeneities, prescribed in the vicinity of a thin impermeable plate. The problem was analysed in the free-molecular limit and complemented by DSMC computations to cover the entire range of gas rarefaction rates. The high-Knudsen ‘sink-like’ and ‘source-like’ propagation patterns observed in the density- and temperature-driven set-ups, respectively, were discussed, together with the impact of specular (smooth) and diffuse (isothermal) wall reflections. At highly rarefied conditions, the solid body obstructs part of the gas domain, preventing the propagation of acoustic disturbances through the concealed zone. With decreasing gas rarefaction, the acoustic field penetrates the obscured area and the disturbance is transferred therein via molecular interactions. Focusing on the near-field description, the propagation of flow perturbation along the plate surface was inspected, and the normal and shear forces on the body were computed. In the highly rarefied thermally excited case, both force components change sign at late times, acting to attract the plate towards the initial perturbation location in line with the flow sink-like characteristics. With reducing gas rarefaction, the shear force on the plate diminishes and the normal force sharply increases due to the decreased decay rate of the propagating disturbance. Finally, we applied our analysis to study the impact of gas rarefaction on acoustic reciprocity. We found that acoustic reciprocity does not hold at non-continuum conditions over non-specular surfaces, where boundary reflections propagate through the gas in the presence of few molecular collisions, insufficient to retain reciprocal symmetry.
Our work focuses on the case of a monatomic gas interacting with a solid surface. Yet, the more complex case of a polyatomic gas, where molecular internal degrees of freedom turn effective, is of interest and deserves separate attention. Since the inclusion of vibrational and rotational modes of motion lead to a more complex dependence of acoustic attenuation on the wave frequency (Arima, Ruggeri & Sugiyama Reference Arima, Ruggeri and Sugiyama2017; Kustova et al. Reference Kustova, Mekhonoshina, Bechina, Lagutin and Voroshilova2023; Li, Su & Zhang Reference Li, Su and Zhang2023), we expect them to significantly affect the flow field generated by the excited broad-spectrum (impulse and Gaussian) perturbations. Specifically, it is plausible that boundary conditions that preserve the energy of the molecular vibration and rotation modes (as well as the translation speed) should satisfy reciprocity at free-molecular conditions, while diffuse conditions would not. Additionally, since sound attenuation is scaled with the Knudsen number in the continuum limit, it is anticipated that polyatomic gases satisfy reciprocity in this regime, in line with continuum theory. Longer relaxation times of the vibration and rotation modes (leading to higher gas viscosities) should result in growing deviation from reciprocity with increasing Kn.
Rigorous treatment of the problem at arbitrary rarefaction rates requires analysis of the two-dimensional unsteady Boltzmann equation, which is formidably challenging. Advantageously, the DSMC method could be applied in the present work up to sufficiently low rarefaction rates, to capture the system behaviour in the transition and continuum limits. This replaced the utilisation of near-continuum schemes, such as the Navier–Stokes–Fourier slip flow and higher-order hydrodynamic models, that should have been tackled numerically in the current set-up. A desired extension of the present investigation would be an asymptotic analysis of the near-free-molecular problem. In particular, the consideration of low yet finite  $t/{Kn}$ values may provide valuable insight into the effect of slight molecular collisions on acoustic scattering at a solid edge. This, together with the investigation of the counterpart nonlinear problem, where large initial deviations from equilibrium are considered, constitute topics for future study.
Supplementary material
Supplementary material are available at https://doi.org/10.1017/jfm.2024.1003.
Declaration of interest
The authors report no conflict of interest.
Appendix A. The acoustic field in the free-molecular limit
Appendix A details the acoustic-field perturbations in the free-molecular limit for the cases of isothermal (iso) and specular (spec) plate systems. The tabulation is split into expressions valid in the upper ( $y>0$, § A.1) and lower (
 $y<0$, § A.2) half-planes, following the assumption that the initial perturbation is confined to the former.
A.1. Upper half-plane
Focusing on the  $\xi _x$ and
 $\xi _y$ quadratures in (3.16) and carrying the changes of variables
 $x_r=x-(\xi _x/\xi _y)y$ (see (3.9)) between
 $\xi _x$ and
 $x_r$, and
 $t_r=t-y/\xi _y$ (see (3.10a,b)) between
 $\xi _y$ and
 $t_r$, we denote, for the isothermal-wall calculation,
 \begin{align} I^{{(iso)}}_{m,n}(t,x,y>0)&=\frac{y^{n+1}}{\rm \pi}\int_0^{t}\frac{1}{(t-t_r)^{m+n+3}} \int_{{-}1/2}^{1/2}\rho_w^+(t_r,x_r)(x-x_r)^m\nonumber\\ &\quad \times \exp\left[-\frac{y^2}{(t-t _r)^2}\left(1+ \left(\frac{x-x_r}{y}\right)^2\right)\right]\, \mathrm{d}\kern0.7pt x_r\,\mathrm{d} t_r . \end{align}
For the counterpart specular-plate set-up, we set (see (3.4))
 \begin{align} I^{{(spec)}}_{m,n}(t,x,y>0)&=\frac{1}{{\rm \pi}^{3/2}} \int_{-\infty}^{\infty}\int_{y/t}^{\infty} \int_{(({x-1/2})/{y})\xi_y}^{(({x+1/2})/{y})\xi_y} \phi_{{in}}(x_{{in}},y_{{spec}},\boldsymbol{\xi}) \xi_x^m\xi_y^n\nonumber\\ &\quad \times\exp[-\xi_x^2-\xi_y^2-\xi_z^2]\, \mathrm{d}\xi_x\,\mathrm{d}\xi_y\,\mathrm{d}\xi_z . \end{align}
Additionally, we introduce
 \begin{align}& J_{m,n}(t,x,y>0)=\frac{1}{\rm \pi}\int_{-\infty}^{0}\int_{-\infty}^{\infty}
\xi_x^m\xi_y^n
[\rho_{{in}}(x_{{in}},y_{{in}})+T_{{in}}(x_{{in}},y_{{in}})
(\xi_x^2+\xi_y^2-1)]\nonumber\\ &\quad \times
\exp[-\xi_x^2-\xi_y^2]\,\mathrm{d}\xi_x\,\mathrm{d}\xi_y +
\frac{1}{\rm \pi}\int_{0}^{\infty}\int_{(({x+1/2})/{y})\xi_y}^{\infty}
\xi_x^m\xi_y^n [\rho_{{in}}(x_{{in}},y_{{in}})\nonumber\\
& \quad +T_{{in}}(x_{{in}},y_{{in}}) (\xi_x^2+\xi_y^2-1)]
\exp[-\xi_x^2-\xi_y^2]\,\mathrm{d}\xi_x\,\mathrm{d}\xi_y
\nonumber\\ & \quad +
\frac{1}{\rm \pi}\int_{0}^{\infty}\int_{-\infty}^{(({x-1/2})/{y})\xi_y}
\xi_x^m\xi_y^n
[\rho_{{in}}(x_{{in}},y_{{in}})+T_{{in}}(x_{{in}},y_{{in}})
(\xi_x^2+\xi_y^2-1)]\nonumber\\ &\quad \times
\exp[-\xi_x^2-\xi_y^2]\,\mathrm{d}\xi_x\,\mathrm{d}\xi_y +
\frac{1}{\rm \pi}\int_{0}^{y/t}\int_{(({x-1/2})/{y})\xi_y}^{(({x+1/2})/{y})\xi_y}
\xi_x^m\xi_y^n [\rho_{{in}}(x_{{in}},y_{{in}})\nonumber\\
& \quad +T_{{in}}(x_{{in}},y_{{in}}) (\xi_x^2+\xi_y^2-1)]
\exp[-\xi_x^2-\xi_y^2]\,\mathrm{d}\xi_x\,\mathrm{d}\xi_y.
\end{align}
Hereafter, the numerical evaluation of all improper integrals is carried out by replacing the unbounded integration intervals with bounded intervals. All integrals converge rapidly due to the exponential decay of their integrands at  $|\xi _x|,|\xi _y|\gg 1$.
Applying (A1)–(A3) to express the acoustic fields in (3.16), we obtain, for the isothermal-plate system,
 \begin{equation} \left.\begin{array}{@{}c@{}}
\rho^{({iso})}(t,x,y>0)=I^{({iso})}_{0,0}(y>0)+J_{0,0}(y>0)
, \\
u^{({iso})}(t,x,y>0)=I^{({iso})}_{1,0}(y>0)+J_{1,0}(y>0),\\
v^{({iso})}(t,x,y>0)=I^{({iso})}_{0,1}(y>0)+J_{0,1}(y>0) ,
\\
P_{xx}^{({iso})}(t,x,y>0)=I^{({iso})}_{2,0}(y>0)+J_{2,0}(y>0)
,\\
P_{yy}^{({iso})}(t,x,y>0)=I^{({iso})}_{0,2}(y>0)+J_{0,2}(y>0)
,\\
P_{xy}^{({iso})}(t,x,y>0)=I^{({iso})}_{1,1}(y>0)+J_{1,1}(y>0).
\end{array}\right\} \end{equation}
For the specular-wall case, the same expressions follow after replacing all  $I^{({iso})}_{m,n}(y>0)$ terms with
 $I^{({spec})}_{m,n}(y>0)$ given in (A2). Both isothermal- and specular-wall fields contain free-space (
 $J_{m,n}$) and wall-reflection (
 $I_{m,n}$) contributions to the acoustic disturbances. The differences between
 $I^{({iso})}_{m,n}$ and
 $I^{({spec})}_{m,n}$ manifest the effect of wall conditions on the acoustic field.
Due to the difference in the  $\xi _z$ dependence of the integrand, the normal-to-plane stress component
 $P_{zz}$ (see (3.16)) cannot be tabulated entirely in terms of the above
 $I_{m,n}$ and
 $J_{m,n}$. The expression for
 $P_{zz}$ in the upper half-plane in the isothermal-plate case is
 \begin{align} & P_{zz}^{{(iso)}}(t,x,y>0)
= \frac{1}{2}I^{{(iso)}}_{0,0}(y>0)\nonumber\\ & \quad +
\frac{1}{2{\rm \pi}}\int_{-\infty}^{0}\int_{-\infty}^{\infty}
[\rho_{{in}}(x_{{in}},y_{{in}})+T_{{in}}(x_{{in}},y_{{in}})
(\xi_x^2+\xi_y^2)] \exp[-\xi_x^2-\xi_y^2]\,
\mathrm{d}\xi_x\, \mathrm{d}\xi_y \nonumber\\ & \quad +
\frac{1}{2{\rm \pi}}\int_{0}^{\infty}\int_{(({x+1/2})/{y})\xi_y}^{\infty}
[\rho_{{in}}(x_{{in}},y_{{in}})+T_{{in}}(x_{{in}},y_{{in}})
(\xi_x^2+\xi_y^2)] \exp[-\xi_x^2-\xi_y^2]\,
\mathrm{d}\xi_x\, \mathrm{d}\xi_y \nonumber\\ & \quad +
\frac{1}{2{\rm \pi}}\int_{0}^{\infty}\int_{-\infty}^{(({x-1/2})/{y})\xi_y}
[\rho_{{in}}(x_{{in}},y_{{in}})+T_{{in}}(x_{{in}},y_{{in}})
(\xi_x^2+\xi_y^2)] \exp[-\xi_x^2-\xi_y^2]\,
\mathrm{d}\xi_x\, \mathrm{d}\xi_y \nonumber\\ & \quad +
\frac{1}{2{\rm \pi}}\int_{0}^{y/t}\int_{(({x-1/2})/{y})\xi_y}^{(({x+1/2})/{y})\xi_y}
[\rho_{{in}}(x_{{in}},y_{{in}})+T_{{in}}(x_{{in}},y_{{in}})
(\xi_x^2+\xi_y^2)] \exp[-\xi_x^2-\xi_y^2]\,
\mathrm{d}\xi_x\, \mathrm{d}\xi_y,
\end{align}
whereas in the specular-wall set-up
 \begin{align}& P_{zz}^{{(spec)}}(t,x,y>0) =
\frac{1}{2{\rm \pi}}\int_{y/t}^{\infty}\int_{(({x-1/2})/{y})\xi_y}^{(({x+1/2})/{y})\xi_y}
[\rho_{{in}}(x_{{in}},y_{{spec}})+T_{{in}}(x_{{in}},y_{{spec}})
(\xi_x^2+\xi_y^2 ) ]\nonumber\\ &\quad \times\exp
[-\xi_x^2-\xi_y^2 ]\, \mathrm{d}\xi_x\, \mathrm{d}\xi_y+
\frac{1}{2{\rm \pi}}\int_{-\infty}^{0}\int_{-\infty}^{\infty}
[\rho_{{in}}(x_{{in}},y_{{in}})\nonumber\\ &\quad
+T_{{in}}(x_{{in}},y_{{in}}) (\xi_x^2+\xi_y^2 ) ] \exp
[-\xi_x^2-\xi_y^2 ]\, \mathrm{d}\xi_x\, \mathrm{d}\xi_y
\nonumber\\ &\quad +
\frac{1}{2{\rm \pi}}\int_{0}^{\infty}\int_{(({x+1/2})/{y})\xi_y}^{\infty}
[\rho_{{in}}(x_{{in}},y_{{in}})+T_{{in}}(x_{{in}},y_{{in}})
(\xi_x^2+\xi_y^2 ) ] \exp [-\xi_x^2-\xi_y^2 ]\,
\mathrm{d}\xi_x\, \mathrm{d}\xi_y \nonumber\\ &\quad +
\frac{1}{2{\rm \pi}}\int_{0}^{\infty}\int_{-\infty}^{(({x-1/2})/{y})\xi_y}
[\rho_{{in}}(x_{{in}},y_{{in}})+T_{{in}}(x_{{in}},y_{{in}})
(\xi_x^2+\xi_y^2 ) ] \exp [-\xi_x^2-\xi_y^2 ]\,
\mathrm{d}\xi_x\, \mathrm{d}\xi_y \nonumber\\ &\quad +
\frac{1}{2{\rm \pi}}\int_{0}^{y/t}\int_{(({x-1/2})/{y})\xi_y}^{(({x+1/2})/{y})\xi_y}
[\rho_{{in}}(x_{{in}},y_{{in}})+T_{{in}}(x_{{in}},y_{{in}})
(\xi_x^2+\xi_y^2 ) ] \exp [-\xi_x^2-\xi_y^2 ]\,
\mathrm{d}\xi_x\, \mathrm{d}\xi_y.
\end{align}
A.2. Lower half-plane
Since the free-molecular system response in the lower half-plane is not affected by wall reflections, the acoustic fields are identical between the isothermal- and specular-plate set-ups for  $y<0$. Here, we introduce
 \begin{align} J_{m,n}(t,x,y<0)&= \frac{1}{\rm \pi}\int_{-\infty}^{0}\int_{(({x+1/2})/{y})\xi_y}^{\infty} \xi_x^m\xi_y^n [\rho_{{in}}(x_{{in}},y_{{in}})+T_{{in}}(x_{{in}},y_{{in}})(\xi_x^2+\xi_y^2-1)]\nonumber\\ &\quad \times\exp[-\xi_x^2-\xi_y^2]\, \mathrm{d}\xi_x\, \mathrm{d}\xi_y + \frac{1}{\rm \pi}\int_{-\infty}^{0}\int_{-\infty}^{(({x-1/2})/{y})\xi_y} \xi_x^m\xi_y^n [\rho_{{in}}(x_{{in}},y_{{in}})\nonumber\\ &\quad +T_{{in}}(x_{{in}},y_{{in}})(\xi_x^2+\xi_y^2-1)] \exp[-\xi_x^2-\xi_y^2]\, \mathrm{d}\xi_x\, \mathrm{d}\xi_y, \end{align}
and obtain
 \begin{equation} \left.\begin{array}{@{}c@{}}
\rho(t,x,y<0)=J_{0,0}(y<0) , \quad u(t,x,y<0)=J_{1,0}(y<0)
,\\ v(t,x,y<0)=J_{0,1}(y<0) , \quad
P_{xx}(t,x,y<0)=J_{2,0}(y<0) ,\\
P_{yy}(t,x,y<0)=J_{0,2}(y<0) \quad \mathrm{and} \quad
P_{xy}(t,x,y<0)=J_{1,1}(y<0), \end{array}\right\}
\end{equation}
independent of the solid plate type. For the normal-to-plane stress component  $P_{zz}$, we find that
 \begin{align}& P_{zz}(t,x,y<0) =
\frac{1}{2{\rm \pi}}\int_{-\infty}^{0}\int_{(({x+1/2})/{y})\xi_y}^{\infty}
[\rho_{{in}}(x_{{in}},y_{{in}})+T_{{in}}(x_{{in}},y_{{in}})
(\xi_x^2+\xi_y^2)]\nonumber\\ &\quad \times\exp[-\xi_x^2-\xi_y^2]\, \mathrm{d}\xi_x\, \mathrm{d}\xi_y
+\frac{1}{2{\rm \pi}}\int_{-\infty}^{0}\int_{-\infty}^{(({x-1/2})/{y})\xi_y}
[\rho_{{in}}(x_{{in}},y_{{in}})\nonumber\\ &\quad
+T_{{in}}(x_{{in}},y_{{in}}) (\xi_x^2+\xi_y^2)]
\exp[-\xi_x^2-\xi_y^2]\, \mathrm{d}\xi_x\, \mathrm{d}\xi_y
. \end{align}
Appendix B. Free-molecular impulse response
Starting with the upper half-plane, we substitute (5.1) together with (3.4) into (A2) and (A3) and integrate. In the density-impulse case we obtain
 \begin{align} I^{{(spec,\delta_\rho)}}_{m,n}(t,x,y>0)&=\frac{1}{{\rm \pi} t^2} \xi_{x_1}^m\xi_{y_{{spec}}}^n {H}\left(\xi_{x_1}-\frac{x-1/2}{y}\xi_{y_{{spec}}}\right) {H}\left(\xi_{y_{{spec}}}-\frac{y}{t}\right)\nonumber\\ &\quad \times {H}\left(\frac{x+1/2}{y}\xi_{y_{{spec}}}-\xi_{x_1}\right) \mathrm{e}^{-\xi_{x_1}^2-\xi_{y_{{spec}}}^2}, \end{align}
and
 \begin{align} J^{{(\delta_\rho)}}_{m,n}(t,x,y>0)&=\frac{1}{{\rm \pi} t^2} \xi_{x_1}^m\xi_{y_1}^n\left[ {H}(-\xi_{y_1})+ {H}(\xi_{y_1}){H}\left(\xi_{x_1}-\frac{x+1/2}{y}\xi_{y_1}\right) \right.\nonumber\\ &\quad + {H}(\xi_{y_1}){H}\left(\frac{x-1/2}{y}\xi_{y_1}-\xi_{x_1}\right)+ {H}(\xi_{y_1}){H}\left(\frac{y}{t}-\xi_{y_1}\right)\nonumber\\ &\quad \times{H} \left(\xi_{x_1}-\frac{x-1/2}{y}\xi_{y_1}\right)\left. {H}\left(\frac{x+1/2}{y}\xi_{y_1}-\xi_{x_1}\right) \right] \mathrm{e}^{-\xi_{x_1}^2-\xi_{y_1}^2}, \end{align}
where
 \begin{equation} \xi_{y_1}=\frac{y-y_\delta}{t} , \quad \xi_{y_{{spec}}}=\frac{y+y_\delta}{t},\end{equation}
and  $\xi _{x_1}$ is specified in (5.6a,b). In the heating-impulse set-up we obtain
 \begin{align} I^{{(spec,\delta_T)}}_{m,n}(t,x,y>0)&=\frac{1}{{\rm \pi} t^2} \xi_{x_1}^m\xi_{y_{{spec}}}^n (\xi_{x_1}^2+\xi_{y_{{spec}}}^2-1) {H}\left(\xi_{x_1}-\frac{x-1/2}{y}\xi_{y_{{spec}}}\right)\nonumber\\ &\quad \times {H}\left(\xi_{y_{{spec}}}-\frac{y}{t}\right) {H}\left(\frac{x+1/2}{y}\xi_{y_{{spec}}}-\xi_{x_1}\right) \mathrm{e}^{-\xi_{x_1}^2-\xi_{y_{{spec}}}^2}, \end{align}
and
 \begin{align}
J^{{(\delta_T)}}_{m,n}(t,x,y>0)&=\frac{1}{{\rm \pi} t^2}
\xi_{x_1}^m\xi_{y_1}^n (\xi_{x_1}^2+\xi_{y_1}^2-1) \left[
{H}(-\xi_{y_1})+
{H}(\xi_{y_1}){H}\left(\xi_{x_1}-\frac{x+1/2}{y}\xi_{y_1}\!\right)\right.
\nonumber\\ &\quad +
{H}(\xi_{y_1}){H}\left(\frac{x-1/2}{y}\xi_{y_1}-\xi_{x_1}\right)+
{H}(\xi_{y_1}){H}\left(\frac{y}{t}-\xi_{y_1}\right)\nonumber\\
&\quad \times \left.{H}
\left(\xi_{x_1}-\frac{x-1/2}{y}\xi_{y_1}\right)
{H}\left(\frac{x+1/2}{y}\xi_{y_1}-\xi_{x_1}\right) \right]
\mathrm{e}^{-\xi_{x_1}^2-\xi_{y_1}^2}.
\end{align}
Expressions for  $I^{{(iso,\delta _\rho )}}_{m,n}(t,x,y>0)$ and
 $I^{{(iso,\delta _T)}}_{m,n}(t,x,y>0)$ are obtained by substituting (5.2) or (5.3) into (A1), and evaluating numerically.
Traversing to the lower half-plane, we find that
 \begin{align} J^{{(\delta_\rho)}}_{m,n}(t,x,y<0)&=\frac{1}{{\rm \pi} t^2} \xi_{x_1}^m\xi_{y_1}^n \left[ {H}(-\xi_{y_1}){H}\left(\xi_{x_1}-\frac{x+1/2}{y}\xi_{y_1}\right) \right.\nonumber\\ &\quad +\left. {H}(-\xi_{y_1}){H}\left(\frac{x-1/2}{y}\xi_{y_1}-\xi_{x_1}\right) \right] \mathrm{e}^{-\xi_{x_1}^2-\xi_{y_1}^2}, \end{align}
in the density-impulse case and
 \begin{align} J^{{(\delta_T)}}_{m,n}(t,x,y<0)&=\frac{1}{{\rm \pi} t^2} \xi_{x_1}^m\xi_{y_1}^n (\xi_{x_1}^2+\xi_{y_1}^2-1) \left[ {H}(-\xi_{y_1}){H}\left(\xi_{x_1}-\frac{x+1/2}{y}\xi_{y_1}\right)\right.\nonumber\\ &\quad + \left. {H}(-\xi_{y_1}){H}\left(\frac{x-1/2}{y}\xi_{y_1}-\xi_{x_1}\right) \right] \mathrm{e}^{-\xi_{x_1}^2-\xi_{y_1}^2}, \end{align}
for the delta-heating set-up, in both specular- and isothermal-wall configurations.
Expressions for the hydrodynamic fields in the upper and lower half-planes follow by substitution of the above expressions for  $y>0$ and
 $y<0$ into (A4) and (A8), respectively.


 Open access

