1 Introduction
The primary feature of the Russian public pension system has been the relatively generous pension eligibility rules, the exceptionally low retirement age (age 60 for males and age 55 for females), and the privileged retirement plans for specific groups (which accounted for almost a third of the retired Russian population in early 2000), such as those working in unfavourable conditions or territories (Gurvich, Reference Gurvich2004). The declining birth rate and increasing mortality rate in the last two decades, along with early retirements due to privatization, have left Russia's population disproportionately middle-aged and older; e.g., the percentage of elderly people (aged 65+) in Russia reached 13.8% in 2005 (17.1% for 60+). The standard definition of an elderly society is when the fraction above age 60 exceeds 8–10% of the total population (Gavrilova and Gavrilov, Reference Gavrilova, Gavrilov and Uhlenberg2009). With 1.24 employees per pensioner today in Russia compared to 2.2 in 1991, the Russian population is ageing faster than almost any other country in Europe, and the public pension fund deficit is also growing quickly (Terra Daily, 2007).
In 2005, the Russian Federation underwent a major systemic reform of its pension system in order to strengthen the security of long-term retirement savingsFootnote 1 and decrease the role of the state. The system shifted from a publicly managed distributive system to one supplemented by a privately managed mandatory funded component (OECD, 2006). However, federal allocations still made up 53.3% of the pension fund budget in 2007 and total pension expenditures made up 6% of GDP (World Bank, 2007). In addition, there has been increasing demand for private employee benefit funds (Hauner, Reference Hauner2008).
Research has shown that the likelihood of planning for retirement is highly correlated with financial literacy and education, and the relationship remains strong even after controlling for wealth and other demographic variables (e.g., Bernheim, Reference Bernheim, Walker, Bloomfield and Thorning1995; Lusardi and Mitchell, Reference Lusardi and Mitchell2007, Reference Lusardi, Mitchell, Lusardi and Mitchell2011inter alia). As Russia transitions to a market-based banking system, the fear is that financial education and basic financial literacy are lagging behind, given the level of knowledge necessary to effectively participate in this changing economic system.
It is likely that most young Russians did not grow up with parents who had bank loans (i.e., they did not learn financial skills at home), did not receive formal financial literacy courses in school (there is no curriculum requirement for financial education in Russia), and do not have long personal banking relationships or experience with financial products.Footnote 2 Additionally, there is a widespread perception among the young of ubiquitous unfairness in economic processes and a lack of trust in the rule of law and institutions (Gächter and Herrman, Reference Gächter and Herrmann2006; EBRD, 2007).
Our paper extends the extant literature in a new direction, analysing results of a detailed survey of financial literacy administered to a nationally representative sample of about 1,400 Russian individuals. The survey includes questions on financial literacy, retirement planning, and the use of various financial products as well as detailed demographic and socioeconomic information. We address some novel questions: for instance, what is the level of financial literacy in a country without a legacy of consumer credit or financial education? What is the level and asset mix of retirement planning in Russia, in view of the demographic situation, the fears for the future, and the recent pension reforms? Is financial literacy linked to the use of different types of pension funds, and, importantly, are higher levels of financial literacy related to participation in individual private pension plans? Finally, because Russia is a country with pronounced regional inequalities and gender gaps, we are very interested in examining whether there are significant differences among certain population segments with respect to financial literacy and retirement planning.
We find that even though consumer borrowing is increasing very rapidly in Russia, only 36% of respondents in our sample seem to understand the workings of interest compounding and only half of the sample were able to answer a simple question about inflation. Only 13% can answer a question on risk diversification in asset investments. Financial literacy is higher among the younger and the more highly educated populations and lower in rural areas and among those living outside of major cities. Importantly, we find that financial literacy is significantly positively related to retirement planning and the use of private pension funds and products, with financially literate individuals being 25–30% more likely to plan for retirement using private pension funds.
The paper proceeds as follows: Section 2 describes our dataset, the main variables, and presents summary statistics; Sections 3 and 4 present the empirical strategy and report the results; and Section 5 concludes.
2 The dataset
We use information from the second wave of a dataset collected via face-to-face interviewsFootnote 3 of 1,400 individuals in June 2009. The sample was designed to be nationally representative at the individual and the household level and was weighted by gender, age, education, and region (excluding the North-Caucasian [Chechnya] federal district).
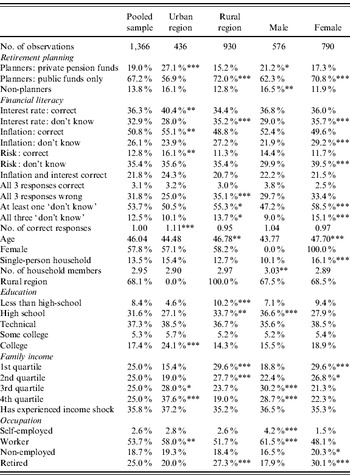
As shown in the first column of Table A1, our sample consists of 42.2% male respondents, consistent with national census averages (Russia Census, 2002), with the average age of the sample at around 46 years.Footnote 4 Most individuals (62.3%) reported living in households with three or more individuals, with 13.5% living alone. A majority of our sample (56.3%) is in the workforce, and 31.9% of the sample live in urban regions, defined as settlements with a population greater than 500,000 (14.2% in Moscow, St. Petersburg, and nearby areas). The education level of individuals in our sample is higher than the level in comparative emerging markets: only 8.4% of the sample has less than a secondary education, and 22.7% have initiated or completed a higher education degree programme.
Survey respondents were asked to report their individual and household monthly income, but these values are missing for almost 40% of the sample (i.e., 40% of respondents refused to answer). In our sample, mean personal monthly income for 2008 is US$ 762 (US$ 500 median income), while average family monthly income is US$ 1,494 (US$ 1,042 median). This compares closely with official statistics for 2008 of average per capita monthly income of US$ 1,404 (Russian Federation Federal Statistics Service, 2008). For our main regressions in the next section we first impute missing income observations (using other individual characteristics) and, second, we use dummy variables for income quartiles rather than simply income. The survey also included a self-reported categorical measure of buying capacity and all results are robust to the substitution of income dummies with a dummy variable equal to one if individuals reported that they cannot afford to purchase even food or clothes. We also include a variable labelled ‘Income shock’ if the individual responded ‘Yes’ to the question, ‘Did your family experience an unexpected significant reduction of your income over the past 12 months’ (35.8% of the sample).
The variable of primary interest to this study is that related to retirement planning, stemming from a question that asked respondents: ‘What funds will you live on after you reach retirement age?’ A set of nine response options was offered, allowing for multiple answers. We distinguish between three primary retirement planning strategies, based on the responses provided:
(a) Planners: private pension funds are defined as those who chose at least one of the following responses: ‘Pension that you will receive from a privately owned retirement fund’, ‘Income from leasing and selling property’, ‘Additional pension or financial aid from an enterprise where you have been working’, or ‘Your own savings’. The total number of respondents in this group is 259 (19%).
(b) Planners: public pension funds are identified as those who responded ‘Pension that you will receive from a publicly owned retirement fund’. A remarkable 82.4% of respondents replied that they will rely on public funds, which is indicative of the coverage of the public pension system in Russia, and its post-socialist attribute. A portion (15.2%) of respondents reported having access to both public and private pension funds, and these respondents are included in the former group (planners: private pension funds); hence, the remaining 67.2% of the sample (918 observations) is assumed to have access only to public pension funds.
(c) Non-planners are those who responded, ‘Your own earnings (I will continue to work after retirement)’; ‘Support from children, relatives, acquaintances’; ‘Support from church and charitable organizations’; and/or ‘Don't know’. The total number of respondents in this group is 189 individuals (13.8%).
3 Empirical evidence
3.1 The measurement of financial literacy in Russia
Our survey included three specific financial literacy questions designed to assess: (a) understanding of interest rate (numeracy); (b) understanding of inflation; and (c) understanding of risk diversification. An important caveat to keep in mind when doing an international comparison is that the inflation and risk questions asked in the Russian survey differ somewhat from those in the 2004 US Health and Retirement Study. The exact questions are reported below:
(1) Understanding of Interest Rate (Numeracy). Let's assume that you deposited 100,000 rubles in a bank account for 5 years at 10% interest rate. The interest will be earned at the end of each year and will be added to the principal. How much money will you have in your account in 5 years if you do not withdraw either the principal or the interest? More than 150,000 rubles/less than 150,000 rubles/I cannot estimate it even roughly.
(2) Understanding of Inflation. Let's assume that in 2010 your income is twice what it is now, and that consumer prices also grow twofold. Do you think that in 2010 you will be able to buy more, less, or the same amount of goods and services as today? More than today/Less than today/I cannot estimate it even roughly.
(3) Understanding of Risk Diversification. Which is the riskier asset to invest in? Shares in a single company stock/Shares in a unit fund/Risks are identical in both cases/Don't know.
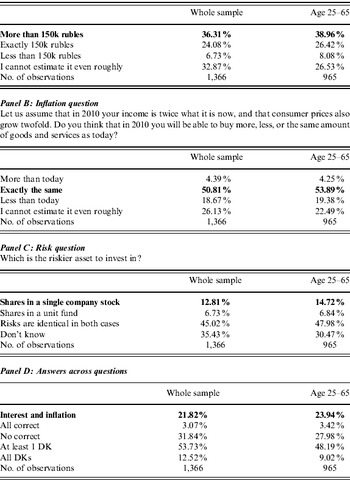
Table 1 shows summary statistics of responses to our financial literacy questions for the whole sample and for the sample of individuals aged 25–65. As shown in Panel A, 36.3% of individuals in the whole sample (39% of those aged 25–65) responded correctly to the interest compounding question, with another 32.9% (26.5% aged 25–65) replying that they cannot even roughly provide an answer. Panel B shows that 50.8% of individuals in the sample responded correctly to the inflation question (53.9% of those aged 25–65) and 26.1% (22.5%) could not provide any response at all. Panel C shows that only 12.8% of respondents (24.7% of those aged 25–65) correctly choose shares in a single company stock as a riskier investment asset than shares in a unit fund. As shown in Panel D, a very small number of individuals correctly answered all three questions, i.e., 3.1% of the whole sample (3.4% of those aged 25–65). To the interest and inflation questions 21.8% responded correctly (23.9% aged 25–65). Furthermore, 31.8% gave all incorrect responses (28% aged 25–65) and 12.5% (9% aged 25–65) reply with ‘I don't know’ to every question. A remarkable 53.7% of respondents replied with ‘I don't know’ to at least one question (48.2% aged 25–65).
Financial literacy questions (correct answers are shown in bold)
Panel A: Interest question
Let us assume that you deposited 100,000 rubles in a bank account for 5 years at 10% interest rate. The interest will be earned at the end of each year and will be added to the principal. How much money will you have in your account in 5 years if you do not withdraw either the principal or the interest?

3.2 The demographics of financial literacy in Russia
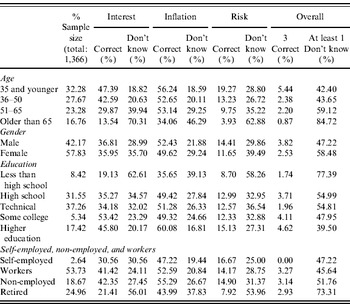
Table 2 presents summary statistics of financial literacy in Russia, by demographic characteristics, disaggregated by correct and don't know responses. First, the data suggest that financial literacy is negatively related to age: to all three questions, younger groups are more likely to provide correct responses and less likely to indicate that they do not know an answer. Second, correct responses are not notably different by gender, although women are much more likely to state that they do not know what the answer is (58.5% of females versus 47.2% of males). Third, individuals with higher education offer a higher number of correct responses (and a lower percentage of do not know responses) with respect to all three questions. Finally, we find lower levels of literacy among retired and self-employed individuals, though the latter category might include informal workers.
Distribution of financial literacy across demographics

3.3 Differences between urban and rural regions
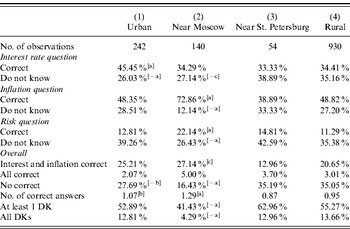
Following the long transition path, Russia has emerged as a country with very high rates of inequality, large pay gaps between the genders and regional disparities. Table 3 describes financial literacy across urban and rural regions. Moreover, it provides an additional distinction between (a) urban regions other than Moscow and St. Petersburg (242 observations); (b) Moscow and its near regions (140 observations); (c) St. Petersburg and its near regions (54 observations), and (d) rural regions, defined as settlements with less than 500,000 habitants.
Financial literacy across urban and rural areas

Note: *[c]<0.10, **[b]<0.05, ***[a]<0.01: from a t test of mean differences between (1) vs. (4), (2) vs. (4), and (3) vs. (4), respectively. Urban regions in column 1 exclude Moscow and St. Petersburg.
The table shows that urban area residents are more likely to respond correctly to the interest rate question (45.5% compared to 24.4% in rural areas). They are also significantly less likely to reply ‘I don't know’ to that question. Moreover, urban area residents are less likely to respond incorrectly to all three questions (27.7%, compared to 35.1% in rural areas). In addition, near-Moscow residents are less likely to respond that they do not know the answer, for all three questions. They are more likely to respond correctly to the inflation and risk questions (72.9% and 22.1%, respectively) compared to rural area residents. These patterns are also confirmed by the analysis of the overall figures at the bottom of the table. The differences between near St. Petersburg residents and the remaining population are not statistically significant at conventional levels.
These results are confirmed in the summary statistics of Table A1, where it is also shown that rural area residents are more likely to be older, less educated, poorer, less likely to be employed, and more likely to be retired. Importantly, for the analysis in the next section, they are less likely to invest in private pension funds (15.2%, compared to 27.1% in urban areas) and more likely to expect to live on public pension funds after retirement (72% compared to 56.9% in urban areas). These differences are statistically significant at the 1% level.
4 Retirement planning: does financial literacy matter?
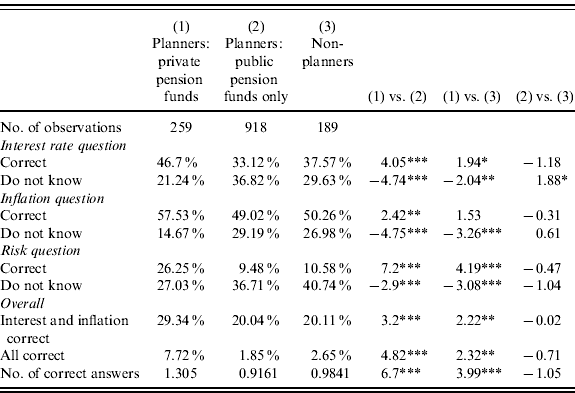
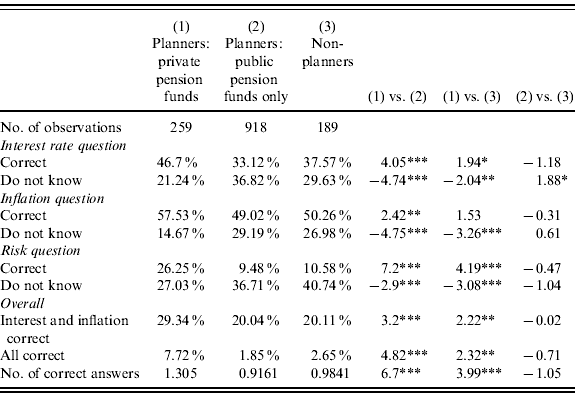
The relationship of primary interest to this study is the association between financial literacy and retirement planning. Table 4 shows that respondents identified as planners: private pension funds are significantly more likely to have responded correctly to all three financial literacy questions (and also less likely to have indicated not knowing the answer to any of the questions) than planners: public pension funds only and non-planners. Interestingly, we do not find any significant difference between correct and don't know response rates of respondents who have only public pension funds and non-planners.
Financial literacy by retirement planning
Note:
* P<0.10, **P<0.05, ***P<0.01: From a t test of mean differences. Planners: private pension funds are defined as those who chose at least one of the following responses: ‘Pension that you will receive from a privately owned retirement fund’, ‘Income from leasing and selling property’, ‘Additional pension or financial aid from an enterprise where you have been working’, or ‘Your own savings’. Planners: public pension funds are identified as those that responded, ‘Pension that you will receive from a publicly owned retirement fund’. Non-planners are defined as those who responded ‘Your own earnings (I will continue work after retirement)’; ‘Support from children, relatives, acquaintances’; ‘Support from church and charitable organizations’; and ‘Don't know’.
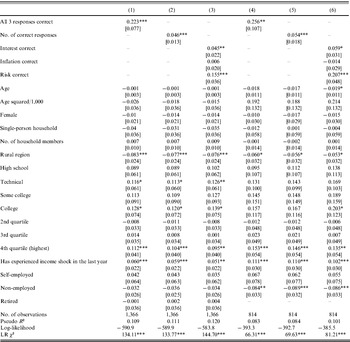
We next examine whether the positive association between financial literacy and retirement planning persists in regression analyses. Table 5 presents marginal effects and robust standard errors from probit regressions, with Planners: private pension funds as the dependent variable equal to 1 (and taking the value 0 if the individual plans to rely on public pension funds only or is a non-planner).
Dependent variable: planners: private pension funds (1/0) (marginal effects from probit models)

Note:
* P<0.10, **P<0.05, ***P<0.01.
The first two columns present the baseline private retirement planning estimates, including two financial literacy measures as dependent variables, one at a time: (i) the dummy variable for correct response to all three questions, and (ii) the number of correct responses, respectively. Both variables show a significantly large and positive relationship with the likelihood of planning for retirement using private pension funds.Footnote 5 Individuals who correctly responded to all three questions are more than twice as likely to own private pension funds. Finally, an increase in the number of correct responses from ½ standard deviation below the average to ½ standard deviation above the average raises the likelihood of having a private pension fund by up to 28.8%.
Column 3 presents retirement planning estimates from specifications that use dummy variables for the correct response to each of the three financial literacy questions. This specification allows the effect of the correct response to each question to have a quantitatively different influence on the dependent variable. The results suggest that an understanding of interest compounding exerts a moderate impact on retirement planning, with the effect at the magnitude of 26.8%, significant at the 10% level. An understanding of inflation exerts an insignificant impact on retirement planning using private funds. The effect of the largest magnitude is seen for the few respondents who were able to answer the risk question correctly. Those individuals are almost twice as likely to plan to use private pension funds.
In addition, all specifications show that respondents living in rural areas are significantly less likely to own private retirement funds. The magnitude of the effect indicates that rural residents are 50% less likely to privately plan for retirement, compared to urban residents. More highly educated individuals appear more likely to plan for retirement, as do higher-income respondents and respondents who report having experienced a negative income shock during the last year. Finally, the non-employed appear to be significantly less likely to plan for retirement using private funds, compared to workers and those who are self-employed. All results are robust to the exclusion of individuals who are already retired (columns 4–6).
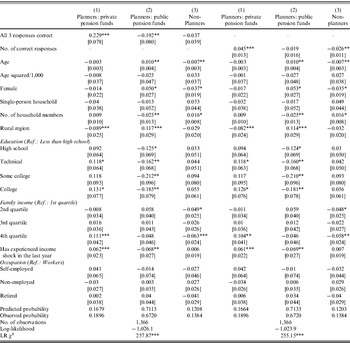
Our second set of estimates, presented in Table 6, allows for a more detailed distinction between the three retirement fund groups. The estimation method is a multinomial probit model, and marginal effects, along with robust standard errors, are shown in the table.Footnote 6 The results confirm that financial literacy is positively correlated with private retirement planning and negatively related to non-planning. For instance, we show that financially literate individuals are some 30% more likely to have private pension funds, and some 30% less likely to own no funds at all. The magnitude of the effects is much higher for the few individuals correctly answering all three financial literacy questions. They are more than twice as likely to own private funds and 27% less likely to rely on public pension funds only. The estimates in this table confirm that rural residents are some 50% less likely to participate in private pension schemes, and some 16% more likely to rely on public pension funds only. The more educated are significantly less likely to rely only on public pensions, and so are the higher-income respondents. The latter group and those who experienced a negative income shock in the last year are more likely to participate in private pension schemes.
Dependent variable: retirement planning (marginal effects from multinomial probit models)

Note:
* P<0.10, **P<0.05, ***P<0.01.
These results show some interesting patterns with respect to the relationship between financial literacy and private retirement planning, but so far, we cannot draw any causal inference. This section uses instrumental variables (IV) estimation to identify the impact of financial literacy on private retirement planning. The endogenous variable is financial literacy (in each of its two formats shown in Table 6). Two IV for the year 2007 are used in the first-stage regressions for financial literacy: (a) the total number of newspapers in circulation in every administrative region and (b) the number of universities in every administrative region (both public and private). The two variables are assumed to be positively correlated with financial literacy – they proxy for the exposure to peers who are more likely to be financially literate – and uncorrelated with the unobserved determinants of private pension planning.Footnote 7 The average total number of newspapers is 55 (average number of local newspapers is 15), and the average number of universities is 14 (with an average of nine public and five private universities).
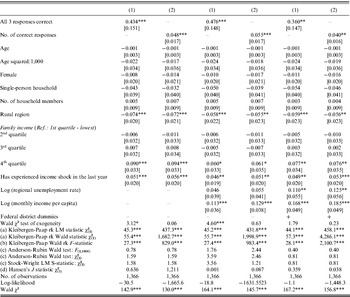
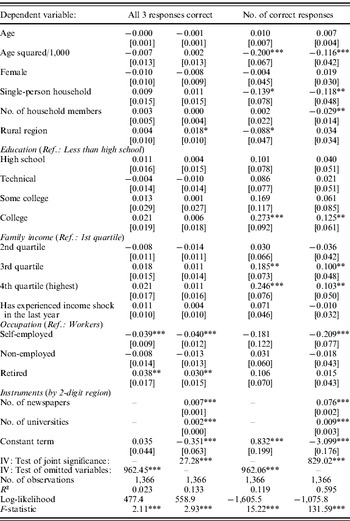
The second-stage estimates are reported in Table 7 (Table A2 presents the first-stage estimates). Marginal effects and robust standard errors from IV probit models are presented for private pension planning (the variable takes the value 0 for individuals with public pension funds only and the non-planners).Footnote 8 Specifically, all three measures of financial literacy are shown to exert a positive impact on private retirement planning in the baseline estimate of the first three columns. The magnitude of the estimated effect is almost two times higher than that of the baseline probit model in column 1. However, the estimate of the effect of the number of correct responses on private pension planning in column 2 is very similar in magnitude to the effect estimated in the probit model of Table 6. Hence, the IV estimates largely confirm the estimates presented in Table 5.
Dependent variable: planners: private pension funds (1/0) (marginal effects from IV probit models)

Note:
* P<0.10, ** P<0.05, ***P<0.01. The specification also includes education and occupation dummy variables. The tests at the bottom are from IV GMM models. (a) denotes under identification tests, (b) weak identification, (c) weak-instrument-robust inference (tests of joint significance of the endogenous regressors in the main equation), and (d) over identification tests.
In Columns 3, 4 and 5, 6, we perform two additional sets of robustness checks concerning the validity of our instruments. These specifications include control variables for the log values of the regional unemployment rate and the average monthly income per capita in every administrative region.Footnote 9 Then, in Columns 5 and 6, we add dummy variables for 1-digit federal regions to the specification. These robustness checks refute the possibility that the impact of our IV is due to regional differences in living standards and the degree of urbanisation. The results in the last four columns confirm the robustness of our instruments, and the magnitude of the effects remains high and statistically significant at the 1% level.
5 Discussion and conclusions
Policy-makers around the world have advocated for increased expenditures on financial literacy education, in hopes of increasing household savings and improving retirement planning, with the ultimate goal of reducing poverty, improving welfare, and increasing financial stability. Our study contributes to the existing literature by examining the relationship between financial literacy and retirement preparedness in a relatively understudied and interesting context, i.e., that of a country with a relatively old and rapidly ageing population, large regional disparities, and emerging financial markets. In a country with widespread public pension provision, we find that financial literacy is significantly positively related to retirement planning using private pension funds and schemes. Residents in rural areas are much more reliant on the public provision, investing less in private schemes and savings.
The ageing demographic in Eastern Europe is growing, and this has generated interest in the promotion of more responsible retirement planning with less government intervention, and the current financial crisis has generated interest in better understanding how to promote more responsible and prudent individual saving behaviours. The results of our study have a clear policy implication; along with encouraging the availability of private retirement plans and financial products, efforts to improve financial literacy can also be key to the expansion of the use of such plans.
Appendix
Summary statistics and mean differences

Note:
* P<0.10, **P<0.05, ***P<0.01: From a t test of mean differences.
IV first-stage regressions

Note:
* P<0.10, **P<0.05, ***P<0.01.