INTRODUCTION
The study of immune responses to infection by pathogens provides useful insights for the development of anti-parasitic vaccines. The immune system is capable of mounting different types of responses that consist of different phases and mechanisms, such as immediate and delayed responses. This makes it hard to understand it completely in its complexity. The type of response mounted by the immune system can depend on several different factors or on combinations of those factors. Examples of these factors are the genetic background of the host (Else and Wakelin, 1988), the type of pathogen and the strain/isolate of pathogen (Bellaby, Robinson and Wakelin, 1996), or the dose level with which the host has been infected (Bretscher et al. 1992; Bancroft, Else and Grencis, 1994), to mention but a few.
To gain a better understanding of the immune system, the mouse Mus musculus is widely used as a model organism. With the availability of different strains and gene-targeted knock-out mice, it can be used to study in detail different aspects or stages of the immune response to infection (Mak, Penninger and Ohashi, 2001).
In such context, a growing number of analytical techniques are applied. These techniques range from the hypothesis-driven small scale, such as Western immunoblots, to the collection-driven large scale, such as microarrays, one of the emerging techniques in the post-genomic era. Large-scale techniques are also called high-throughput techniques. They can be used to test hypotheses and, due to their scale, can also be used to generate or refine hypotheses. These can then be tested more thoroughly by small-scale techniques. The complementary use of both types of analysis techniques forms an iterative ‘cycle of knowledge’ (Kell and Oliver, 2003).
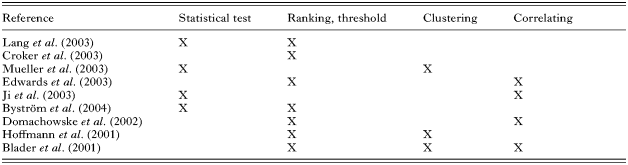
To benefit from high-throughput experiments, the vast amounts of data produced by these techniques need to be analysed. This can be done by filtering the data to eliminate low-quality measurements, normalization (e.g. for a review of analysis methods for transcriptome data see Quackenbush (2002)), and identification of the genes or proteins of interest. To identify the genes of interest in a transcriptome experiment several different approaches can be used, such as identifying differentially expressed genes based on their fold-change or by using statistical tests (Pan, 2002). Furthermore, supervised or unsupervised clustering techniques can be applied to cluster genes with similar expression patterns (Sherlock, 2000). The experimental data can also be placed into biological context by correlating the data to other information, such as functional annotation, chromosomal location or information about pathways. Both the fold-change approach and statistical tests have been mainly used in studies of the immune response (Table 1).
Table 1. Analysis techniques used in the literature (Analysis techniques used in the literature published on gene expression studies used to study the immune response to infection by pathogens.)

Using statistical tests or the fold-change approach to identify differentially expressed genes, simply reduces the number of genes that have to be considered for further analysis. However, by excluding genes from further analyses, this approach might even ignore information that can prove to be valuable when placed into biological context. Moreover, microarray experiments are often used as a starting point for further experiments, for instance, use of knock-out mice, study of different time-points, or to state hypotheses to be tested, then using hypothesis-driven analysis techniques. For example, Blader, Manger and Boothroyd (2001) identified genes so far not known to be involved in the immune response to infection with Toxoplasma gondii and confirmed the results using Northern Blots. Byström et al. (2004) identified genes expected to be involved in immune response to infection with Schistosoma mansoni, but for which no change in expression levels was observed. This led to new speculations that require experimental assessment. The findings were confirmed using RT-PCR.
To exploit the full potential of such experiments, make unbiased observations, and gain more insights into the immune system using a holistic approach rather than studying each component or parameter separately (Ricciardi-Castagnoli and Granucci, 2002), high-throughput data need to be analysed and correlated systematically with available biological knowledge (Noordewier and Warren, 2001). Examples of this knowledge are chromosomal location, Single Nucleotide Polymorphisms (SNPs), functional annotation of genes, pathways relevant to the genes involved, and results of other high-throughput studies.
To address this need, we have developed a classification of analytical tasks in immunological bioinformatics in the context of immune response to infection. The classification provides different ways to analyse experimental data in a systematic manner and to place it in a biological context. In this review, we introduce the classification and illustrate it with reference to a study of the immune response in the mouse to infection with the intestinal parasite Trichuris muris. Then we show possible ways of deployment of the classification, for instance, to identify different approaches of analysing experimental data.
THE CLASSIFICATION
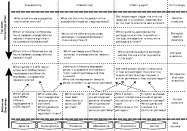
To identify the analytical tasks of relevance to immunology in the functional genomics era, a combination of bottom-up and top-down approaches has been used (see also Fig. 1).

Fig. 1. Overview classification. Schematic overview of the approach used to classify the tasks, including some examples of the resulting classification. The bottom row contains different kinds of available data that drive the simple questions, whereas the rows at the top specify different aspects of immunological studies that drive the more complex questions.
The bottom-up approach can be seen as data-driven. Starting with the identification of the relevant data, several simple analysis tasks that can be carried out on these data sources have been identified. These tasks can be composed further to form more complex and context-rich analyses and to combine information from several data sources. These analyses are simple inferences, targeted at extracting specific lessons from one or a small number of experiments.
In contrast to the simple analyses and their compositions, the more general and complex analysis tasks are driven by immunological knowledge using the top-down approach. These tasks are complex inferences targeted at learning a general lesson. The higher level analyses have been classified by associating them in groups with regard to their contents. These groups are: the reaction of the host to an infection, the infecting agent, and the reasons for the overall susceptibility of the host.
The analysis tasks, data sources of relevance to immunology, and the task classification are explained in more detail below.
Classification of the data
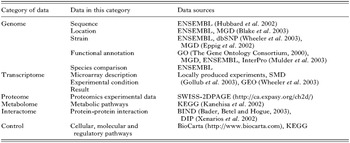
Available and relevant data, including experimental data, have been classified according to their contents, resulting in the following categories: Genome, Transcriptome, Proteome, Metabolome, Interactome, and Control. An overview of the resulting categories and a subset of the data sources used are shown in Table 2.
Table 2. Data categories (Representative data categories and a subset of data sources that are of relevance to immunology. A more detailed overview can be found in the supplementary data file 1.)

Classification of immunology
To identify the more complex questions, driven by immunological knowledge, a classification of immunology is required. The following different aspects of immunological study and interest have been identified: study of the host post-infection, of the pathogen post-infection and of the susceptibility of an individual to infection or re-infection with a particular pathogen.
The infected host mounts an immune response that can consist of different stages. These include the detection of infection and the immediate and delayed response to infection. These responses result in either the destruction of the pathogen, neutralization of the threat and provision of immunity, or the entering of an altered state to prevent host-damaging pathology. The latter may occur in the case of chronic infections.
The infecting agent initially invades host tissue. This is followed by an evasion of the immune response and, on treatment of the host with drugs, by a response to these drugs.
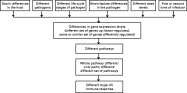
As indicated above, the type of immune response mounted by the immune system depends on several factors. These can cause differences in expression levels and lead to different activations of pathways resulting in different types of response (Fig. 2).

Fig. 2. Cause for different immune responses. Schematic presentation of factors that can cause differences in genes expression, which in turn can lead to differences in activation of pathways and can cause different types of immune responses.
However, differences in gene expression levels cannot only be caused by different pathogens or different strains of the host. They can also be caused by changes in the experimental conditions, for instance, the tissue type, cell type or the stage of the immune response (time-point post-infection) examined. Therefore, it is necessary to take all these different factors and dependencies into account while analysing experimental data or developing a classification of tasks.
Classification of the tasks
This section examines the tasks introduced in Fig. 1 in more detail, in particular the top-down approach. This will illustrate how general questions can be decomposed into simpler requests that can then be answered by using specific experimental data sets.
Question 1. Why is one mouse susceptible and another one not?
For example, AKR mice are susceptible to infection by Trichuris muris while BALB/c mice are resistant (Deschoolmeester and Else, 2002). This might be caused by strain differences, such as polymorphisms. However, there could be several SNPs between a susceptible and resistant strain and probably not all of them are in genes that are involved in host-protective immune responses. This leads to the next tier of questions. Which strain differences can be found between susceptible and resistant mice? Which of the strain differences found between susceptible and resistant mice are significant for susceptibility/resistance?
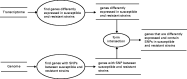
To answer these questions, differences in these strains have to be identified by analysing genome data containing information about polymorphisms. However, the result of this task will be a large number of polymorphic genes. To reduce the list to genes involved in the host-protective immune response, the genes with different expression levels in susceptible and resistant strains can be chosen. The resulting set of genes probably does not provide enough information to answer the more general questions. However, analysing different batches of appropriate experimental data sets using compositions of simple tasks might eventually lead to the answer (for a systematic overview see Fig. 3). This approach can be improved further by taking into account polymorphisms in the structural and promoter regions of genes. Polymorphisms in these regions will also influence the resistance or susceptibility of the host.

Fig. 3. Data flow diagram--susceptibility. Data flow diagram for retrieving genes that are differently expressed in susceptible and resistant mice that contain SNPs. The following notation is used: open-ended rectangles represent data stores, ellipses represent processes that process the incoming data and produce an output, and arrows represent the data flow.
Question 2. What did the immune system of the susceptible mouse do inappropriately?
It is known, for instance, that mice susceptible to infection by T. muris mount an inappropriate Th1 immune response. However, resistant mice mount a Th2 response and expel the worm before day 35 post-infection (Deschoolmeester and Else, 2002). Both immune responses consist of several pathways; however, it is not yet know whether just the Th1 and Th2 signalling pathways are important or whether other factors play a role too.
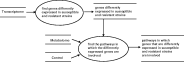
Therefore, to answer Question 2 the pathways that are differently activated in resistant and susceptible mice need to be studied. This might be done by analysing several transcriptome data sets, finding the genes that are differently regulated, and identifying the pathways they are involved in. The data flow diagram for this task is shown in Fig. 4. After identification of the pathways of interest, the significant pathways among these need to be identified, which might require the analysis of more data sets.

Fig. 4. Data flow diagram--host. Data flow diagram for retrieving genes that are differently expressed in susceptible and resistant mice, and for finding the pathways these genes are involved in.
Question 3. Did the pathogen trigger the immune response in a direction that is inappropriate for the host, but that ensures the survival of the pathogen?
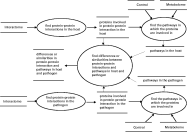
For example, it is known that T. muris secretes a protein that is similar to IFNγ in the host. This can cause the host to mount a Th1 response, which is inappropriate for worm expulsion (Grencis, 2001). Therefore, the question might be answered by comparing the proteins secreted by the host with the ones secreted by the pathogen. Then, those that are significant to ensuring the survival of the pathogen could be identified. Again, this question can probably only be answered by analysing a large number of appropriate data sets, but some insights might be gained by using the procedure shown in Fig. 5. One limitation of this approach is, however, that it will miss host parasite interactions which involve carbohydrates, glycolipids or processed proteins.

Fig. 5. Data flow diagram–pathogen. Data flow diagram for identifying differences or similarities in protein-protein interactions and pathways in host and pathogen.
The questions listed as part of these analyses form a small subset of questions that could be used to analyse these data in a broader context. Supplementary data file 2 provides a more comprehensive, though by no means complete, collection of questions. The questions are classified according to their complexity and type with respect to the kind of data analysed or the aspect of immunology studied.
CASE STUDIES
This section describes the experience of deploying the classification for the analysis of experimental data generated through studies of the immune response in mice to infection with pathogens.
Case study 1 – Analysis in a top-down manner
As shown in the previous section and in Fig. 1, to study the susceptibility of a host, one can ask “Why is one mouse susceptible and another one not?” For example, CBA mice are susceptible to infection with the gastrointestinal nematode parasite Heligmosomoides polygyrus, whereas SWR mice are resistant. As mentioned before, this might be caused by genetic differences between the two strains. As shown in Fig. 1, and following the data flow diagram for this analysis in Fig. 3, a possible approach to identifying those genetic differences is to identify genes with SNPs. Unfortunately only limited information about SNPs is currently available in publicly available databases.
However, quantitative trait loci (QTL) analysis (Rogner and Avner, 2003) provides a powerful technique for the identification of chromosomal regions that contribute to a particular phenotype and may show genetic differences between the two strains. QTL analysis has been used to identify loci influencing the immune response to infection with H. polygyrus (Menge et al. 2003) and provides the answer to the following complex question that is part of the analysis of susceptibility in general (see Fig. 1) “Which strain differences can be found between susceptible and resistant mice?”
The identified QTL regions can span several cM, and contain several hundred genes. This makes it difficult to identify potential candidate genes. For example, the QTL analysis of SWR and CBA mice to infection with H. polygyrus has identified QTL regions on chromosomes 1, 2, 4, 8, 9, 10, 11, 12, 13, 17, 18, and 19 (Menge et al. 2003). In the following, 2 of the QTL regions in which Menge and coworkers identified candidate genes are used to illustrate the application of the classification. One of the 2 QTL regions identified on chromosome 1 is located between 15–43cM and contains the candidate genes Stat4, CD28 and IL1 receptors. The QTL region on chromosome 17, located between 15–45cM, contains the candidate genes Tnfα, mast cell proteases 6 and 7, trefoil factors 1-3 and genes encoding the major histocompatibility complex.
All of these regions contain large numbers of genes. Some of them are known to be involved in immune response, including the candidate genes, some of them not known to be involved, and some of them even without a known function. It is likely that neither all of these genes, nor only the candidate genes, are significant for the different outcomes of infection in the two mouse strains. However, without any further information it is difficult to answer the following biological lessons question of this analysis (see Fig. 1) “Which of the strain differences found between susceptible and resistant mice are significant for susceptibility/resistance?”
To answer this question, the genes in the identified QTL regions need to be studied further and their role in the immune response needs to be analysed. Depending on the number of genes in these QTL regions, this might be time consuming and not very efficient. It may be useful to narrow down the number of genes that need to be corroborated with further experimental analysis, which can be done by correlating the information about QTL regions with transcriptome data generated to study the same infection.
Therefore, following the data flow diagram for the analysis of susceptibility in general in Fig. 3, genes that are differently expressed in susceptible and resistant mice need to be identified. A threshold of 2·5-fold change was used to analyse microarray experiments carried out to study the immune response of mice to infection with H. polygyrus (Bradley, Behnke, Hamshere, unpublished observations). This revealed that more than 1000 genes are differently expressed in gut tissue at day 35 post-infection in CBA and SWR mice.
An intersection of differently expressed genes with the set of genes in the QTL region on chromosome 1 reveals that of the candidate genes only Stat4 shows differences in expression levels above 2·5-fold. However, looking at the expression levels of other genes in this QTL region shows that Il18rap, Il18r1, Icos, Stat1, and Il1rl1 are differently expressed between susceptible and resistant mice. These genes are not mentioned as candidate genes (Menge et al. 2003). The same analysis was also used to analyse the QTL region on chromosome 17. This revealed that of the candidate genes, not only H2-Eb1, H2-M3, H2-Ob, H2-DMb1, and Tff2, but also Aif1, Apobec2, Ptcra and Apom show different expression levels in susceptible and resistant mice.
This analysis shows that only a fairly small number of the candidate genes show significantly different expression levels between susceptible and resistant mice. However, it also shows that some other genes, not yet considered as possible candidate genes, have significant differences in expression levels between the two mouse strains. This new knowledge might lead to revision of the list of candidate genes. However, without correlating the information about QTL regions with transcriptome data, the choice of candidate genes is usually biased towards genes that are known to be involved in immune response. This limits the chances of identifying genes that are not yet known to be involved in immune response but might play a role in the response to infection with a particular pathogen.
In this case study, we have shown that using transcriptome data can broaden the view by including genes that are new in the context of immune response. Placing transcriptome and other experimental data in a broader biological context by correlating such data with other information can help prevent the amount of available information becoming overwhelming. Furthermore, such an approach can show possible directions for further analyses.
Case study 2 – Analysis in a bottom-up manner
The classification can also be used by starting with a particular kind or several kinds of available data, to identify ways to query and combine these data. This approach can be used to analyse the data in a systematic manner and to identify novel kinds of analyses that might provide new insights.
For instance, analysing microarray data by identifying genes with significantly different expression levels answers one of the simple questions that can be used to analyse transcriptome data (Fig. 1). This approach and a threshold of 2·5-fold change were used to analyse microarray experiments carried out to study the immune response of mice to T. muris. The analysis revealed that 107 genes are differently expressed in AKR and BALB/c mice on day 19 post-infection in the gut with 49 genes being down-regulated and 58 genes being up-regulated. The up-regulated genes include Casp1, Casp4, Casp8, and Cycs. The same analysis has been used for transcriptome data of the mesenteric lymph node (MLN). This shows that at day 19 post-infection, 163 genes are differently expressed. Of these, 74 genes are down-regulated and 89 genes are up-regulated, including Casp1 and Gzmb. However, without correlating this information to biological knowledge, this might not provide enough information to understand the relationships amongst these genes.
By using a slightly different approach (starting from a different point of view) to analyse the transcriptome data and focusing on genes in a particular pathway, one might be able to place the observed changes in expression levels in a biological context. Instead of starting with an analysis of the microarray data by excluding genes with expression levels below a certain threshold, the following question has been used to identify all genes involved in a particular pathway of interest “Which genes are involved in a particular pathway e.g. caspase cascade in apoptosis?”
This is one of the simple questions that can be used to analyse metabolome and control data sets (see Fig. 1). This analysis shows that the following are all involved in the caspase cascade in apoptosis pathway: Adprt1, Apaf1, Arhgdib, Birc2, Birc3, Birc4, Casp1, Casp2, Casp3, Casp4, Casp7, Casp8, Casp9, Cycs, Dffa, Gzmb, Lmna, Lmnb1, Lmnb2, and Prf1. Following the analysis of metabolome and control data shown in Fig. 1, and correlating this information with expression levels of genes, lead to the following question, a composition of simple questions, to be asked “What are the expression levels of all genes involved in a particular pathway e.g. caspase cascade in apoptosis in a particular data set?”
Using this question to analyse the expression levels of genes involved in this pathway at day 19 post infection in gut and MLN reveals the following. Casp1, Casp4, Casp8, Cycs, and Gzmb are up-regulated in the gut but the expression level of Gzmb is below the applied threshold of 2·5-fold change. In MLN, the following genes are up-regulated: Casp1, Gzmb, Casp4, Arhgdib, Lmnb2, Cycs, Casp8, Birc4, and Adprt1. The first two are regulated above the applied threshold while the remainder are below.
This analysis of transcriptome data shows that there is a difference in expression levels in genes involved in the caspase cascade in the apoptosis pathway at day 19 post-infection. However, only 4 genes in this pathway have an expression level above 2·5-fold change in the gut and the expression levels of only 2 genes meet this threshold in the MLN. This fairly small number of genes might not have been spotted in the large number of genes with significant changes in expression levels.
However, it might prove useful to include genes that are up- or down-regulated but do not meet the applied threshold to find an answer to the following complex question at the next level of the classification (Fig. 1) “Which pathways are differently activated in susceptible and resistant mice?”
As shown in this analysis, a different activation of genes involved in caspase cascade in apoptosis can be observed. Application of the same analysis to other apoptosis-related pathways, such as apoptotic signalling in response to DNA damage or role of mitochondria in apoptotic signalling, shows a similar pattern suggesting a different activation of apoptosis pathways in the susceptible and resistant mouse strains. These findings will be corroborated experimentally to determine the significance for the different outcomes of infection in AKR and BALB/c mice and to answer the following biological question from this analysis (see Fig. 1) “Which of the differently activated pathways in susceptible/resistant mice are significant in determining host-protective immunity?”
However, by ranking the genes according to their expression levels and applying a threshold to exclude genes with non-significant changes in expression levels, this information could have been missed.
The classification can thus be used to identify approaches that differ from the usual approach of analysing experimental data. This can mean analysing experimental data from a different perspective, such as pathways or functional annotation, and can reveal information that might otherwise have been overlooked. Thus, the approach taken to analyse experimental data is important. Exploring data from different perspectives can yield novel information and generate new hypotheses to be tested experimentally.
Furthermore, the classification can be used as an analysis of requirements for bioinformatics tools for immunology. It indicates the kinds of analysis tasks that have to be provided to allow users to analyse the integrated data in a biologically meaningful and context-rich manner. Applications for answering simple questions and their combinations can be implemented quite easily, whereas in order to answer the more complex questions, sophisticated analysis techniques are required.
The classification has been used in this manner to allow users to query different kinds of data integrated in the mouse Genome Information Management System (GIMS) (Cornell et al. 2003). So far, most of the simple questions and some of their combinations are provided by the system. The system will be extended to answer more questions at different levels of abstraction and complexity to provide the means for analysing the stored data in a systematic way.
DISCUSSION
We have presented a systematic classification of tasks for immunological bioinformatics that can be applied to analyse experimental data. Several different levels of questions have been identified which are either data-driven or driven by immunological knowledge. These are based on a classification of available and relevant data sources and of immunological knowledge. Simple data-driven tasks can be combined to form more complex tasks, which again can be combined to answer higher level questions.
Furthermore, we have shown ways to deploy this classification. It can be used for identifying different ways to analyse and combine available data. It can also be used to identify the questions that need to be asked and the types of data that need to be analysed in order to answer more general questions. This would allow insights to be gained into the immune system with its range of available effector mechanisms. Both ways of deploying the classification have been illustrated using case studies of the immune response in mice to infection with the intestinal nematode parasites T. muris and H. polygyrus.
It is also possible to use the classification as a set of requirements to guide the development of data analysis software for immunology. Such a disciplined approach can provide the users of the software with structured facilities to query and analyse its stored contents in a context-rich and meaningful manner. Several of the simple questions and their compositions have been implemented in GIMS, which has in turn been used to explore the case studies presented in the paper.
To evaluate the usefulness of our classification beyond the two case studies presented above, we have chosen to consider some recent studies of high-throughput data. These have been chosen in the context of infection with a range of diverse pathogens and we have placed the analyses undertaken in these studies in our classification scheme. Even though these studies examine different aspects of immunology, most of them use similar approaches to analyse gene expression data. The studies include the response of the host to infection (e.g. Domachowske et al. 2002; Ji et al. 2003; Cook et al. 2004; Tong et al. 2004), the infecting agent in its efforts to evade the immune system of the host (e.g. Dahl et al. 2003), the interaction between host and pathogen (e.g. Blader et al. 2001), and the reaction of an immunized host to infection (e.g. Rahn, Redline and Blanchard, 2004; Byon et al. 2005).
The data were analysed from the bottom by identifying differently expressed genes, mainly using a fold-change approach. This was followed by the identification of the functional characteristics of these genes or the pathways in which they are involved. Therefore, the analysis tasks used at the first two levels of the classification starting from the bottom (see Fig. 1 and supplementary data file 2) were mainly the following questions. Simple question, “Which genes are differently regulated?” Composition of simple questions, “Looking at differently regulated genes and their functional annotation, do they have different annotations or do they share annotations?” or “Looking at differently regulated genes, in which pathways are they involved?” However, slight differences in the analysis approaches can be seen. For example, Domachowske et al. (2002) focused on genes with a particular function: in this case genes involved in the antiviral inflammatory response. Cook et al. (2004), however, combined microarray analysis with QTL analysis to identify candidate genes located in QTL regions that are differently expressed in resistant and susceptible mice. These varied approaches are also seen to fit well within our classification scheme (see Fig. 1 and supplementary data file 2).
Based on the aspects of immunology examined in these studies, the more general analyses cover a broad range. These include a comparison of expression patterns over time post-infection (e.g. Blader et al. 2001; Ji et al. 2003; Tong et al. 2004) or time post- vaccination of the host (Byon et al. 2005). Also included are comparisons of expression patterns between infections with different strains of pathogen (e.g. Dahl et al. 2003), between different pathogens (e.g. Blader et al. 2001), and between immunized and non-immunized challenged hosts (Rahn et al. 2004). However, all of these questions are part of the classification presented here (see ). They represent just a few of the many possible approaches to analysing high-throughput data and correlating it with other available information. Therefore, the classification is applicable to studying many different aspects of immunity to a broad range of pathogens. It can also be used to identify more analysis tasks that can be carried out on the available data and can help to explore the data more systematically and more thoroughly.
The classification by no means contains a complete list of questions that can possibly be asked to unlock the complexity of the immune system. Nor does it provide a complete list of available and relevant data sources. However, to the best of the authors' knowledge it is the first attempt to classify tasks and data that are of relevance to immunology in a systematic way. We believe that new questions and kinds of data that will arise with the advent of new high-throughput techniques can be placed into the existing classification scheme.
The authors would like to thank Andy Brass, Chris Garwood, Phil Lord, and Mike Cornell for valuable comments on the classification and the manuscript. This work was supported by the Wellcome Trust (grant reference numbers 068639 and 044494).