INTRODUCTION
The role of paleoecology in determining how Amazonian ecosystems responded to long-term past climate change is of paramount importance, given its relevance for understanding the fate of Amazonia under future climate change. Particular focus should be given to ecotonal regions of Amazonia, where humid evergreen forests form boundaries with, or grade into, savannas and/or semideciduous tropical dry forests. Rainforest taxa at these ecotones exist near to their climatic limits and should therefore be highly sensitive to climate change. Existing paleoecological records have demonstrated this vulnerability, with evidence for climate-induced expansion of savanna and/or dry forests during the last glacial maximum (LGM) and the middle Holocene in ecotonal eastern Amazonia (e.g., Absy et al., Reference Absy, Cleef, Fournier, Martin, Servant, Sifeddine and Ferreira da Silva1991; Hermanowski et al., Reference Hermanowski, da Costa and Behling2012; Fontes et al., Reference Fontes, Cordeiro, Martins, Behling, Turcq, Sifeddine, Seoane, Moreira and Rodrigues2017; Reis et al., Reference Reis, Guimarães, Souza-Filho, Sahoo, de Figueiredo, de Souza and Giannini2017) and southern Amazonia (Mayle et al., Reference Mayle, Burbridge and Killeen2000; Burbridge et al., Reference Burbridge, Mayle and Killeen2004; Carson et al., Reference Carson, Whitney, Mayle, Iriarte, Prümers, Soto and Watling2014). However, the paucity of these paleorecords means that considerable uncertainty exists as to the full nature and extent of these biome shifts.
Unfortunately, finding suitable paleoecological sites is often a challenge in this region. The dynamic hydrology of Amazonia means that long-lived, permanent lake basins are uncommon (Colinvaux et al., Reference Colinvaux, Miller, Liu, SteinitzKannan and Frost1985; Latrubesse, Reference Latrubesse, Bengtsson, Herschy and Fairbridge2012). Small oxbow lakes are widespread, but they rarely have sediment records that span the multi-millennial timescales needed to capture long-term climate change (Toivonen et al., Reference Toivonen, Mäki and Kalliola2007; Latrubesse, Reference Latrubesse, Bengtsson, Herschy and Fairbridge2012; Rodriguez-Zorro et al., Reference Rodríguez-Zorro, Enters, Hermanowski, da Costa and Behling2015).
In the absence of suitable lake sediment records, bogs and palm swamps are often targeted for paleoecological analysis. However, their value is often called into question due to uncertainty over whether their pollen archives reliably capture the history of local terrestrial vegetation beyond the bog/swamp, or instead merely reveal the history of swamp/bog vegetation growing within the basin itself. In the latter case, they are of little use for paleoecologists seeking to understand Holocene/Quaternary forest dynamics. Such concerns are borne out by pollen records from sites such as the Pantano de Monica palm swamp in the central Colombian Amazon (Behling et al., Reference Behling, Berrio and Hooghiemstra1999) and the Vereda de Águas Emendadas palm swamp in central Brazil (Barberi et al., Reference Barberi, Salgado-Labouriau and Suguio2000), both of which are dominated by swamp taxa (e.g., palms and sedges) through much of the Holocene. Furthermore, because key pollen taxa such as grass and sedge can only be identified to family level (Poaceae and Cyperaceae, respectively), it is often unclear whether their presence signifies semi-aquatic species growing within the swamp (e.g., floating sedge mat) or instead open, seasonally flooded savanna beyond the swamp.
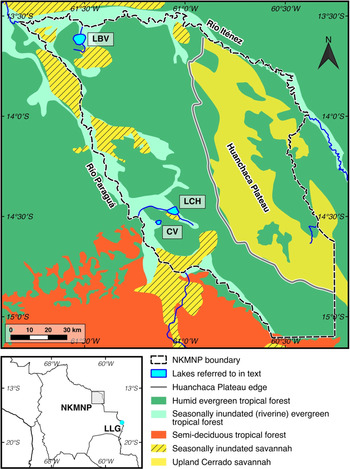
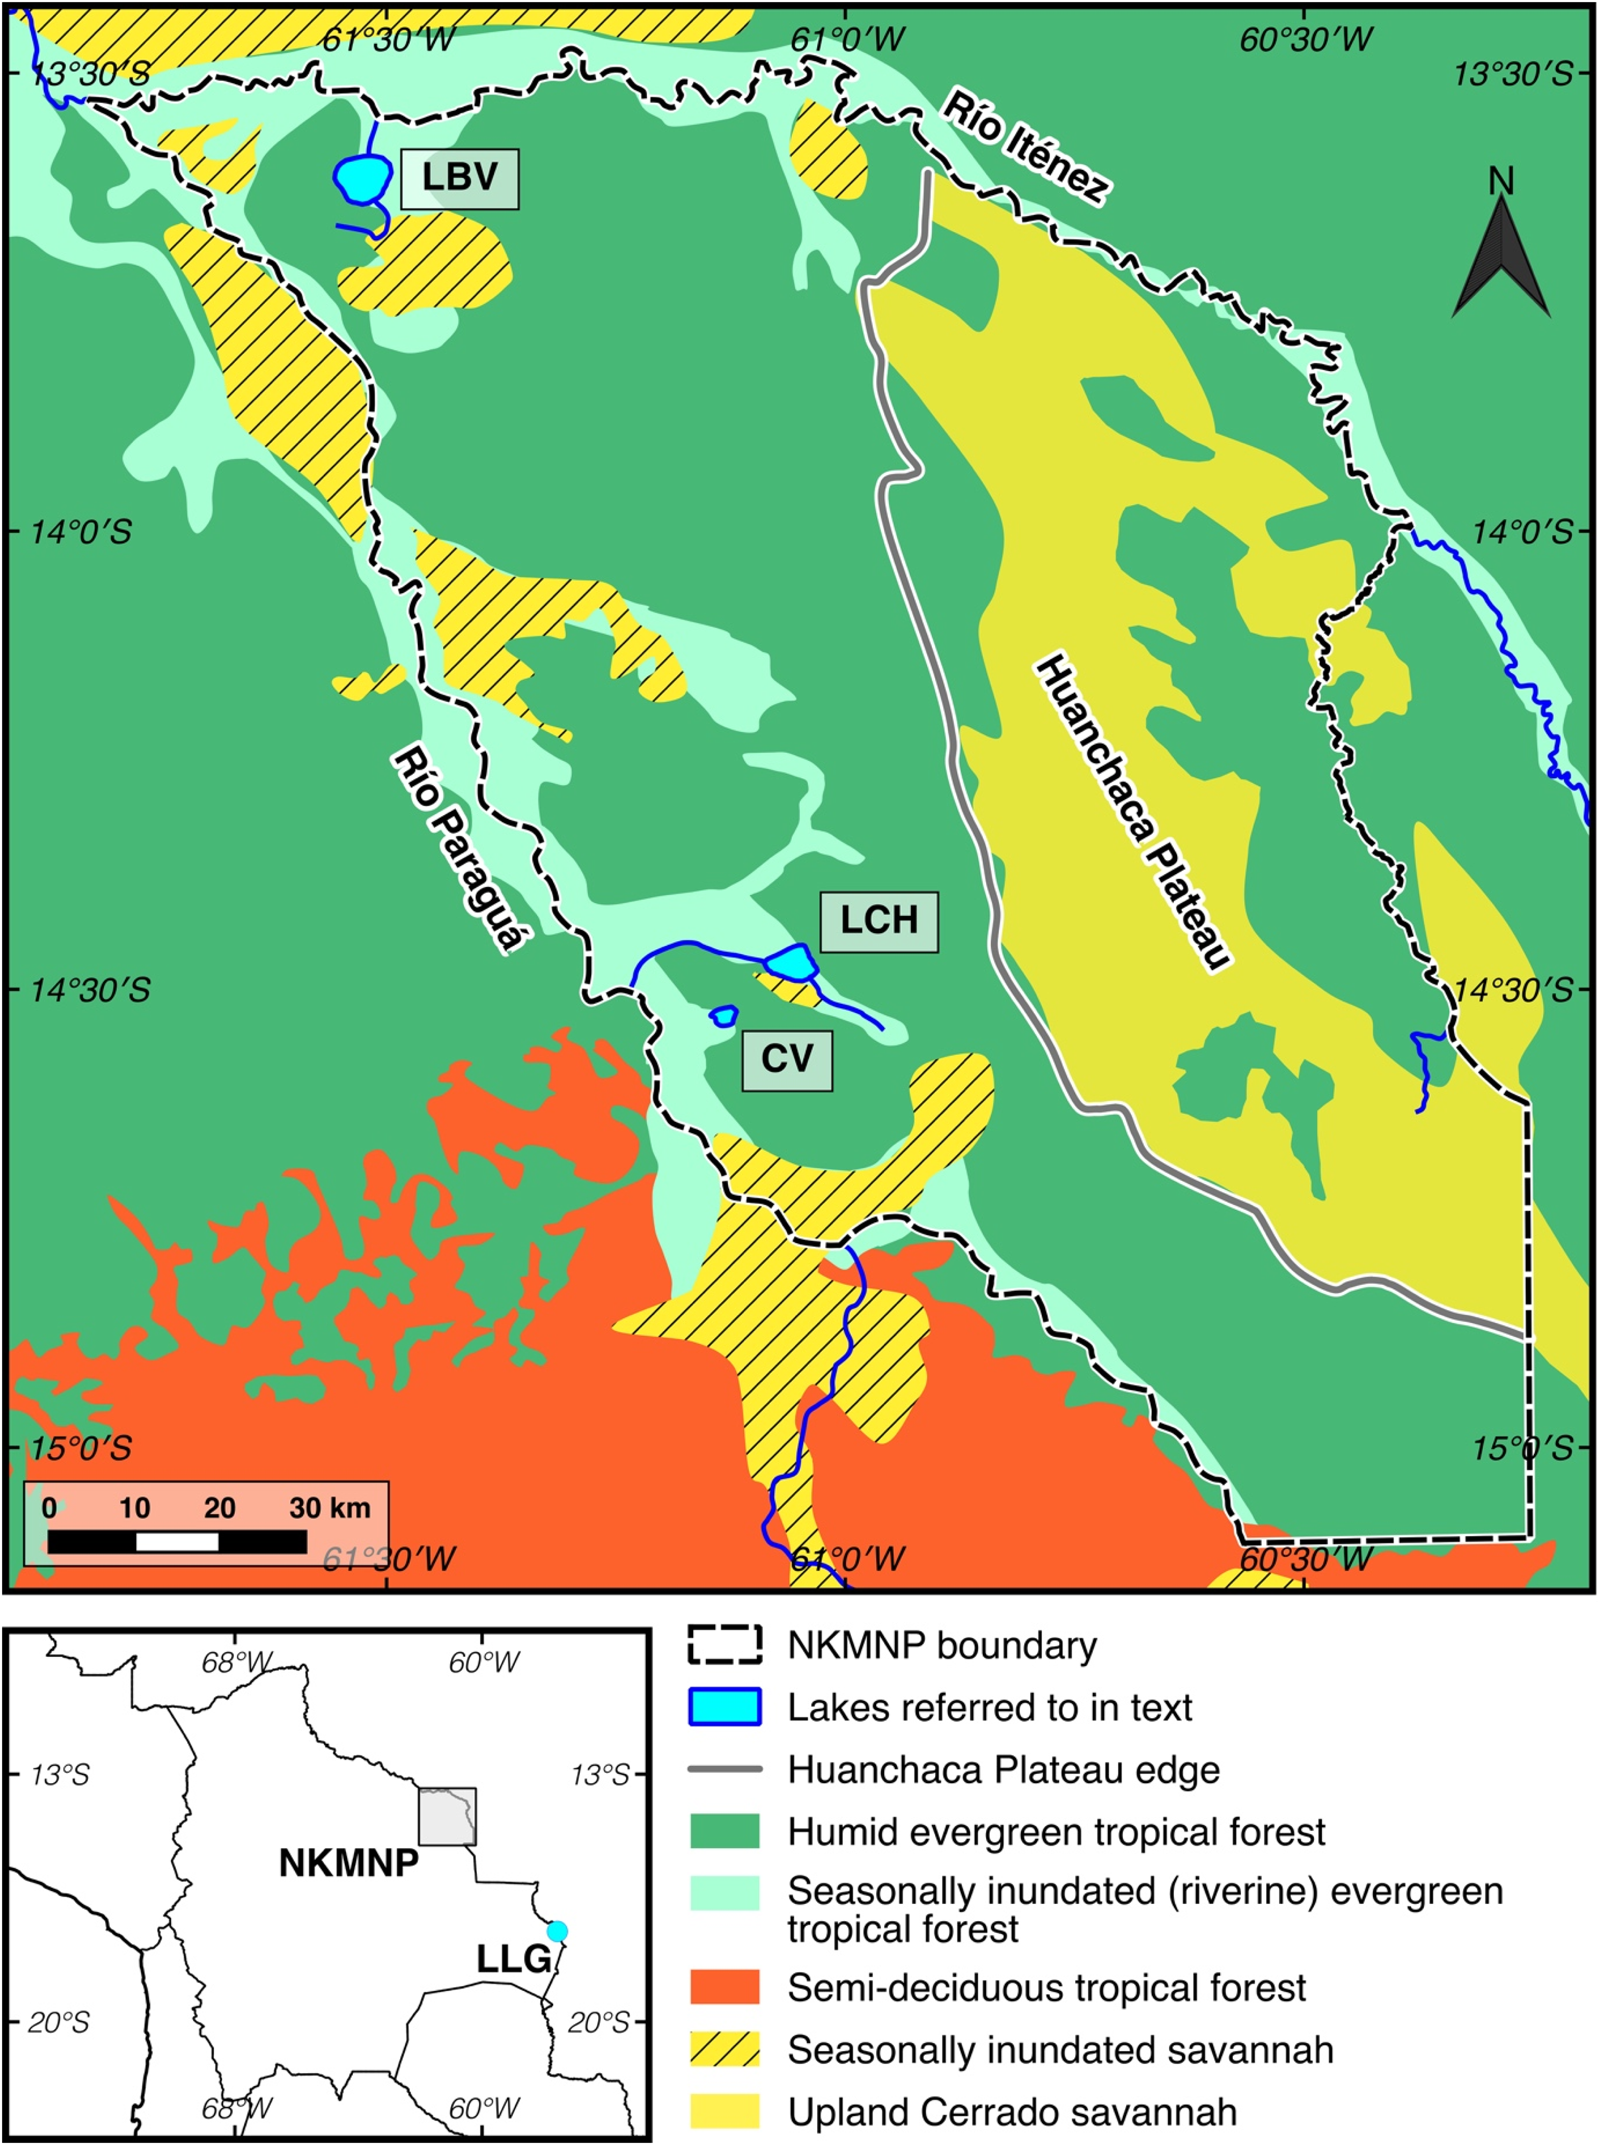
Here, we present the results of a natural experiment, whereby analysis of fossil pollen records from a small palm swamp and an adjacent large lake provides a rare opportunity to determine the potential for palm swamps to reliably record glacial-Holocene terrestrial vegetation histories, or merely a history of swamp vegetation. We present a 24,000-yr fossil pollen record from CV palm swamp located in Noel Kempff Mercado National Park (NKMNP), northeastern Bolivia (southern Amazonian forest-savanna ecotone; Fig. 1 and 2). The current state of knowledge of the late Quaternary paleoecology of this region is predominantly based on the pollen records from two large lakes: Laguna Bella Vista (LBV) and Laguna Chaplin (LCH; Fig. 1 and 2; Mayle et al., Reference Mayle, Burbridge and Killeen2000; Burbridge et al. Reference Burbridge, Mayle and Killeen2004). These records demonstrate that most of the regional catchments of these two lakes, which are today dominated by humid evergreen rainforest, were previously characterized by a mosaic of savanna and semideciduous dry forest communities during the LGM and early/middle Holocene under drier-than-present climatic conditions. The regional climate became gradually wetter through the late Holocene, causing the progressive replacement of savanna and dry forest by humid evergreen rainforest, which expanded in the northern part of NKMNP ~3000 cal yr BP (around LBV) and attained current levels in the south of the park (around LCH) by ~750 cal yr BP (Mayle et al. Reference Mayle, Burbridge and Killeen2000; Burbridge et al. Reference Burbridge, Mayle and Killeen2004).
(color online) Map of Noel Kempff Mercado National Park (NKMNP), showing modern-day vegetation distribution and the location of sites referred to in the text: Cuatro Vientos (CV), Laguna Chaplin (LCH), Laguna Bella Vista (LBV), and Laguna La Gaiba (LLG).
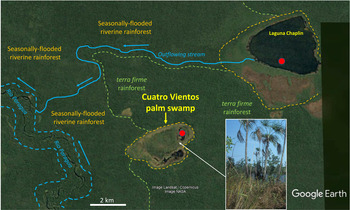
Google Earth image of the Cuatro Vientos (CV) palm swamp and Laguna Chaplin (LCH) in relation to the Río Paraguá. The dotted lines depict the Río Paraguá, the perimeters of the CV and LCH basins, and the margin between the seasonally flooded riverine rainforest and the inter-fluvial terra firme (non-flooded) rainforest. The red dots show the coring locations of the two sites. The photo shows Mauritiella palm and the floating sedge/grass mat in the CV palm swamp. (For interpretation of the references to color in this figure legend, the reader is referred to the web version of this article.)

Cuatro Vientos (CV) palm swamp is located only 6.5 km from LCH; (Fig. 2), and thus presents a unique opportunity to directly compare the paleoecological record of a palm swamp with that of a neighboring large lake (~25 km2 basin). Given the close proximity of these two sites, located within the same vegetation type (humid evergreen rainforest), we expect that they will have undergone the same climatic and regional vegetation changes in the past. Therefore, our assumption is that any differences between the paleoecological records can be attributed to the effects of basin type and/or basin size, thus enabling a robust assessment of the potential value of palm swamps as repositories of paleoecological data in southern Amazonia; e.g., whether they reflect a history of terra firme, climate-driven vegetation change beyond the swamp, or merely a history of a palm swamp community controlled by local hydrological conditions within the basin. The findings of our study may have implications for the interpretation of other palm swamp records elsewhere in the neotropics, as well as criteria for the selection of appropriate sites for paleoecological analyses and palaeo-data syntheses.
If it is found that the Cuatro Vientos record does provide a long-term (multimillennial) record of vegetation changes beyond the swamp itself, the pairing of CV and Laguna Chaplin (LCH) also provides an opportunity to explore the dynamics of local versus regional-scale vegetation changes in the park. This strategy of pairing small and large neighboring sedimentary basins has long been advocated as a sound approach for differentiating local versus regional pollen catchments in mid to high latitude North America and Europe (Jacobson and Bradshaw, Reference Jacobson and Bradshaw1981). In these temperate ecosystems, where most tree taxa are wind-pollinated, modelling approaches based upon pollen productivity and dispersal data have led to quantitative estimates of pollen catchment area, whereby large lakes (>5 km2) have regional-scale pollen catchment areas (> ~50 × 50–100 × 100 km) and are relatively insensitive to localized or patch-size vegetation changes (Sugita, Reference Sugita1994; Sugita et al., Reference Sugita, Gaillard and Broström1999; Davis, Reference Davis2000; Sugita, Reference Sugita2007a), whereas small lakes (< ~0.1–1 km2) instead have local-scale pollen catchment areas (< ~10 × 10 km; Sugita, Reference Sugita2007b). These temperate ecosystem pollen catchment estimates (e.g., 1 km2 cut-off between local versus regional catchments) are unlikely to hold true for humid tropical rainforests due to the different constituent taxa and far greater complexity of pollination syndromes (wind, insects, bats, and birds) associated with these more biodiverse ecosystems. However, in our study area at least, modern pollen rain studies (Gosling et al., Reference Gosling, Mayle, Tate and Killeen2005, Reference Gosling, Mayle, Tate and Killeen2009; Burn et al., Reference Burn, Mayle and Killeen2010) show that wind-pollinated Moraceae pollen dominates rainforest pollen assemblages in NKMNP. The general premise that large lakes and small lakes capture regional- and local-scale pollen rain, respectively, therefore likely holds true, corroborated by Carson et al. (Reference Carson, Whitney, Mayle, Iriarte, Prümers, Soto and Watling2014). The area of the CV swamp basin is ~5 km2, compared with ~25 km2 for the neighboring LCH basin (Fig. 2), thus enabling local-scale vegetation dynamics (CV) to be differentiated from regional-scale vegetation dynamics (LCH).
The local-scale catchment of CV is particularly pertinent given the location of this site at the margin of the riverine forests of the Río Paraguá (Fig. 1 and 2), as this provides a unique opportunity to investigate the Quaternary history of riverine/gallery rainforest. It has previously been proposed that during drier periods of the Pleistocene, when humid evergreen rainforest cover was reduced, rainforest taxa may have survived within refugia provided by riverine gallery rainforest due to the more continuous water supply from the river (Meave et al., Reference Meave, Kellman, MacDougall and Rosales1991; Meave and Kellman, Reference Meave and Kellman1994; Pennington et al., Reference Pennington, Prado and Pendry2000). These gallery rainforest refugia may have provided important routes and source areas for the spread of plant and animal species (Redford and da Fonseca, Reference Redford and da Fonseca1986; Meave et al., Reference Meave, Kellman, MacDougall and Rosales1991; Costa, Reference Costa2003), as well as providing routes for human population expansion (Iriarte et al., Reference Iriarte, Smith, Gregorio de Souza, Mayle, Whitney, Cárdenas, Singarayer, Carson, Roy and Valdes2017). Investigating the extent of gallery rainforests in NKMNP through the late Quaternary may also help to explain the mechanism of rainforest expansion in the late Holocene, e.g., whether the gallery rainforests served to expedite the spread of rainforest taxa in response to climate change (e.g., Mayle et al., Reference Mayle, Langstroth, Fisher and Meir2007). However, the extent to which these gallery rainforests survived through the drier climatic periods of the LGM and middle Holocene in NKMNP is uncertain, given that, until now, only regional-scale vegetation records are available from pollen data from the two large lakes in this area (i.e., LCH and LBV), which lack the spatial resolution to capture changes in the extent of riverine vegetation.
This paper addresses the following questions: (1) How does the Quaternary paleoecological record from a small (~ 5 km2) Amazonian palm swamp (CV) in NKMNP (ecotonal southern Amazonia) compare with that of a neighboring large lake (LCH, ~25 km2), and what does this comparison reveal about the suitability of palm swamps as fossil pollen archives for investigating Amazonia's Quaternary vegetation history? (2) What does the palaeoecological record from CV, located close to a river, reveal about the extent of riverine gallery rainforest in NKMNP during the drier climatic conditions of the LGM and middle Holocene when the interfluves were dominated by savanna and/or semideciduous tropical dry forest? (3) What are the implications of this palm swamp study for assessing the role of gallery forest as rainforest migration corridors or refugia under drier climatic conditions?
STUDY AREA
NKMNP is a 15,230 km2 protected reserve located near the southern margin of the Amazon basin in northeastern Bolivia (Fig. 1; Killeen and Schulenberg, Reference Killeen and Schulenberg1998). The park has been designated a UNESCO world heritage site due to its exceptionally high beta (habitat) diversity and is largely undisturbed by modern anthropogenic land use (Killeen et al., Reference Killeen, Siles, Grimwood, Tieszen, Steininger, Tucker, Panfil, Bradshaw and Marquet2003; Heyer et al., Reference Heyer, Power, Field and van Marle2018).
Geomorphology and regional vegetation
NKMNP is located on the western reach of the Precambrian Brazilian shield, the geomorphology of which splits the park into two distinct landscapes (Fig. 1). To the east, the park is dominated by the Huanchaca Plateau, a table-mountain ~600–900 m above sea level (asl) comprised of Precambrian sandstone and quartzite. The plateau is predominantly covered in upland cerrado savanna vegetation that has been present since at least the end of the last glacial period (Maezumi et al., Reference Maezumi, Power, Mayle, McLauchlan and Iriarte2015). To the west lies a lowland peneplain, where the Precambrian bedrock is blanketed by Tertiary and Quaternary alluvial sediments and is covered predominantly in terra firme humid, evergreen, tropical forest. The clear-water rivers of the Río Iténez and Río Paraguá form the north/eastern and western boundaries of NKMNP, respectively. These rivers and other smaller streams in the park are lined by evergreen riverine forests, usually on the natural levees that form from deposition events during seasonal flooding. Patches of seasonally inundated savanna occur near the rivers where soil drainage is poor. The southern border of NKMNP defines the modern ecotone between the HETF of southern Amazonia and the Chiquitano semideciduous tropical dry forest (SDTF) of eastern lowland Bolivia. The term “semideciduous” is used here to describe the flexible phenologic response (deciduousness) of the constituent trees, depending on the degree and duration of the dry season (Killeen and Schulenberg, Reference Killeen and Schulenberg1998; Killeen et al., Reference Killeen, Jardim, Mamani and Rojas1998). In contrast to the HETF, the SDTF supports a denser understorey vegetation as more light can penetrate the canopy.
Climate
The precipitation regime of the region is distinctly seasonal, predominantly controlled by the South American Summer Monsoon (SASM; Zhou and Lau, Reference Zhou and Lau1998; Raia and Cavalcanti, Reference Raia and Cavalcanti2008; Silva and Kousky, Reference Silva, Kousky, Wang and Gillies2012). The majority of the ~1400–1600 mm mean annual precipitation falls during the wet season during austral summer, with a dry season lasting for ~4–6 months during austral winter. Mean annual temperatures are ~25–26°C, with little monthly variation. However, during austral winter, cold fronts (“surs” or ‘‘surazos”) originating in Patagonia can reach the area and cause temperatures to drop below 10°C for several days (Killeen et al., Reference Killeen, Siles, Grimwood, Tieszen, Steininger, Tucker, Panfil, Bradshaw and Marquet2003).
Site descriptions
CV (14°31′18.5″S, 61°7′11.3″W; elevation ~170 m asl) is a palm swamp, ~5 km2 in area, located in western NKMNP, ~5 km from the Río Paraguá (Fig. 1 and 2). Although it receives river flood waters during the rainy season, it is not an oxbow. As with the large lakes in NKMNP (LCH and LBV), the oval-shaped CV likely formed either as a solution hollow or subsidence along faults of the underlying siliceous rocks of the Precambrian shield. The surrounding vegetation (beyond the palm swamp) consists of terra firme HETF to the east and riverine (riparian) forest of the Río Paraguá immediately to the west. The riverine forests in NKMNP vary in their structure, from young pioneer communities, with trees such as Cecropia, Sapium, and Acacia, through to older communities with later successional tree taxa, particularly from the Moraceae family (e.g., Brosimum lactescens, Pseudolmedia spp., and Ficus spp.). Most of these species are dioecious and wind-pollinated (anemophilous) and are therefore over-represented in the pollen record due to their prolific pollen production (Bush and Rivera, Reference Bush and Rivera2001; Burn et al., Reference Burn, Mayle and Killeen2010). Although similar to communities of terra firme evergreen forests, the riverine forests can be distinguished by their sparse understoreys (due to seasonal flooding), smaller stature, flood-tolerant species, and lower overall species diversity (Killeen and Schulenberg, Reference Killeen and Schulenberg1998; Burn et al., Reference Burn, Mayle and Killeen2010). Growing within the CV basin itself is a floating mat of sedge/grass swamp vegetation, interspersed with small pools of open water and scattered clumps of Mauritiella palm trees.
LCH (14°28′12″S, 61°2′60″W; elevation ~170 m asl) is a large (~12 km2), shallow (2–2.5 m in the dry season), flat-bottomed lake (within a ~25 km2 basin), located ~6.5 km north-east of CV (Fig. 2; Mayle et al., Reference Mayle, Burbridge and Killeen2000; Burbridge et al., Reference Burbridge, Mayle and Killeen2004). The LCH basin is surrounded by HETF, with a mix of seasonally inundated riverine forest (around much of the lake margin and along the small, ephemeral streams that flow in and out of LCH) and terra firme (upland) HETF. Adjacent to the lake, in the southern half of the basin, lies a patch of savanna wetland. Comparison of the modern pollen spectra of the surface sediments of the lake (Burbridge et al., Reference Burbridge, Mayle and Killeen2004) with pollen trap data from all the constituent plant communities in NKMNP (Gosling et al., Reference Gosling, Mayle, Tate and Killeen2005; Burn et al., Reference Burn, Mayle and Killeen2010; Jones et al., Reference Jones, Mayle, Pennington and Killeen2011) reveals that the modern pollen assemblage of this lake originates from both the riverine and terra firme HETF ecosystems in the lake catchment. Crucially, however, the regional-scale pollen source area of this large lake means that differentiation of the relative extent of riverine versus terra firme ecosystems is not possible. Both LCH and CV are located ~30 km from the modern HETF/SDTF ecotone at the southern limit of NKMNP (Fig. 1).
METHODS
Sediment core
CV was cored in August 1995 by F. Mayle with a modified square-rod Livingstone piston corer (Wright, Reference Wright1967). The core location was ~300 m from the eastern edge of the palm swamp (Fig. 2), with the inherent difficulty in traversing swamp environments making it impossible to penetrate further into the basin. The top 20 cm of the core site comprised a floating mat of grasses and sedges. Below this was a ~1 m water column, the bottom of which was well mixed with the soft uppermost sediment, making it difficult to determine the depth of the sediment-water interface. Therefore, core depths were recorded by reference to the top of the floating mat vegetation (FMV). A 154-cm core was recovered, between 155 and 309 cm below the surface of the FMV. Unfortunately, the sediment above 155 cm was too soft to be recovered. Lithological descriptions are based on the color (using a Munsell soil color chart) and texture of the sediment core. Loss-on-ignition (LOI) analysis was carried out at 4-cm intervals through the CV core. After drying at 100°C for 24 hours, each 1-cm3 sample was combusted at 550°C for 2 hours (LOI550). The relative loss of weight before and after combustion determines the percentage organic carbon content that was present in that sample (Dean, Reference Dean1974; Heiri et al., Reference Heiri, Lotter and Lemcke2001).
Chronology
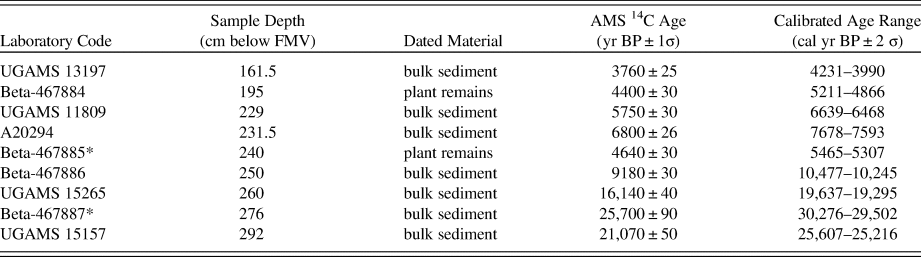
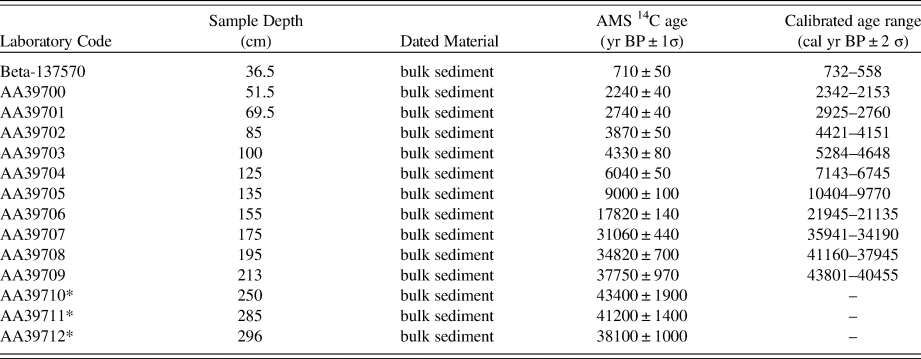
The chronological framework for CV is based on nine accelerator mass spectrometry (AMS) radiocarbon (14C) dates (Table 1). Due to the absence of sufficient plant macrofossils, the majority of the dates were obtained from non-calcareous bulk sediment. However, two of the samples (Beta-467884 and Beta-467885) contained enough decayed plant remains during pretreatment to be dated. All samples selected for dating were treated to remove any carbonates, and the plant remains were treated to remove mobile humic acids. Radiocarbon ages were calibrated using the IntCal13 calibration curve (Reimer et al., Reference Reimer, Bard, Bayliss, Beck, Blackwell, Bronk Ramsey and Buck2013), and a chronology was constructed using the Bayesian age modelling software Bacon v2.3.4 (Blaauw and Christen, Reference Blaauw and Christen2011). The IntCal13 calibration curve was chosen over SHCal13 because of the hydrological connection of the study area to the Northern Hemisphere, via the SASM (McCormac et al., Reference McCormac, Hogg, Blackwell and Buck2004; Hogg et al., Reference Hogg, Hua, Blackwell, Niu and Buck2013).
List of the accelerator mass spectrometry radiocarbon dates from the Cuatro Vientos sediment core. *, dates not included in age-depth model.
Pollen analysis
The CV core was subsampled for pollen analysis at 4-cm intervals, apart from between 220–252 cm where subsamples were taken at 2-cm intervals. The last 29 cm of the core (280–309 cm) was unsuitable for pollen analysis as the sediment had oxidized, preventing pollen preservation. For each horizon, 1 cm3 of sediment was prepared for pollen analysis using standard protocols (Faegri and Iversen, Reference Faegri and Iversen1989), including hot treatments of 40% HF and 10% NaOH. Samples particularly rich in clay were given pretreatments of hot 5% sodium pyrophosphate to help disperse the clays, but were not subjected to a fine-sieving stage to ensure small grains (<5 μm) were retained. A known concentration of the exotic marker spore Lycopodium clavatum was added to each sample so that absolute pollen concentrations could be calculated (Stockmarr, Reference Stockmarr1971). Prepared samples were mounted in silicone oil and were counted to the standard 300 Terrestrial Land Pollen (TLP) sum. Cyperaceae pollen was included in the TLP sum (as per LCH; Burbridge et al., Reference Burbridge, Mayle and Killeen2004) as this taxon is important in the seasonally flooded savannas of the study region. Pollen identifications were made with reference to published tropical pollen atlases (Roubik and Moreno Patiño, Reference Roubik and Moreno Patiño1991; Colinvaux et al., Reference Collinvaux, De Oliveira and Moreno Patiño1999; Lorente et al., Reference Lorente, Buso Junior, De Oliveira and Pessenda2017), a freeware digital database of neotropical pollen (Bush and Weng, Reference Bush and Weng2007), and an extensive modern neotropical pollen reference collection of >1500 specimens housed at the laboratory of the Tropical Palaeoecology Research Group, University of Reading. Pollen of the Moraceae/Urticaceae families were grouped into a single ‘Moraceae’ category (with the exception of Cecropia). It is notoriously difficult to distinguish between these families and their genera, and given the grains from CV were often obscured or damaged, there was little confidence in genus-level identification, even with the help of published morphological descriptions (Burn and Mayle, Reference Burn and Mayle2008). Zones for the pollen data were drawn based on a stratigraphically constrained cluster analysis by incremental sum of squares (CONISS; Grimm, Reference Grimm1987), with the number of statistically significant zones evaluated using the broken-stick model (Bennett, Reference Bennett1996). All analyses and plotting of the pollen data were performed in R (v.3.4.4), using the rioja (v.0.9-15.1) and vegan (v.2.4-6) packages (Juggins, Reference Juggins2017; Oksanen et al., Reference Oksanen, Blanchet, Kindt, Legendre, Minchin, O'hara and Simpson2018).
LCH core
LCH was cored in 1998 by FM, with the methodology and results of the paleoecological analyses presented in subsequent publications (Mayle et al., Reference Mayle, Burbridge and Killeen2000; Burbridge et al., Reference Burbridge, Mayle and Killeen2004; Maezumi et al., Reference Maezumi, Whitney, Mayle, de Souza and Iriarte2018b). The pollen data from the analyses of LCH are presented here and compared with those of CV to provide the necessary regional-scale, late Quaternary vegetation and climate context for determination of the paleoecological significance of the CV palm swamp fossil pollen record. We replot the LCH data with an updated age-depth model because the original age-depth model was based on simple linear interpolation between consecutive radiocarbon dates (Burbridge et al., Reference Burbridge, Mayle and Killeen2004)—a method no longer favored in the paleoenvironmental community (Blaauw et al., Reference Blaauw, Christen, Bennett and Reimer2018). The chronological framework for LCH presented here is based on 14 AMS 14C dates (Table 2) and, as with CV, uses the Bacon Bayesian age modelling software package (Blaauw and Christen, Reference Blaauw and Christen2011). Note that only the 0–24,000-yr portion of the 40,000-yr LCH pollen record is plotted here, to allow direct comparison with the 24,000-yr CV pollen record.
List of the accelerator mass spectrometry radiocarbon dates from the Laguna Chaplin sediment core, taken from Burbridge et al. (Reference Burbridge, Mayle and Killeen2004). *, dates not included in age-depth model.
RESULTS
CV—core stratigraphy and chronology
Figure 3 shows the age-depth model derived from Bacon. The model used seven of the nine 14C AMS dates, with the dates at 240 cm and 276 cm rejected based on Bacon's outlier identification. The date at 240 cm was based on a particularly small sample size of extracted decayed plant remains, raising the possibility that the younger-than-expected age could be due to down-core movement of the sample. The date at 276 cm is consistently rejected by multiple Bacon runs, as well as through an exploratory run of OxCal's statistical outlier model (Bronk Ramsey, Reference Bronk Ramsey1995, Reference Bronk Ramsey2009), and may be anomalously old due to incorporation of older, reworked sediment. The dates for the top (155 cm) and bottom (309 cm) of the core are based on extrapolation, and so must be interpreted with care.
(color online) Radiocarbon dates, age-depth model and lithological description for Cuatro Vientos.
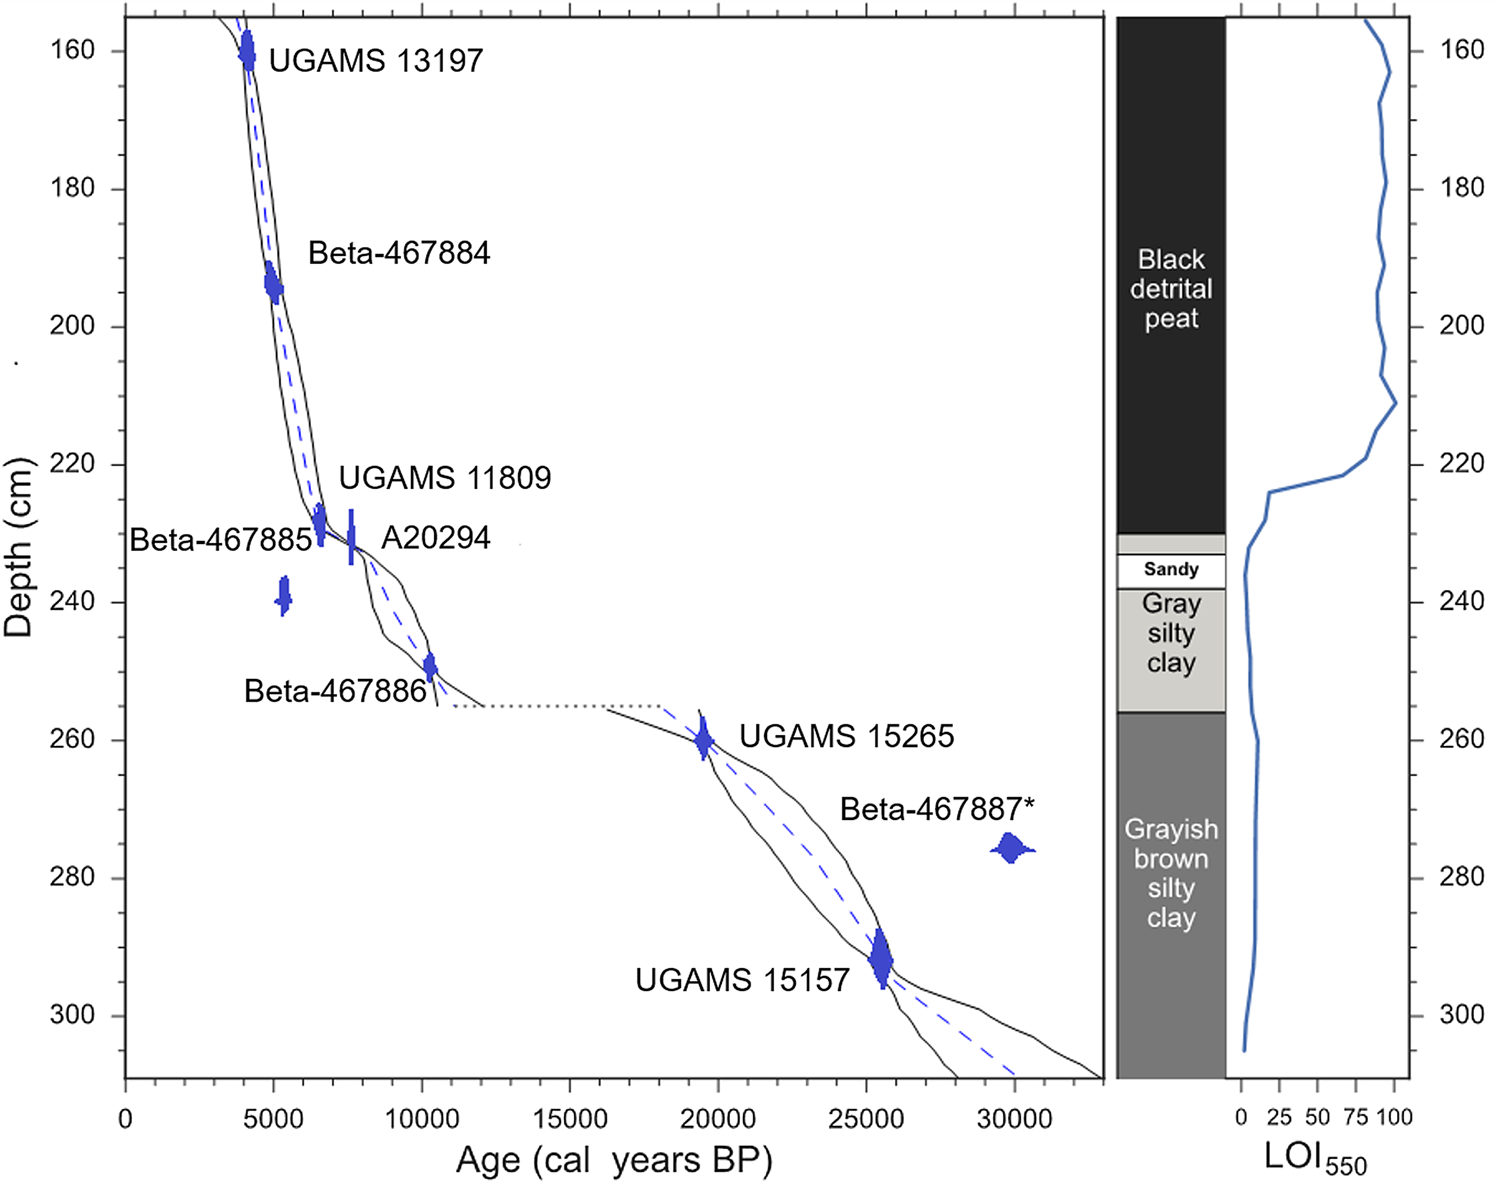
The sediments from CV can be split into three main stratigraphic sections, as follows (Fig. 3).
(1) 309–255 cm
Comprised of inorganic greyish-brown silty clay, with a sedimentation rate of ca. 0.05 mm/yr. The age range of this section is ca. 33,000–28,000 to 19,000–16,000 cal yr BP, corresponding to the late Pleistocene and including the LGM. The upper boundary of 255 cm likely marks a hiatus in the core lasting from ca. 19,000–16,000 to 12,000–10,500 cal yr BP.
(2) 255–230 cm
Comprised of gray, silty clays, with some organic inclusions. This section corresponds to the early Holocene, between ca. 12,000–10,500 and 8000–7500 cal yr BP. A particularly sandy layer of sediment is present within this section, between ca. 238–232 cm where pollen preservation is very poor. Sedimentation rates increase to ca. 0.07–0.1 mm/yr.
(3) 230–155 cm
Comprised of poorly humified black detrital peat with an increased sedimentation rate of ca. 0.2–0.3 mm/yr. The age range of this section is ca. 8000–7500 to 4000–3000 cal yr BP, spanning the middle Holocene and part of the late Holocene.
CV pollen data
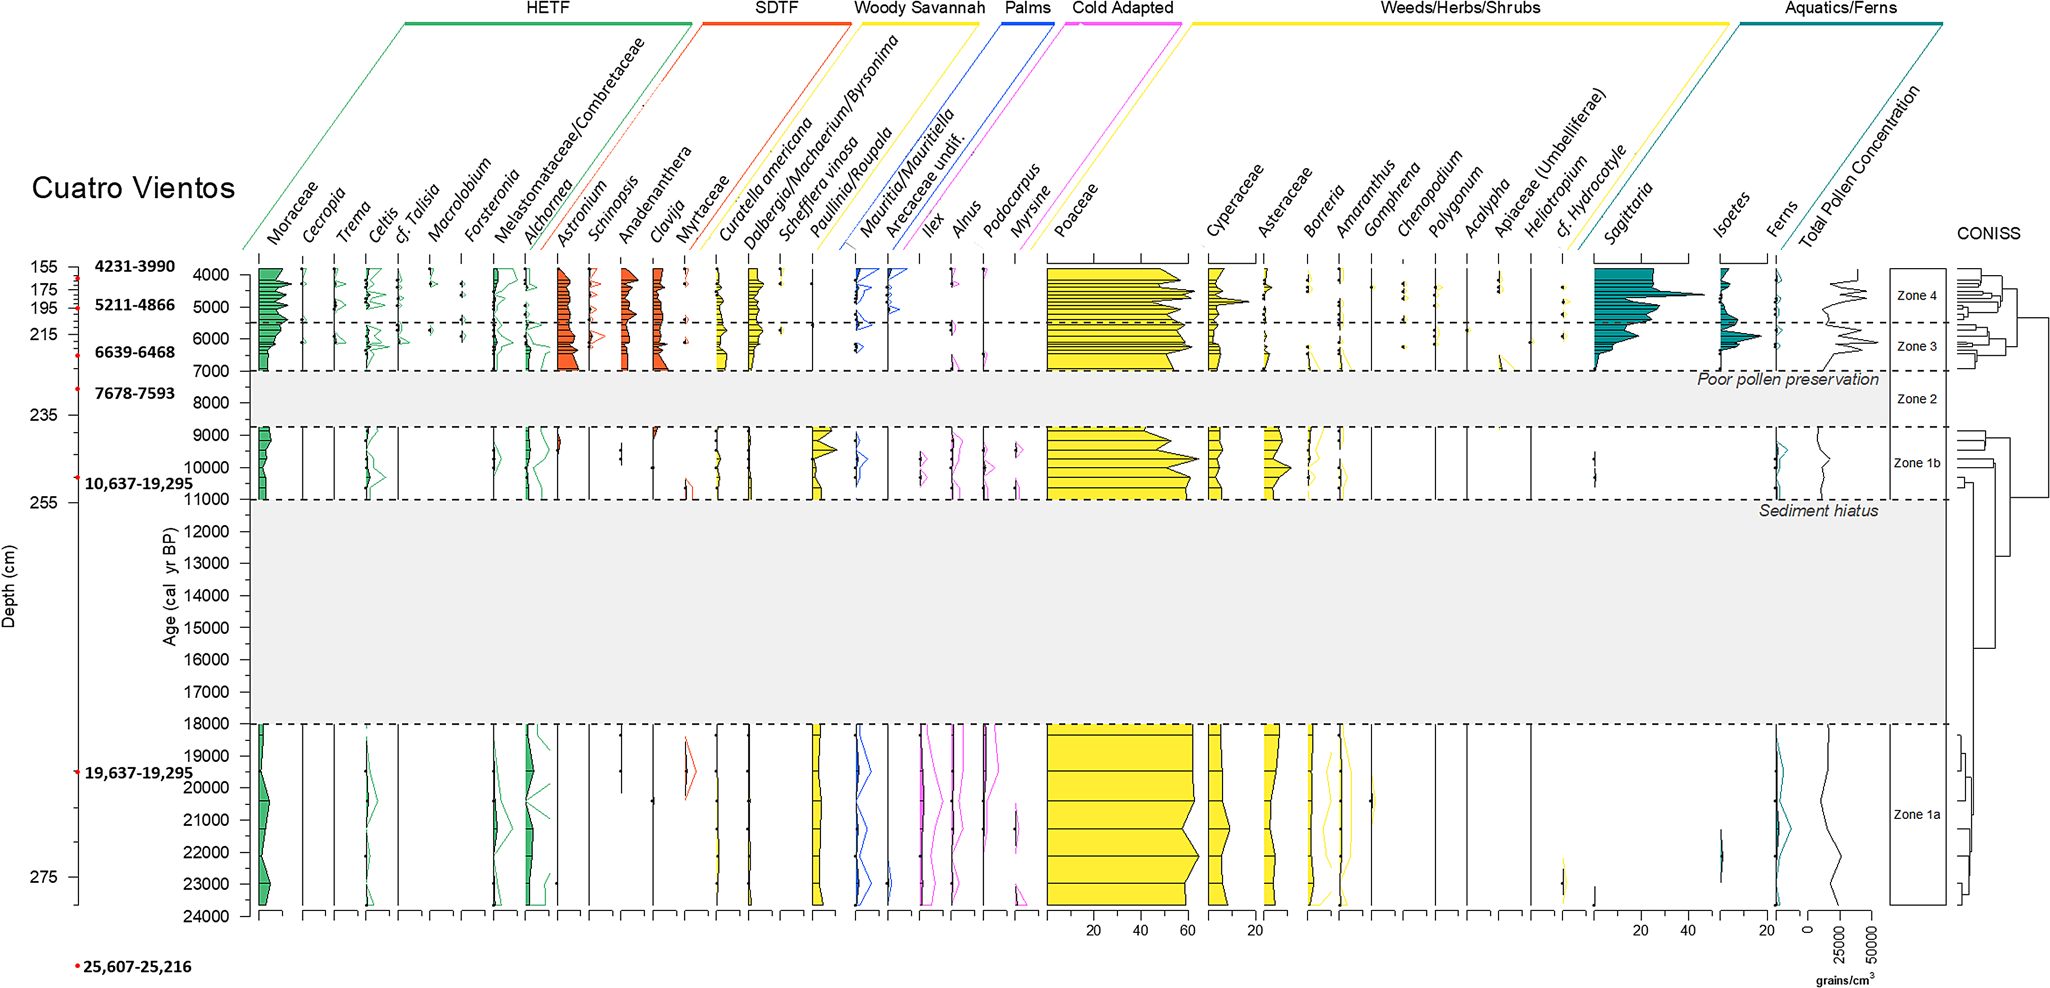
Figure 4 shows the fossil pollen data for the CV core between 155 and 280 cm (below FMV surface). Three statistically significant zones were identified in the cluster analysis, but to aid in interpretation, Zone 1 was split into two sub-zones (before and after the hiatus) and an additional zone was added to mark the period of poor pollen preservation between 239 and 230 cm (Zone 2), thus giving a total of four pollen assemblage zones. The results of CV will be discussed alongside the updated pollen diagram from LCH (Figs. 4–6).
(color online) Pollen percentage diagram of taxa from Cuatro Vientos, plotted against calibrated yr BP. Dots signify <1% abundance. 5× exaggeration is shown for rare taxa.
(color online) Pollen percentage diagram of taxa from Laguna Chaplin, plotted against calibrated yr BP. Dots signify <1% abundance. Zonations are based on the pollen zones of Cuatro Vientos to aid in comparison.

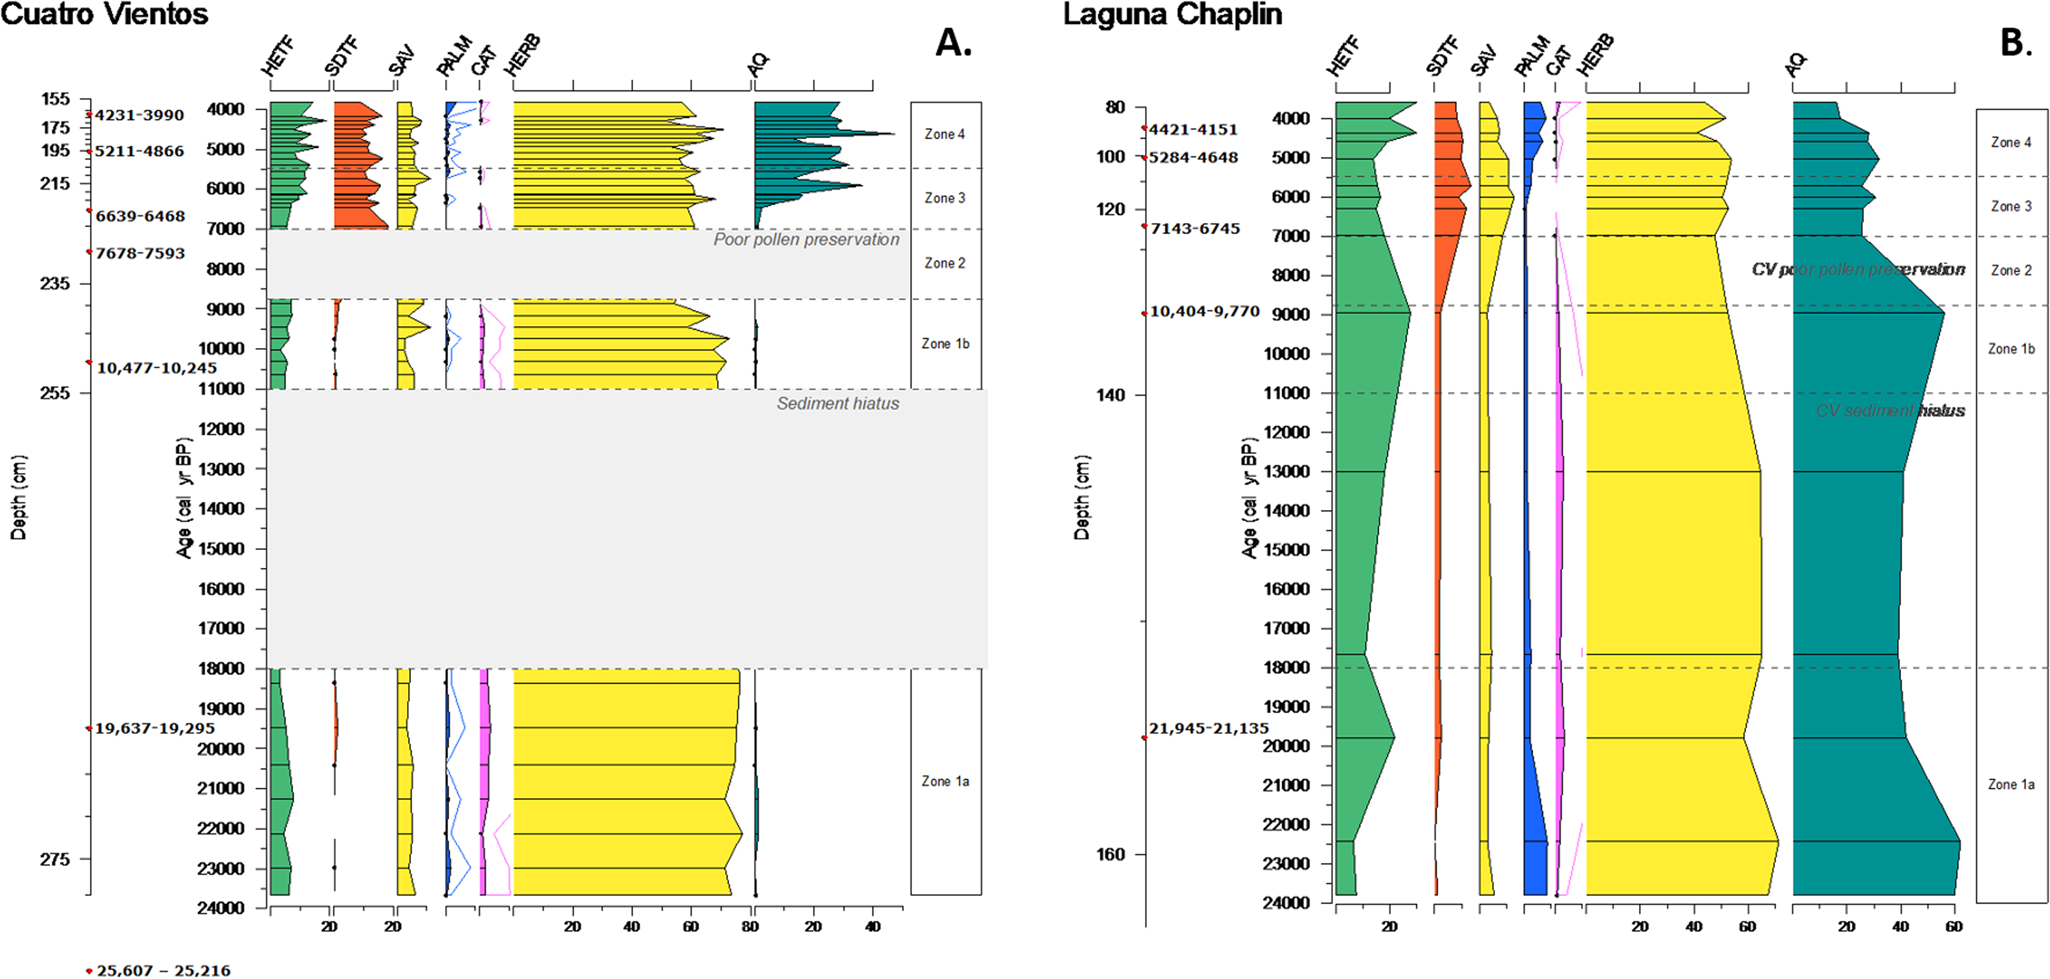
(color online) Summary percentage diagrams for (a) Cuatro Vientos and (b) Laguna Chaplin, for the time period covered by the Cuatro Vientos record (ca. 24,000–3750 cal yr BP). Groupings as in Figures 4 and 5. HETF, humid evergreen tropical forest; SDTF, semideciduous tropical forest; SAV, savanna; PALM, palm trees; CAT, cold-adapted taxa; HERB, herbs, weeds and shrubs; AQ, aquatic/semiaquatic.
Zone 1a and Zone 1b: 280–240 cm, ca. 24,000–8750 cal yr BP (LGM to Early Holocene); includes sediment hiatus ca. 18,000–11,000 cal yr BP
This pollen assemblage has abundant grass (Poaceae, 40–60%) and sedge (Cyperaceae, 5–10%) pollen, and the highest abundance of the herb taxa Asteraceae (5–10%), Borreria (~2%), and Amaranthaceae (~1%). Levels of “cold-adapted” taxa such as Podocarpus, Alnus, and Ilex peak in this zone, although at low levels of up to 1%. This is the only zone to contain any significant amounts of Paullinia/Roupala; levels of this pollen type are consistent at 3–5% for most of the zone, rising to ~10% near the top of the zone. The savanna indicator Curatella americana is present, but in low amounts (<1%). Other arboreal taxa are limited, with low quantities (<3%) of Moraceae, Celtis, Arecaceae (palms), and Alchornea, although Alchornea reaches its highest abundance in this zone. Few grains were recovered of the aquatic/semi-aquatic taxa Sagittaria and Isoetes. In general, the pollen grains recovered in these zones were often degraded. LOI550 values are consistently low (~5–10%) throughout these zones, reflective of the inorganic, silty clay sediment.
Zone 2: 239–230 cm, ca. 8750–7000 cal yr BP (early-middle Holocene)
Pollen preservation in this zone was very poor, most likely a result of the coarse sandy sediment damaging the grains.
Zone 3: 230–206 cm, ca. 7000–5500 cal yr BP (middle Holocene)
During this mid-Holocene section of the core, pollen characteristic of SDTF become established, including Anadenanthera (2–4%), Astronium (5–7%), and the understorey taxon Clavija (3–5%). At the same time, Curatella americana becomes more abundant (2–4%) and Poaceae levels remain consistent at 50–60%. Other arboreal taxa remain at low levels, although Moraceae does increase slightly from 4 to 10%. Palm taxa are uncommon in this zone. Levels of weed and herb taxa (e.g., Asteraceae, Borreria) as well as the “cold-adapted” taxa found in Zone 1, decrease to negligible amounts. The aquatic/semi-aquatic taxa Sagittaria and Isoetes increase throughout this zone, with Sagittaria in particular becoming a large proportion of the total pollen sum (~20%) between ca. 6000–5500 cal yr BP. A sudden increase in LOI550 occurs at ca. 6,000 cal yr BP (from <20 to ~80%), reflecting the switch from clay to organic, peaty sediment (Fig. 3).
Zone 4: 206–155 cm, ca. 5500–3750 cal yr BP (middle to late Holocene)
This zone is similar to Zone 3, with only subtle differences in the abundances in some of the taxa. Moraceae percentages stabilize at ~10%, with other HETF arboreal taxa remaining at low/negligible levels. Palm (Arecaceae spp., Mauritia/Mauritiella) pollen grains have a more consistent presence in the assemblage, being present in most samples within this zone, but only at very low levels (<1%). Curatella americana decreases slightly towards the top of this zone. Sagittaria becomes established at 20–30% of the total pollen sum, with Isoetes decreasing slightly from Zone 3a to values of 0–5%. LOI550 values remain consistent at ~90% through this zone.
INTERPRETATION AND DISCUSSION
Comparison between pollen records of CV palm swamp and LCH
LGM (ca. 24,000–18,000 cal yr BP)
The paleoecological data indicate that the CV basin was markedly different during the LGM compared with today. The scarcity of palms (Arecaceae undiff. and Mauritia/Mauritiella) in the pollen record is a clear indication that, unlike today, there were no substantial stands of palm trees growing on or near the basin during this time. Additionally, Mauritiella palm swamps, such as CV, are characterized by highly organic, peaty sediment. However, this LGM section of the core is characterized by fine-grained inorganic clay sediment (<10% LOI550), suggestive of a low-productivity, low-energy lake rather than a peat swamp. The absence of emergent macrophytes (e.g., Sagittaria, Isoetes) suggests that CV was unsuitable for supporting aquatic/semi-aquatic vegetation, possibly indicating very low water levels and the basin perhaps drying out seasonally. Low water levels would be consistent with the regional paleoclimate reconstructions of a drier LGM in this region, not only from neighboring LCH (Burbridge et al., Reference Burbridge, Mayle and Killeen2004), but also Laguna La Gaiba ~500 km to the south (Whitney et al., Reference Whitney, Mayle, Punyasena, Fitzpatrick, Burn, Guillen, Chavez, Mann, Pennington and Metcalfe2011; Metcalfe et al., Reference Metcalfe, Whitney, Fitzpatrick, Mayle, Loader, Street-Perrott and Mann2014). An intermittently dry basin may also account for the generally degraded nature of the pollen grains in this section of the core, whereby the grains are exposed to short-term oxidation. We acknowledge the possibility that differential pollen preservation of different taxa may conceivably introduce a degree of bias into these pollen assemblages, although no significant taxonomic bias was apparent when counting the pollen.
If our interpretation that CV was an open lake (rather than a palm swamp) at this time is correct, the LGM pollen assemblage would reflect the local vegetation growing outside the basin, rather than within the basin. This gives us confidence that CV is a useful repository of paleoecological data during the LGM, reflecting the history of terra firme vegetation changes beyond the basin. Therefore, any significant differences between the pollen records of LCH and CV will most likely be a result of basin size (i.e., regional versus local pollen catchments, respectively), rather than basin type (i.e., lake versus palm swamp). Although CV today receives flood water from the neighboring, clear-water Río Paraguá during the rainy season, and likely did so throughout its late Quaternary history, we are confident that this riverine pollen input is negligible compared with terrestrial pollen sources to the lake, based on modern pollen-vegetation comparisons from several other flood-water lakes across lowland Bolivia. The latter reveal modern pollen assemblages dominated by pollen inputs from local terrestrial vegetation in the case of small lakes such as Lake Granja (Carson et al., Reference Carson, Whitney, Mayle, Iriarte, Prümers, Soto and Watling2014) or regional terrestrial vegetation with respect to large lakes such as LCH (Mayle et al., Reference Mayle, Burbridge and Killeen2000) and lakes La Gaiba (Whitney et al., Reference Whitney, Mayle, Punyasena, Fitzpatrick, Burn, Guillen, Chavez, Mann, Pennington and Metcalfe2011) and Oricore (Carson et al., Reference Carson, Whitney, Mayle, Iriarte, Prümers, Soto and Watling2014), despite receiving seasonal flood waters from neighboring rivers.
The LGM pollen records from CV and LCH are remarkably similar (Figs. 4–6), both indicating an open landscape covered with grasses, herbs, and sparse tree cover typical of an open savanna. There is abundant Poaceae alongside relatively high percentages of other terrestrial herbs (Borreria and Asteraceae) and Cyperaceae. The modern pollen rain study of Jones et al. (Reference Jones, Mayle, Pennington and Killeen2011), based on pollen trap samples from 1-ha ecological plots within NKMNP, suggests that this type of assemblage may be characteristic of an open seasonally flooded savanna, favoring herbaceous plants that cope better with contrasting seasonal water stresses. Although they are negligible in the CV record, Mauritia/Mauritiella palms are slightly more abundant in LCH, which Burbridge et al. (Reference Burbridge, Mayle and Killeen2004) and Jones et al. (Reference Jones, Mayle, Pennington and Killeen2011) use as further evidence of a seasonally flooded savanna. Nevertheless, Jones et al. (Reference Jones, Mayle, Pennington and Killeen2011) note that the differences between seasonally flooded and terra firme cerrado savanna are subtle, and the LGM landscape was most likely a mix of these two savanna types. The presence of the woody savanna tree Curatella americana is noteworthy as this is a key indicator of savanna environments. Within a seasonally flooded environment, this species typically grows on top of termite mounds to avoid waterlogging (Killeen and Schulenberg, Reference Killeen and Schulenberg1998; Jones et al., Reference Jones, Mayle, Pennington and Killeen2011); this limited growing area may explain the small quantities of Curatella americana in this section of the core, although the fact this species is hermaphroditic and entomophilous (insect-pollinated) will also be a key factor in it being under-represented in the pollen record. Overall, the similarities in the pollen records of CV and LCH show that the local-scale vegetation (CV) was similar to the regional-scale vegetation (LCH), corroborating the interpretations from Burbridge et al. (Reference Burbridge, Mayle and Killeen2004) that much of southern NKMNP was covered in an open savanna during the LGM in response to glacial aridity, lower atmospheric CO2 levels (Monnin et al., Reference Monnin, Indermühle, Dällenbach, Flückiger, Stauffer, Stocker, Raynaud and Barnola2001) and cooler temperatures (Stute et al., Reference Stute, Forster, Frischkorn, Serejo, Clark, Schlosser, Broecker and Bonani1995; Thompson et al., Reference Thompson, Davis, Mosley-Thompson, Sowers, Henderson, Zagorodnov and Lin1998; Whitney et al., Reference Whitney, Mayle, Punyasena, Fitzpatrick, Burn, Guillen, Chavez, Mann, Pennington and Metcalfe2011).
Burbridge et al. (Reference Burbridge, Mayle and Killeen2004) infer that the low levels of arboreal rainforest taxa at LCH most likely indicate scarce communities of HETF regionally, most likely existing as gallery rainforests bordering the Río Paraguá. However, the extent of these gallery rainforests is impossible to determine with the regional-scale pollen catchment of LCH. Given that we have established that the LGM pollen record from CV is representative of vegetation growing beyond its basin, the smaller catchment size of CV and the basin's closer proximity to the Río Paraguá allows us to gain more information about the gallery rainforests at this time. Modern pollen rain studies suggest that a closed-canopy gallery rainforest would be expected to contain Moraceae levels of at least 40%, alongside pioneer species such as Cecropia and potentially small abundances of taxa such as Pouteria, Sapium, and Symmeria (Gosling et al., Reference Gosling, Mayle, Tate and Killeen2005; Burn et al., Reference Burn, Mayle and Killeen2010). However, the LGM pollen assemblages of CV are not indicative of this kind of gallery rainforest. In particular, Moraceae and Cecropia percentages never exceed ~5%, which, given that these taxa are prolific pollen producers and are over-represented in pollen assemblages (Gosling et al., Reference Gosling, Mayle, Tate and Killeen2005; Burn et al., Reference Burn, Mayle and Killeen2010), is strong evidence against a substantial gallery rainforest lining the nearby Río Paraguá.
Following Zone 1a, the sediment hiatus at CV from ca. 18,000–11,000 cal yr BP suggests a period of very dry conditions, perhaps causing the basin to dry out completely. Similar hiatuses or periods of low sedimentation have been identified in other basins across lowland Amazonia during the last glacial period, for example: in NKMNP, LBV (ca. 110 km north of CV) records a hiatus between ca. 42,500–13,000 cal yr BP and LCH records very low sedimentation rates during this period (Burbridge et al., Reference Burbridge, Mayle and Killeen2004); in southeastern Amazonia, hiatuses are recorded on the Serra dos Carajás plateau between ca. 22,000–13,000 cal yr BP (Sifeddine et al., Reference Sifeddine, Martin, Turcq, Volkmer-Ribeiro, Soubiès, Cordeiro and Suguio2001) and at Lago do Saci between ca. 18,200–9200 cal yr BP (Fontes et al., Reference Fontes, Cordeiro, Martins, Behling, Turcq, Sifeddine, Seoane, Moreira and Rodrigues2017); several basins outlined in Ledru et al. (Reference Ledru, Bertaux, Sifeddine and Suguio1998) from across Amazonia and southern Brazil record low sedimentation or hiatuses spanning the LGM.
Early to middle Holocene (ca. 11,000–7000 cal yr BP)
The end of the sediment hiatus at CV occurred at ca. 11,000 cal yr BP and is concurrent with the slight change in the lithology of the sediment, with grayer clays and some organic inclusions. Nevertheless, there is no evidence that the basin changed significantly from the shallow open lake of the LGM; the LOI550 values remain low and there is no change in the levels of sedge, aquatic, or palm taxa. The hiatus termination may indicate slightly wetter conditions in the region, allowing water levels in the basin to rise and for local runoff to increase, inputting more sediment to the basin. The latter is consistent with the paleoclimatic interpretation of increased precipitation levels from ca. 12,200 cal yr BP at Laguna La Gaiba (Whitney et al., Reference Whitney, Mayle, Punyasena, Fitzpatrick, Burn, Guillen, Chavez, Mann, Pennington and Metcalfe2011) and with the hiatus termination at LBV in the north of NKMNP (Burbridge et al., Reference Burbridge, Mayle and Killeen2004). Holocene temperatures were ca. 5°C higher than the LGM, with deglacial warming of tropical South America occurring from ca. 19,500 cal yr BP (Seltzer et al., Reference Seltzer, Rodbell, Baker, Fritz, Tapia, Rowe and Dunbar2002; Whitney et al., Reference Whitney, Mayle, Punyasena, Fitzpatrick, Burn, Guillen, Chavez, Mann, Pennington and Metcalfe2011). Atmospheric CO2 levels in the Holocene were ca. 76 ppm higher than the LGM (Monnin et al., Reference Monnin, Indermühle, Dällenbach, Flückiger, Stauffer, Stocker, Raynaud and Barnola2001). Both temperature and CO2 levels remained relatively stable throughout the Holocene, prior to the industrial period (Indermühle et al., Reference Indermühle, Stocker, Joos, Fischer, Smith, Wahlen and Deck1999; van Breukelen et al., Reference van Breukelen, Vonhof, Hellstrom, Wester and Kroon2008; Whitney et al., Reference Whitney, Mayle, Punyasena, Fitzpatrick, Burn, Guillen, Chavez, Mann, Pennington and Metcalfe2011).
The CV pollen assemblage in Zone 1b (ca. 11,000–8750 cal yr BP) does not differ significantly from that of the LGM Zone 1a, which suggests that the open savanna persisted in the area into the early Holocene. This pollen assemblage is consistent with that of LCH, which is relatively stable from the LGM through most of the Holocene (including through the hiatus phase at CV). Therefore, even with the increase in precipitation at this time (restarting sedimentation at CV), it clearly wasn't enough to support a humid arboreal landscape. The period of poor pollen preservation in the CV core from ca. 8750 to 7000 cal yr BP (Zone 2) is associated with a layer of sandy sediment. This may reflect a period in which fluvial dynamics caused a change in river course so that it flowed near, or even into, CV, therefore creating a higher-energy deposition environment. A higher-energy environment would inhibit deposition of pollen-size particles, instead favoring the deposition of the larger, heavier sand particles, thus potentially explaining the lack of pollen in this section of the core. Additionally, agitation of the pollen grains against the large sand grains could have caused mechanical damage and poor pollen preservation (Twiddle and Bunting, Reference Twiddle and Bunting2010). In the absence of bracketing 14C dates, the rate of accumulation of this sandy layer is uncertain, although it is conceivable that it was deposited very rapidly, perhaps as a single flood pulse from the neighboring river.
Middle Holocene (ca. 7000–5500 cal yr BP)
It has been well established that the middle Holocene was associated with a significantly drier-than-present climate across much of Southern-Hemispheric tropical South America, with peak dryness occurring at ca. 6000 cal yr BP (Baker et al., Reference Baker, Seltzer, Fritz, Dunbar, Grove, Tapia, Cross, Rowe and Broda2001; Wang et al., Reference Wang, Auler, Edwards, Cheng, Ito, Wang, Kong and Solheid2007; Whitney and Mayle, Reference Whitney and Mayle2012; Cheng et al., Reference Cheng, Sinha, Cruz, Wang, Edwards, d'Horta, Ribas, Vuille, Stott and Auler2013; Kanner et al., Reference Kanner, Burns, Cheng, Edwards and Vuille2013; Bernal et al., Reference Bernal, Cruz, Stríkis, Wang, Deininger, Catunda, Ortega-Obregón, Cheng, Edwards and Auler2016). The drier climate has been attributed to lower Southern-Hemispheric summer insolation levels at this time, driven by the precessional cycle of Earth's orbit (Berger and Loutre, Reference Berger and Loutre1991), which would have acted to restrict the southerly migration of the Inter-Tropical Convergence Zone (Haug et al., Reference Haug, Hughen, Sigman, Peterson and Röhl2001) and decrease the strength of the SASM (Cruz et al., Reference Cruz, Vuille, Burns, Wang, Cheng, Werner, Edwards, Karmann, Auler and Nguyen2009; Baker and Fritz, Reference Baker and Fritz2015).
The mid-Holocene section of the CV core is marked by significant changes to the CV basin, in particular, a switch to highly organic (LOI550 values > ~80%), peaty sediment ca. 6000 cal yr BP (Fig. 3). Concurrent with this dramatic lithological change is increased abundance of the aquatic/semi-aquatic macrophytes Sagittaria and Isoetes. These changes suggest a change from a clear, shallow, open lake to a more eutrophic environment with high levels of deposition of organics. We infer that this is the start of the transition of CV from a lake to a palm swamp. The timing of this switch is interesting, given that it occurs at the peak of the mid-Holocene drought at ca. 6000 cal yr BP and previous dry conditions during the LGM were associated with low sedimentation rates and a sediment hiatus at CV. A drier mid-Holocene climate would most likely cause a decrease in water levels at CV, but unlike at the LGM, the closer river channel (as argued for in the early-Holocene Zone 2) would cause intermittent flooding at CV inundating the basin with organic matter and maintaining an anaerobic environment. Nevertheless, it is important to note that there is a great diversity of successional pathways in swamp environments that can be caused by a variety of different factors (Behling and Hooghiemstra, Reference Behling and Hooghiemstra1999; Kelley et al., Reference Kelley, Prentice, Harrison, Wang, Simard, Fisher and Willis2013; Roucoux et al., Reference Roucoux, Lawson, Jones, Baker, Coronado, Gosling and Lähteenoja2013), which may or may not be related to changes in precipitation. It is possible that this change from inorganic lacustrine sediments to a peat swamp environment reflects hydrarch succession of the basin, whereby a critical ecological threshold or “tipping point” has been exceeded.
Despite the change of CV to a swamp basin at this time, we can remain reasonably confident that vegetation growing in the swamp is not masking the influx of pollen from vegetation beyond the swamp. Other than the increase in emergent aquatics (Sagittaria, Isoetes), there are no increases in other taxa that would be expected to grow in a swamp environment and dominate the pollen rain (e.g., Cyperaceae and Mauritia/Mauritiella). Increases in pollen percentages of arboreal taxa that do not grow in a swamp environment (e.g., Astronium and Anadenanthera) are especially significant, as pollen of these taxa must have come from the surrounding terra firme area beyond the perimeter of the basin. Therefore, as with the LGM, this gives us confidence that CV is a useful repository of mid-Holocene paleoecological data, reflecting the history of terra firme vegetation changes beyond the basin.
Considering the clear contrast in the type (palm swamp versus lake) and size (5 versus 25 km2) of the CV basin compared with the neighboring LCH basin, it is perhaps surprising that the pollen records of these two sites are so similar. Both records are indicative of a savanna-SDTF mosaic landscape during this mid-Holocene pollen assemblage. The increased levels of the savanna tree Curatella americana, decreased levels of herbs (e.g., Asteraceae) and negligible amount of palm taxa at both sites may suggest that the savanna component was more indicative of a woody cerrado (non-flooded) savanna, rather than the more open seasonally inundated savanna of the LGM (Jones et al., Reference Jones, Mayle, Pennington and Killeen2011). This interpretation is plausible given that a weaker mid-Holocene summer monsoon would likely mean less flooding (from the neighboring Río Paraguá) in the rainy season and longer dry seasons. The establishment of Anadenanthera and Astronium is good evidence of SDTF being present around the basins at this time, both locally (CV) and regionally (LCH), as these are key components of modern SDTF. The Anadenanthera pollen type is most likely Anadenanthera colubrina, a key drought-tolerant species that is dominant in the modern Chiquitano SDTF region (Killeen and Schulenberg, Reference Killeen and Schulenberg1998; Gosling et al., Reference Gosling, Mayle, Tate and Killeen2009) and a key dry forest indicator, given its absence from both rainforest and savanna ecosystems (Gosling et al., Reference Gosling, Mayle, Tate and Killeen2009). Both Anadenanthera and Astronium are often under-represented in pollen assemblages (<1% in modern pollen traps; Gosling et al., Reference Gosling, Mayle, Tate and Killeen2009); therefore, the relatively high percentages of these taxa (5–7%) suggests they would have been abundant in the area. The similarity between the CV and LCH pollen records provides good evidence that the drier climate of the middle Holocene caused a widespread savanna-SDTF mosaic landscape in the area, at both local (evidenced from CV) and regional (evidenced from LCH) spatial scales.
The shifting river course into and out of CV that we infer from Zones 2 and 3 suggests that the Río Paraguá ran just as close, if not closer, to CV during the middle Holocene compared with present. Therefore, we may expect that CV would capture a strong gallery rainforest signal in the pollen record. However, as with the previous pollen zones, there are only low levels of arboreal rainforest pollen taxa at CV (10% Moraceae), certainly not at the levels (>40% Moraceae) expected from a significant gallery rainforest (Burn et al., Reference Burn, Mayle and Killeen2010). We therefore infer that there was insufficient gallery rainforest in NKMNP to provide significant refugia for rainforest species during the drier climate of the middle Holocene. This is somewhat corroborated by other records in southern Amazonia; for example, Laguna Granja, a small oxbow lake ca. 300 km northwest of NKMNP, also shows reduced extent of gallery rainforests during the middle Holocene (Carson et al., Reference Carson, Whitney, Mayle, Iriarte, Prümers, Soto and Watling2014).
Middle to late Holocene (ca. 5500–3750 cal yr BP)
Following the peak of the mid-Holocene dry period at ca. 6000 cal yr BP, the climate in the region gradually became wetter through the middle to late Holocene (especially after ca. 4,000 cal yr BP; Baker et al., Reference Baker, Seltzer, Fritz, Dunbar, Grove, Tapia, Cross, Rowe and Broda2001; Wang et al., Reference Wang, Auler, Edwards, Cheng, Ito, Wang, Kong and Solheid2007; Whitney and Mayle, Reference Whitney and Mayle2012; Cheng et al., Reference Cheng, Sinha, Cruz, Wang, Edwards, d'Horta, Ribas, Vuille, Stott and Auler2013; Kanner et al., Reference Kanner, Burns, Cheng, Edwards and Vuille2013; Bernal et al., Reference Bernal, Cruz, Stríkis, Wang, Deininger, Catunda, Ortega-Obregón, Cheng, Edwards and Auler2016) in response to progressive strengthening of the SASM driven by gradually increasing insolation levels (Berger and Loutre, Reference Berger and Loutre1991; Cruz et al., Reference Cruz, Burns, Karmann, Sharp, Vuille, Cardoso, Ferrari, Dias and Viana2005; Baker and Fritz, Reference Baker and Fritz2015). In CV Zone 4, the organic, peaty sediment with consistently high LOI550 values is now well-established, indicating that the basin has remained a swamp throughout this zone. Aquatic vegetation is well-represented, with consistently high levels of Sagittaria, possibly outcompeting Isoetes for space and indicating a continued eutrophic status. However, given that the levels of Cyperaceae and palm taxa remain mostly unchanged, it is unlikely that the basin has yet become a palm swamp analogous to that of today (with the floating mats of grass/sedges and clumps of palms growing throughout the basin). The small increase in percentages of Mauritia/Mauritiella pollen is noted, although if these palms were growing abundantly across the CV basin we would expect much higher levels than the 1–3% seen here. Our interpretations are hampered by the absence of surface-sediment samples from CV, which prevents us from determining the pollen signature of the present-day palm swamp. Nevertheless, Mauritia/Mauritiella pollen percentages of between 10–40% are common for other palm swamps across Amazonia (Behling et al., Reference Behling, Berrio and Hooghiemstra1999; Meneses et al., Reference Meneses, Costa, Enters and Behling2015; Rodriguez-Zorro, Reference Rodríguez-Zorro2017; Maezumi et al., Reference Maezumi, Alves, Robinson, de Souza, Levis, Barnett, Almeida de Oliveira, Urrego, Schaan and Iriarte2018a) and are therefore likely representative of the modern CV palm swamp as well.
At both CV and LCH, only small changes occur in the pollen assemblages between Zone 3 and 4, with no changes to the overall interpretation of a savanna-SDTF mosaic vegetation cover, both locally (around CV) and regionally (inferred from LCH). There are some subtle differences, however, that may indicate some minor changes to the vegetation cover. The small increase in Moraceae in Zone 4 may signify a greater proportion of SDTF relative to savanna in the region, given that: (a) an increase to ~40% Moraceae would be expected from significant expansion of HETF or gallery rainforest (Burn et al., Reference Burn, Mayle and Killeen2010), and (b) the presence of Moraceae in the modern pollen rain of savanna ecosystems is predominantly due to long-distance, wind-blown transport from the nearby HETF that was absent in the middle Holocene (Gosling et al., Reference Gosling, Mayle, Tate and Killeen2009; Jones et al., Reference Jones, Mayle, Pennington and Killeen2011). The slight increase in Mauritia/Mauritiella at CV is concurrent with larger increases seen at LCH, which may suggest the resumption of seasonal flooding at some low-lying areas around the basins. Unfortunately, the CV record terminates at ca. 3750 cal yr BP due to the difficulty in acquisition of uppermost sediments beneath a floating mat of sedge/grass. This means that we cannot corroborate the timing of the increase in HETF at LCH from ca. 2500 to 750 cal yr BP (Burbridge et al., Reference Burbridge, Mayle and Killeen2004) or determine when the current hydrology developed or when the expansion of palms across the swamp occurred.
Implications of the paleoecological history of CV
Although great strides have been taken in recent years, the number of paleoecological sites that provide information about the Quaternary vegetation history of tropical South America is well below that of the temperate regions of North America and Europe. A recent mid- to late-Holocene multi-proxy vegetation reconstruction synthesis by Smith and Mayle (Reference Smith and Mayle2018) reports 110 sites across Southern-Hemispheric tropical South America, although many of these sites were non-pollen based and were clustered in southeast Brazil, with significant gaps across eastern and central Amazonia. Far fewer sites extend to glacial times, with Marchant et al. (Reference Marchant, Cleef, Harrison, Hooghiemstra, Markgraf, van Boxel and Ager2009) reporting only 34 sites for the whole of Latin America in a pollen-based biome reconstruction of the LGM. In contrast, there is good spatial coverage of several hundred mid-Holocene sites across North America (e.g., Prentice et al., Reference Prentice, Bartlein and Webb1993; Sawada et al., Reference Sawada, Viau, Vettoretti, Peltier and Gajewski2004; Viau et al., Reference Viau, Gajewski, Sawada and Fines2006) and Europe (e.g., Davis et al., Reference Davis, Brewer, Stevenson and Guiot2003; Wu et al., Reference Wu, Guiot, Brewer and Guo2007; Roberts et al., Reference Roberts, Fyfe, Woodbridge, Gaillard, Davis, Kaplan, Marquer, Mazier, Nielsen, Sugita, Trondman and Leydet2018), with growing numbers in East Asia (e.g., Ni et al., Reference Ni, Yu, Harrison and Prentice2010; Tian et al., Reference Tian, Cao, Dallmeyer, Zhao, Ni and Herzschuh2017). As a result, tropical South America remains poorly represented in global syntheses (e.g., Gajewski, Reference Gajewski2008; Bartlein et al., Reference Bartlein, Harrison, Brewer, Connor, Davis, Gajewski and Guiot2011) and paleodata–model intercomparison projects (e.g., Kohfeld and Harrison, Reference Kohfeld and Harrison2000; Harrison and Prentice, Reference Harrison and Prentice2003; Braconnot et al., Reference Braconnot, Harrison, Kageyama, Bartlein, Masson-Delmotte, Abe-Ouchi, Otto-Bliesner and Zhao2012), despite the important role the Amazon rainforest plays in global biogeochemical cycling (Phillips et al., Reference Phillips, Aragão, Lewis, Fisher, Lloyd, Lopez-Gonzalez and Malhi2009; Pan et al., Reference Pan, Birdsey, Fang, Houghton, Kauppi, Kurz and Phillips2011; Aragão et al., Reference Aragão, Poulter, Barlow, Anderson, Malhi, Saatchi, Phillips and Gloor2014, Reference Aragão, Anderson, Fonseca, Rosan, Vedovato, Wagner and Silva2018).
Increasing the number of sites in tropical regions such as Amazonia is a complicated task, however, and selecting new target sites for paleoecological analysis is limited by site availability. The challenging logistics of fieldwork in Amazonia means that field seasons are often months long and may only yield data from one or two sites. Therefore, researchers may be reluctant to spend limited time and resources to investigate palm swamps for paleoecological study, given the aforementioned concerns over their suitability for recording terrestrial vegetation history from beyond their basin. Consequently, palm swamps are often viewed as ‘sub-optimal’ compared with lakes as targets for paleoecological study. However, key lessons to be drawn from the CV record are that: (a) Amazonian swamp pollen records can provide useful millennial-scale archives of climate-driven, terrestrial vegetation change beyond the swamp margin, and (b) one cannot assume that a palm swamp has always been a palm swamp—a static wetland plant community reflecting purely local-scale basin hydrology, unchanging through time, and unrelated to climate-driven vegetation dynamics elsewhere. Our CV study reveals the importance of considering the potentially dynamic limnological histories of such basins and shows that their present-day characteristics may not be representative of the entire Quaternary sedimentological or catchment history; i.e., Pleistocene lakes with clay sediments have evolved into palm swamps accumulating peat. Within the context of the regional-scale Quaternary vegetation history from neighboring LCH, we have shown that the CV palm swamp was once a lake and contains a fossil pollen archive of local-scale, terrestrial, climate-driven vegetation dynamics extending to the LGM, rather than a localized Quaternary history of a palm swamp plant community. Given the scarcity of Amazonian sedimentary records that extend to the LGM, palm swamps may therefore hold considerably greater value for reconstructing Amazonian Quaternary vegetation change than commonly assumed.
With regards to the history of riverine/gallery rainforests in NKMNP, the CV pollen record shows that gallery (riverine) rainforest was either absent, or highly limited in extent, along the neighboring Río Paraguá during the LGM and middle Holocene. Instead, our pollen data reveal that, during the LGM and middle Holocene, both the interfluves and riverine areas (presently covered by humid rainforest) were instead covered by a mosaic of savanna and dry forest. Therefore, our findings do not support the hypothesis, at least in our ecotonal area of Amazonia, that wide ribbons of gallery rainforest lined the rivers during the LGM and middle Holocene, providing important refugia for rainforest species. Narrower or nonexistent gallery forests during the middle Holocene may have implications for the migration routes of pre-Columbian humans. For example, forest dwelling cultures such as the Tupi-Guarani likely used gallery forests as routes for expansion through non-forested landscapes (Iriarte et al., Reference Iriarte, Smith, Gregorio de Souza, Mayle, Whitney, Cárdenas, Singarayer, Carson, Roy and Valdes2017). If the reduced extent of riverine gallery forests in NKMNP is representative of rivers across ecotonal southern Amazonia, as well as the Cerrado savanna biome to the southeast, it would support the hypothesis that the late Holocene expansion of gallery rainforest (e.g., Silva et al., Reference Silva, Sternberg and Haridasan2008) linking the Amazonian and Atlantic forest biomes facilitated the transcontinental migration of the forest-dependent Tupi-Guarani culture from southern Amazonia to southern Brazil ca. 2000–3000 cal yr BP (Iriarte et al., Reference Iriarte, Smith, Gregorio de Souza, Mayle, Whitney, Cárdenas, Singarayer, Carson, Roy and Valdes2017).
The vulnerability of the gallery rainforests in NKMNP to drier mid-Holocene climatic conditions, revealed from the CV record, raises concern over the fate of ecotonal areas of Amazonia under drier climate scenarios predicted for the mid-to-late twenty-first century (Joetzjer et al., Reference Joetzjer, Douville, Delire and Ciais2013; Boisier et al., Reference Boisier, Ciais, Ducharne and Guimberteau2015; Christensen et al., Reference Christensen, Hewitson, Busuioc, Chen, Gao, Held, Jones, Solomon, Qin, Manning, Chen, Marquis, Averyt, Tignor and Miller2007). Modern field-based ecological impact analyses have shown that tree mortality increases significantly in Amazonian forests in response to severe drought events, although regrowth occurs in subsequent wet years (Phillips et al., Reference Phillips, Aragão, Lewis, Fisher, Lloyd, Lopez-Gonzalez and Malhi2009; Doughty et al., Reference Doughty, Metcalfe, Girardin, Amézquita, Cabrera, Huasco and Silva-Espejo2015; Feldpausch et al., Reference Feldpausch, Phillips, Brienen, Gloor, Lloyd, Lopez-Gonzalez and Monteagudo-Mendoza2016). However, these drought events are likely to become more frequent under a future drier climate and if gallery rainforests are not likely to provide refugia for rainforest species, then the resilience of ecotonal, southern Amazonian rainforest would likely be reduced.
CONCLUSIONS
The fossil pollen data from the CV palm swamp provide a local-scale late Quaternary vegetation history for southern NKMNP, Amazonian Bolivia, spanning the LGM to the middle Holocene. This local-scale vegetation history complements the previously published regional-scale vegetation history obtained from the adjacent large lake, LCH (Mayle et al., Reference Mayle, Burbridge and Killeen2000; Burbridge et al., Reference Burbridge, Mayle and Killeen2004). Our results from CV demonstrate that palm swamps in southern Amazonia have the potential to yield Pleistocene-age paleoecological records that provide information about vegetation on terra firme landscapes beyond the basin itself, rather than simply recording a history of wetland vegetation within the swamp. Comparison between the CV and LCH pollen records reveals both local- and regional-scale evidence for savannas during the LGM, and a savanna/SDTF mosaic during the middle Holocene. These results demonstrate that the paleoecological value of tropical palm swamps, such as CV, is considerably greater than often assumed, with the potential to yield local-scale, glacial–interglacial histories of climate-driven, terrestrial vegetation dynamics. Although a palm swamp today, the CV site was previously an open-water lake during the LGM, demonstrating that the pollen taphonomy and catchment of this basin has changed markedly through time.
Due to its local-scale pollen catchment, and close proximity to the Río Paraguá, the CV pollen record also reveals the history of riverine vegetation in ecotonal, southern Amazonia. We find that drier climatic conditions of the LGM and middle Holocene supported expansion of open savanna, not only in the interfluves, but in riverine areas too, challenging the common assumption that rainforest persisted as refugia in ribbons of gallery rainforest lining the rivers. The absence of significant gallery rainforest during past, drier climatic conditions raises concerns that gallery rainforest may not be resilient to projected future increased drought and may therefore not be relied upon to serve as rainforest migration corridors, as has previously been proposed (e.g., Mayle et al., Reference Mayle, Langstroth, Fisher and Meir2007).
ACKNOWLEDGMENTS
Macarena Cárdenas and John Carson provided assistance with pollen sample processing and pollen identification. R.S. was funded by a NERC “SCENARIO” DTP Ph.D. award (2014–2018). Funding for LOI analysis and five radiocarbon dates was provided to S.Y.M. from the Global Change and Sustainability Center, the Graduate Research Fellowship, and the Don Currey Graduate Research Fellowship at the University of Utah. The further four dates were funded by the School of Archaeology, Geography and Environment Science, University of Reading. We thank Mary McIntyre and Daniel Harris for their help in sample preparation and analysis. Tim Killeen, Juan Surubi, Pastor Sollis, Rene Guillen, and the Museo de Historia Natural Noel Kempff Mercado provided logistical support to access and core the CV site. The University of Leicester provided a start-up grant to F.M. (1995) to support the fieldwork. We thank Mark Bush and an anonymous reviewer, whose comments improved the manuscript.