1. Introduction
The purpose of this study is to assess the willingness of households and businesses to pay more than they are currently paying for a supply of electrical energy with fewer scheduled and unscheduled outages and more stable voltage. To do this, we employ a revealed preference approach using the averting expenditure (AE) method. The willingness to pay (WTP) for electricity reliability in Nepal is measured by estimating the costs now incurred on a wide array of coping mechanisms by households and businesses. The unique feature of this study is that the information on the AE made by individual electricity consumers in Nepal has been collected in a comprehensive fashion for a large sample of consumers who were selected on a strict statistically representative basis (MCC, 2018). Very few, if any, studies of averting behavior have data that are truly representative of the situation across an entire developing country. In undertaking this study, we are also able to determine the relative incidence of the costs of the averting expenditures according the income and location of the households and also by the type of business activity the size of the firm. Finally using the estimated values of the WTP for electricity reliability by consumer class in Nepal a cost benefit analysis is carried out to assess the magnitude of the economic welfare gain that could be realized if the problem of electricity reliability were mitigated.
Unreliability of the electricity service in developing countries has received considerable attention from both policy makers and researchers based on evidence of the important relationship between electricity consumption and the rate of economic progress of a country (Golam Ahamad & Nazrul Islam, Reference Golam Ahamad and Nazrul Islam2011; Hwang & Yoo, Reference Hwang and Yoo2016; Ju et al., Reference Ju, Yoo and Kwak2016). The unreliability of the electricity service in South Asia is one of the biggest challenges facing businesses in the region as they attempt to operate competitively (World Bank, 2015). A lack of planning, coordination, and financing has led to the deterioration of the electricity service provided by the power sector. Rapid population growth and urbanization has also added to the challenges facing the electricity sector.
For years, Nepali consumers have had to grapple with indiscriminate power outages and a low-quality electricity service. As a substitute for reliable utility-based service, households and businesses have had to rely on a range of equipment as sources of substitute energy. The major reasons behind the frequent interruptions in electricity supply in Nepal is the growing demand for electricity, the inadequate distribution and transmission systems, the poor planning for system expansion, the non-collection of electricity bills, and intensity of illegal connections. The power outages, in turn, increase the production cost of enterprises and increase the operating uncertainty that enterprises face. Losses arise from reduced output, spoilage of in-process materials, and even damage to machinery. These all translate into financial losses (Ozbafli & Jenkins, Reference Ozbafli and Jenkins2015; Hashemi et al., Reference Hashemi, Jenkins, Jyoti and Ozbafli2018).
Nepal has no significant reserves of fossil-fuel resources. All petroleum products and over 75 % of coal are imported from India (WECS, 2010). Natural gas is not produced in the country. However, there is huge potential for hydropower, but only 1 % of the potential renewable energy resources have been developed to date (NEA, 2011, 2017; Bhatt, Reference Bhatt2017).
In 2015, the World Economic Forum ranked the quality of Nepal’s electricity supply as 136th out of 144 countries.Footnote 1 A 2011 study identified Nepal as having the greatest load-shedding problem in the region, meeting a little more than half of the estimated demand (World Bank, 2011). Electricity generation for the Nepal power grid is mostly from run-of-the-river hydropower plants. Because of the relatively little storage capacity of the hydro dams in Nepal the generation of electricity by hydropower drops off significantly during the dry season. By the end of the dry season the quantity of electricity generation by hydro dam drop by approximately 50 % of the average level of electricity generation during the 6 months of the monsoon season.
This is the period when the planned outages will be their greatest as the public utility engages in rationing the available electricity supply. During the dry winter months, when hydropower generation is low, load shedding occurs for up to 18 h per day. While the capital costs of the averting expenditure investments should be spread over the entire year because of the lack of reliability throughout the year, the operating costs will no doubt be greater during the dry season when the incidence of electricity outages is the greatest. On-grid system electricity losses in 2016 were the highest rate in the region, estimated at 26 % of total electricity generated.
Nepal has one of the lowest levels of per-capita consumption of electricity in the world. In 2011, the World Bank estimated that annual per-capita electricity use in Nepal was only 106 kWh, which is one sixth of that in India, Nepal’s neighbor to the south, and one thirtieth of the per-capita electricity use in China. Approximately 30 % of the population is without access to electricity, contributing to the country’s slow pace of economic growth (Advanced Energy Centre, 2016). The uncertain availability of electricity creates significant costs for businesses because they are forced to reduce their hours of operation and invest in expensive back-up generation that runs either on high-cost imported fuel or on solar photovoltaic systems, batteries, and inverters.Footnote 2 Access to the electricity service tends to be severely limited across households and businesses. Furthermore, the inadequate social safeguards and the limited regulatory framework for the electricity sector have resulted in an inequitable sharing of the benefits of new hydro power developments (NEA, 2014).
Only a few studies on energy consumption have examined the electricity system of the Kathmandu Valley. Adhikari (Reference Adhikari2012) examined the future electricity consumption and demand-side management options in urban Kathmandu households with a focus on their impact on the income growth for each economic stratum. Rajbhandari and Nakarmi (Reference Rajbhandari and Nakarmi2014) undertook a study of the energy consumption of the residential sector of Kathmandu Valley. The optimal energy model has been evaluated using a set of the residential alternatives, considering both conventional and renewable resources. The results of these studies indicate that the current rapid growth and pattern of electricity demand in the urban areas puts huge pressure on electricity supply requirements and hence the need for expansion of generation capacity along with the complementary transmission and distribution networks.
Similarly, Chakravorty et al. (Reference Chakravorty, Pelli and Marchand2014) examined the effect of a grid connection as well as the quality of power supply on household incomes in rural India. Their results indicate that over the same period of time the growth of non-agricultural household incomes was more than three times greater for those with a grid connection that delivered a high quality electricity service as compared to those households that were receiving an unreliable service. Aklin et al. (Reference Aklin, Cheng, Urpelainen, Ganesan and Jain2016) find robust evidence for the importance of the quality of the electricity service for subjective well-being in rural India. Blankenship et al. (Reference Blankenshipa, Chun Yu Wongb and Urpelainenc2019) examined the influence that the quality of electricity service had on the WTP for the electricity service among rural and urban Indian households. Increases in reliability increased the stated WTP for more hours of power per day, on the other hand delays in service improvements reduced their WTP.
The remainder of the paper is structured as follows. Section 2 describes the study area and the methods used to collect the data. A conceptual framework and an empirical model are also outlined. Section 3 provides a summary of the basic statistics. Section 4 contains the results and discussion and the Section 5 provides the conclusions and the policy implications.
2. Description of the study area and data
Nepal is a landlocked central Himalayan country in South Asia with a population of 26.5 million people. It is divided into three distinct areas: mountains (the Himalayas) in the north, Terai (the plains) in the south, and the hills in between. The Terai region is home to half the population, while the hills are home to 43 % of the population and the mountains to the remaining 6.7 %. In 2016, the annual per-capita income in the country was US$ 862.Footnote 3 The Nepal Living Standard Survey (NLSS, 2011) estimates that 25.2 % of the population lives below the poverty line and the income level of 32.5 % of the population is less than US$ 1.28 per day (CBS, 2016). Among the total population of the country, 82.9 % of people live in rural areas. Agriculture is the mainstay of the economy, accounting for one third of gross domestic product. The residential and business sectors in Nepal consume 43.4 and 23.5 % of total electricity, respectively (WECS, 2010).
There are 5646 operating businesses registered in Nepal (Department of Industry, 2014). Of these, 64 % had an annual turnover of less than US$ 471,698 and are categorized as small businesses, 24 % had an annual turnover between US$ 471,698 and US$ 3,773,585 and are categorized as medium businesses, and 12 % with an annual turnover of more than US$ 3,773,585 are categorized as large businesses.
2.1. Conceptual framework
The AE method focuses on the types of expense that were incurred to compensate for the lack of reliability of the electricity service. The minimum value that can be expected to be derived from an improvement in the electricity service can be estimated from the total expenditures by households and businesses for these goods. Since these goods are a substitute for the quality of the electricity service from the utility, their purchase reveals the individuals’ WTP for service improvements. The revealed preference approach estimates businesses’ and households’ WTP for electricity service improvements by estimating the value of their AE. It should be recognized that the combination of AEs chosen is not likely to provide the quality of service that is provided by a well-run electric utility. Some households and businesses would be willing to pay more than their current AE to receive a totally reliable service. However, this high quality of service is often neither technologically nor financially feasible with the mitigation devices available.
In terms of business or household production function theory, each business or household utility is a function of the preferred level of electricity-dependent services (Bockstael & McConnell, Reference Bockstael and McConnell1999). This is determined by, among other things, its stock of electrical appliances and other consumption goods, and the characteristics of the business and household. Therefore, when the electricity service from the utility company falls below the level required to produce the business’s or household’s preferred level of services, they engage in mitigating actions in order to improve the service toward its desired level. These averting behaviors include the use of solar panels, generators, voltage stabilizers, kerosene, biofuel, liquified petroleum gas, emergency light, torch light, dry cell batteries, and candles. In order to calculate businesses’ and households’ total monthly AE, the ownership and usage data of these items by the businesses and households are required, plus other market and engineering data, such as the economic life, fuel consumption rate, and unit price of different capacities for the equipment and other materials used in each action.
The estimates of the coping costs reflect what people are willing to pay to reduce the level of outages in their electricity supply. Hence, the cost function of producing electricity-dependent services, CF(.), will be defined as follows:
 $${C}_F={C}_F\left(F\left(E,A,R\right),{p}_E,{p}_A,R\right),$$
where F(.) stands for individual’s production function of electricity which is dependent on averting expenditures, R stands for reliability of the electricity service provided by gird, E is electricity energy consumed by individual, A is the level of averting behavior, pE is price of grid electricity and pA is price of averting behavior. The reliability of the electricity service decreases averting expenditures needed to reach any particular R. Let F* be the optimal level of electricity dependent on averting expenditure for an individual confronted by reliability level R 0. Given an increase in reliability from R 0 to R 1, the reduction in the cost of producing the preferred level of services F* is given by:
 $${C}_F\left({F}^{\ast },{p}_E,{p}_A,{R}^0\right)-{C}_F\left({F}^{\ast },{p}_E,{p}_A,{R}^1\right).$$
Hence, the restricted expenditure function will be defined as:
 $$ e\left({p}^0,{R}^0,{U}^0\ \right), $$
where, U 0 is the respondent’s level of utility with the current service reliability of R 0. Then the savings in expenditures required to achieve F* is given in Bartik (Reference Bartik1988) as:
 $$ e\left({p}^0,{R}^0,{U}^0\ \right)-e\left({p}^0,{R}^1,{U}^0;{F}^{\ast}\right)={C}_F\left({F}^{\ast },{p}_E,{p}_A,{R}^0\right)-{C}_F\left({F}^{\ast },{p}_E,{p}_A,{R}^1\right). $$
The economic welfare impact of an improvement in the quality of electricity service is estimated by the compensating variation. This method evaluates the maximum WTP of the individual that is taken from their income to improve the reliability from initial level (R 0) to new level R 1 to make them better off (Silberberg & Suen, Reference Silberberg and Suen2001). In terms of expenditure function, this can be calculated as follows:
 $$ CV=e\left({p}^0,{R}^0,{U}^0\ \right)-e\left({p}^0,{R}^1,{U}^0\right). $$
Substituting Equation (4) for e (p, R 0, U 0) in Equation (5) gives us:
 $$ CV={C}_F\left({F}^{\ast },{p}_E,{p}_A,{R}^0\right)-{C}_F\left({F}^{\ast },{p}_E,{p}_A,{R}^1\right)+e\left({p}^0,{R}^1,{U}^0;{F}^{\ast}\right)-e\left({p}^0,{R}^1,{U}^0\right). $$
The cost of the averting actions is expressed monthly. The capital costs of averting equipment such as generators, solar panels, and inverters are annuitized and expressed as monthly charges. This monthly amount is then added to the monthly variable costs associated with the coping technology. Hence, the capital expenditure for each averting action made by the business/household with a life of more than 1 month is allocated to each year of its life, as follows:
 $$ {p}_A=\frac{r(PV)}{1-{\left(1+r\right)}^{-n}}, $$
where PV denotes the present value of capital expenditure if the investment is made over more than one period, r the monthly interest rate, and n the lifespan of capital item on a monthly basis.
3. Data collection
In this estimation of the WTP by households and businesses for reliable electricity services through the measurement of their averting expenditures all the selected respondents are already connected to the electricity grid. A questionnaire was developed based on the design objectives and statistical efficiency discussed in the literature (Bose & Shukla, Reference Bose and Shukla2001; CIE, 2001; RIC, 2005; Carlsson & Martinsson, Reference Carlsson and Martinsson2007, Reference Carlsson and Martinsson2008; Carlsson et al., Reference Carlsson, Martinsson and Akay2011; Hensher et al., Reference Hensher, Shore and Train2014). The questionnaire is organized into six main sections: quality control; current electricity service; electricity consumption pattern; preparatory actions (averting behavior); AEs; and business or household characteristics. The survey asks attitudinal questions regarding the current electricity service in order to reveal the respondents’ attitudes toward the overall electricity system. Information was also collected on load shedding and brown outs. The survey includes questions on the duration and frequency of interruptions (planned and unplanned), as perceived by the respondents.
Questions are asked in order to determine the level of the dependence of the household or business on electricity. When the survey was conducted the value of their last month’s electricity bill was confirmed. In most cases the respondents showed their last past month’s bill to the person conducting the survey. The survey asked the respondents in a number of different ways about the quality of electricity service they were receiving. For example, number of planned outages per day, duration of planned outages (average hours per day) and whether they were receiving prior notice of times of planned outages. The respondents were also asked about the duration of unplanned outages (hours), and frequency of unplanned outages. Asking respondents in this detailed way about their experience assisted the respondents to reconcile their perceptions fairly closely to the reality of the situation.
The households and businesses were asked in detail about what actions they were taking in order to overcome the impacts of service outages. They were also asked about the expenditures they were making on such mitigating actions to cope with the outages. Finally, the questionnaire collects data on business and household characteristics that can be used to explain their averting expenditure actions. The data obtained from this survey is available through the Millennium Challenge Corporation website (MCC, 2018).
The entire process of organizing and testing the questionnaire, running the survey, and conducting the analysis covered the period from April 2016 to April 2017 using a face to face survey method. The actual field survey of the tested questionnaire was conducted during the period from early October 2016 to the end of January 2017. This is the first half of the dry season that extends from early October to early May.Footnote 4
A small pre-test was conducted with urban, peri-urban, and rural households and businesses located within and around Kathmandu Valley in order to test the content, flow, and translations of the study tools. A total of 40 households and 10 businesses were interviewed for the pre-test. A pilot was then conducted following finalization of the sampling plan and household selection method. The main purpose of the pilot was to test the electronic version of the questionnaire along with the sampling method and the GIS-based data collection process. A total of 150 households and 50 businesses were interviewed for the testing pilot. It was envisaged that the testing pilot would lead to the finalization of the questionnaire and all other survey-related matters leading to the main survey (MCC, 2018).
The field implementation team comprised 9 supervisors and 24 enumerators who were trained and debriefed for the survey. The average interview length for the household questionnaire was around half an hour and for the business questionnaire an hour or more, depending on the respondent. The overall usable responses rate for the WTP survey conducted among households was 86 %, with a final total of 1800 usable household questionnaires; there were 400 households from each stratum except for the urban locations outside Kathmandu Valley for which a sample of 600 households was allocated. For the business survey the response rate was 36 %, with a final total of 590 completed questionnaires; the composition of the final survey respondents was 270 small, 222 medium, and 98 large businesses. The final set of business respondents amounted to approximately a 10 % sample of the total number of businesses in Nepal.
The Nepal Electricity Authority (NEA) provides 85.9 % of the own metered connections while landlords provide 11.1 % of sub-metered connections. The remaining 3 % of households have informal connections provided by neighbors or relatives. Of the sample respondents, men make up 52.9 % and women 47.1 % of the total. The interviews were conducted with the head or a knowledgeable member of the household. In our sample, the illiteracy rate of the respondents is 20.1 %. The sample contains a high percentage (56.8 %) of families with school-age children.
The total sample of businesses consists of 561 enterprises. Industry/manufacturing establishments make up 57.6 % of the sample, while the remaining 42.4 % are members of the services (non-commercial and commercial) sector. The average number of permanent workers is about 71 per business. In terms of location, 25.9 % are from the Hill regions and 74.1 % from the Terai. Approximately 99.5 % of respondents pay for their electrical usage based on the meter/sub-meter readings. In terms of paying for their electricity, 88.8 % of the respondents pay the NEA for their monthly usage. An average business pays US$ 2,798 per month for their electricity.
In case of household the respondents on average had two outages per day and the average total duration of the outages per day was about 6 h. Of these outages, 35.7 % were planned outages where the households were notified that they were going to happen. Of the total households surveyed, 7 % experienced outages that were longer than indicated in the notification of the planned outages. In addition, there were unplanned outages reported by 60.3 % of households. In order for this percentage to be more meaningful, the average perceived number of unplanned outages per day was 2.85 and perceived longest duration of outages averaged between 2 and 3 h. The frequency of the outages was mainly during the evening and night time as reported by 57.4 % of the respondents.
Among the respondents who stated to have a moderate number of failures in general, many have also stated to that these failures contribute to difficulty studying and ownership of fewer leisure devices. A very high percentage (71.7 %) of the respondents experienced brownouts that happened on average 11.25 times per year. Of the total number of respondents, 66.3 % reported that the brownouts mainly occurred during the evenings and nights.
In case of businesses the respondents on average had 1.35 outages per day and the average duration was about 7 h per day. Of these outages, 53.2 % had occurred after prior notification. Furthermore, they experienced 12.4 % longer outages then they were informed would occur. In addition, 71.5 % of the respondents had an unplanned electricity interruption. In order for this percentage to be more meaningful, the average perceived number of unplanned outages per day was 2.86. The longest interruption during the past 12 months lasted 3 h, and 47.3 % of the outages happened in the afternoon. The majority of the respondents have experienced a loss of production, idle periods and loss of competitiveness due to the higher electricity cost. They estimated that if they had access to 24/7 electricity supply they could increase their annual turnover by 15.17 %.
A very high percentage of the respondents (64.4 %) state that they experience brownouts on average about 2 days per year, 39.8 % of which happened in the afternoon. Furthermore, 13.6 % experience surges in their electricity on average 2.14 times per year. Out of the total number of respondents, 9.8 % state that the voltage surges had caused damage to their equipment/appliances of on average US$ 819 cost over the past year. Further descriptive statistics of the sample used in this empirical analysis are summarized in Table 7, Appendix.
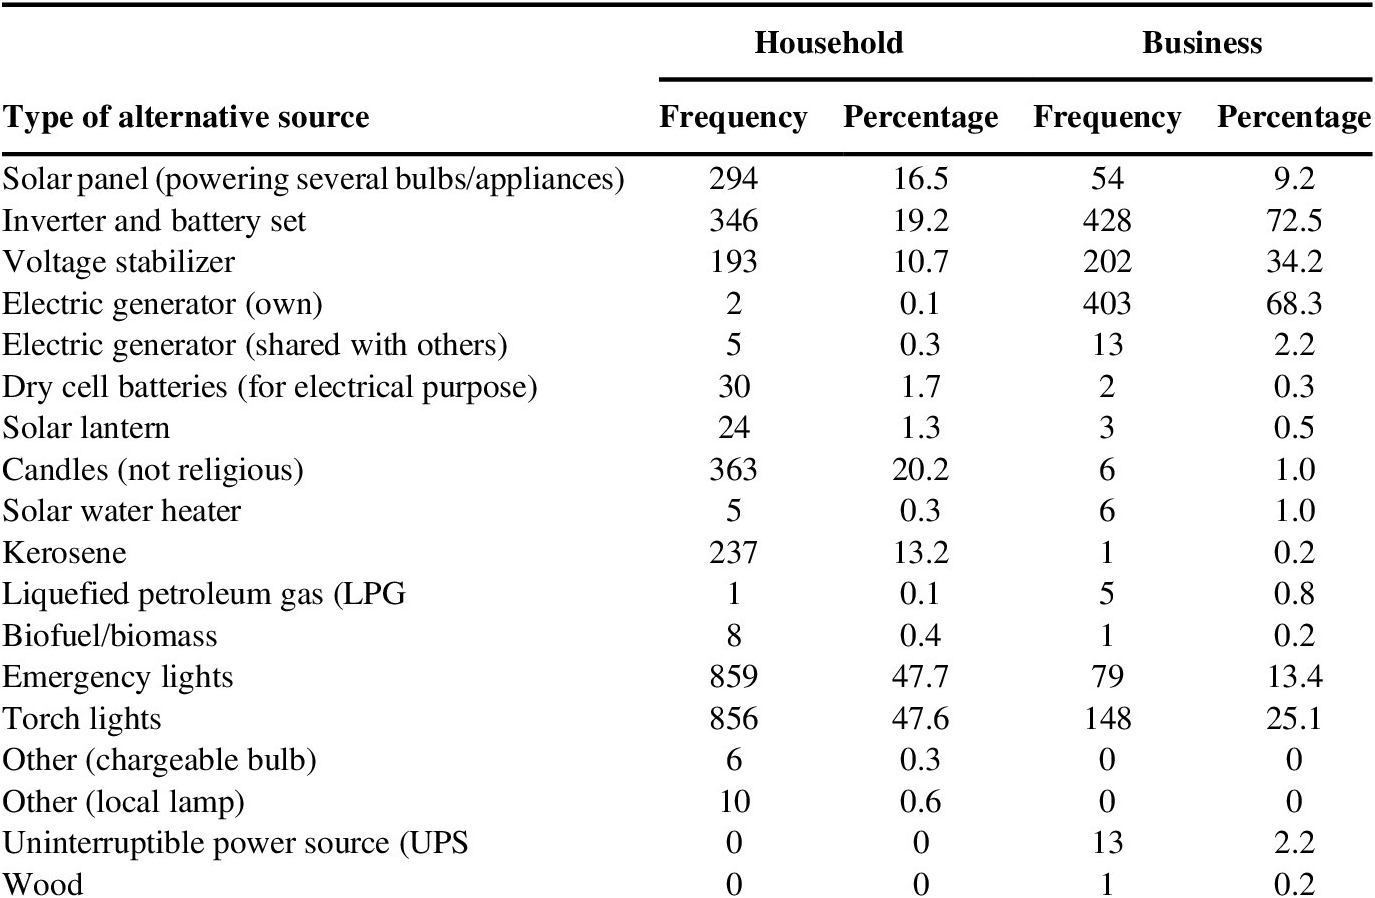
Information on the alternative sources of electric energy that respondents use during power outages in Table 1 below. About 47 % households use torch lights or emergency lights to provide light for their households whenever power outages occur. This is the most common form of mitigation for power outages by households. The next most used alternative source of light is candles (20.2 %). Inverter and battery sets are used by 19.2 % of the households while solar panels of various sizes are used by 16.3 % of the households. This is followed by kerosene lamps that are employed by 13.2 %. In order to mitigate against the damage of voltage shocks, voltage stabilizers were purchased by 10.7 % of our sample of households.
Alternative sources of light used by respondents during power outages.

For businesses 25.1 % employ torch lights and 13.4 % emergency lighting as lighting sources. The most frequently used ways in which businesses mitigate power outages was to use inverter and battery sets (72.5 %) and electric generators (68.3 %). Purchase of voltage stabilizers is also quite important being owned by 34.2 % of the households. With this array of mitigating expenditure, the next step is to assess their cost to the users.
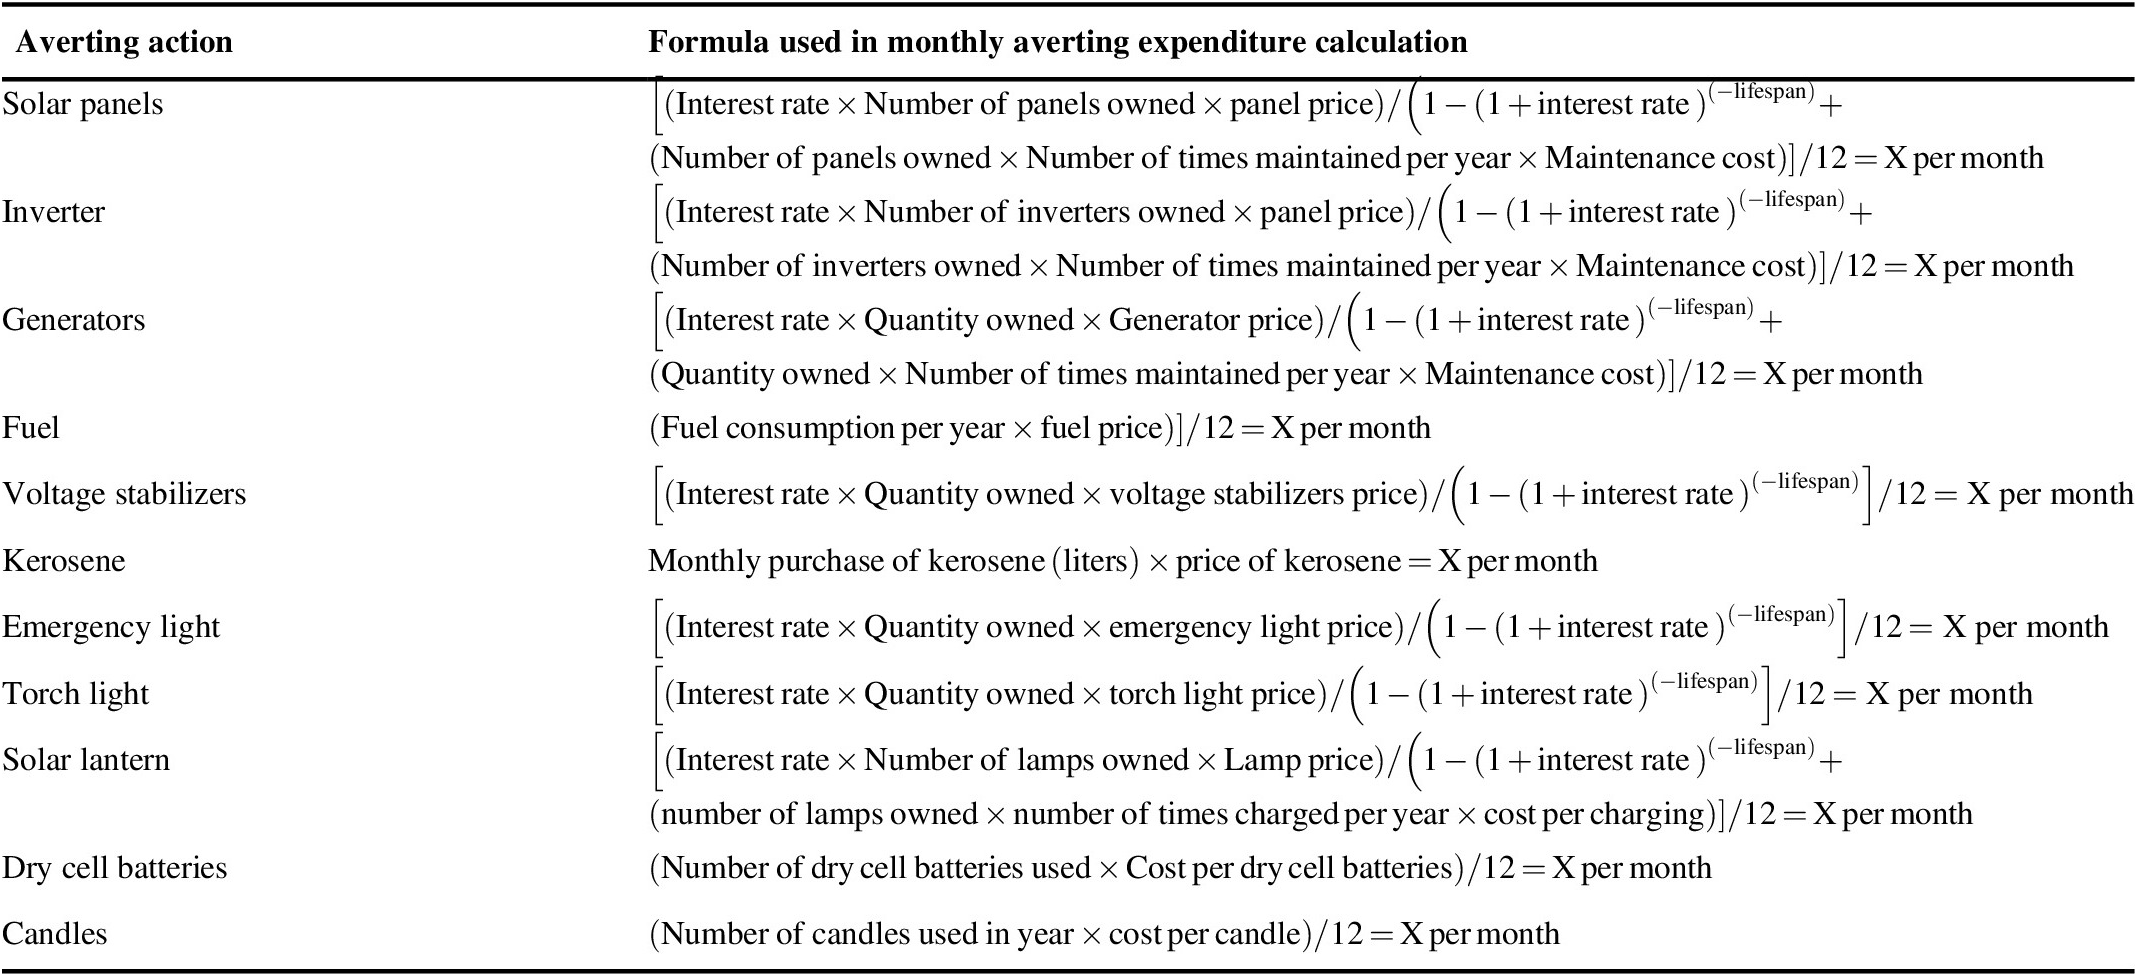
In order to measure the average monthly expenditures on capital items, an annual annuity charge is first estimated for the life of each item of equipment. This annuity value is calculated based on the replacement cost of the equipment and the life of the item if it were purchased new. The monthly annuity value is estimated by simply dividing the annual value by 12. Monthly maintenance costs are added to monthly annuity values to arrive at an estimate of the coping costs. The formulas below for calculating the AE for each averting action are presented in Table 2. Using the ownership and usage data collected from the respondents, the market and engineering data presented in Table 1, and the formulas in Table 2, we calculated the monthly AE for each action taken by the households and businesses. We assumed an annual opportunity cost of capital of 10 % (or monthly 0.8 % = [((1 + 10 %)^1/12) – 1].
Formulas for the estimation of the monthly cost of averting expenditures to improve electricity service by type of coping mechanism.

4. Empirical results and discussion
In the survey, the respondents were asked about what actions they were taking to reduce the impact of electricity outages on their household or their business. A total of 11 different expenditures were identified. Some of these expenditures, reported in Appendix Table 8 are capital in nature, with other being operating and on-going expenses. As expected, the important expenditures made by households are quite different from those of businesses.
Because of the way the questionnaire was structured, it was not possible to obtain a consistent estimate of the intensity of use (measured in kWh) of each of the item purchased to cope with the electricity outages. Expressing the costs of the AEs on a monthly basis, however, provides an assessment of people’s WTP for managing the risk of electricity outages. When one-time capital expenditures are incurred, the estimates of the overall coping costs are expressed as a monthly cost (annuity plus operating expenditure) (equation 6 in the conceptual framework) to obtain a monthly levelized estimate of WTP to mitigate risk, even if in some months the averting actions are employed less than in other months. The total averting cost per month (expressed as a percentage of their monthly electricity bill) of each respondent is US$ 3.05.
Of the 1735 households responding to this part of the survey, only 294 reported ownership of one or more solar panels. For households, the major averting capital expenditures are on inverters. A total of 340 households reported owning at least one inverter, which has an annual cost when averaged over all the households of US$ 1.55 per household per month. The surprisingly large annualized capital cost for the inverter, as compared to solar panels, arises from the relatively short useful life reported for this equipment in Nepal of just 3 years. This was the estimate of the life of the inverter by the merchants selling such equipment in the country. From this number, one can obtain a sense of the damage to electrical equipment caused by the unstable voltage in Nepal. In other countries that are able to supply electricity with a stable voltage, it is normal for such inverters to last up to 10 years of service. Attempts to mitigate the problem of unstable voltage are made through the purchase of voltage stabilizers. It was reported that there were 193 voltage stabilizers in use, resulting in coping costs, when averaged over all 1735 households, of US$ 0.125 per household per month.
Emergency generators are not a significant source of back-up electricity generation for households in Nepal. Out of the total sample of households, only two reported ownership of a generator. The corresponding consumption of fuel to run such generators is also modest when aggregated over all the households surveyed.
The average monthly expenditures on kerosene (87 % for lighting), emergency lights, torch lights, dry cell batteries, and candles all range between about US$ 0.17 and US$ 0.24. The total of these five on going expenditures that are mainly for lighting is US$ 1.07 per month.
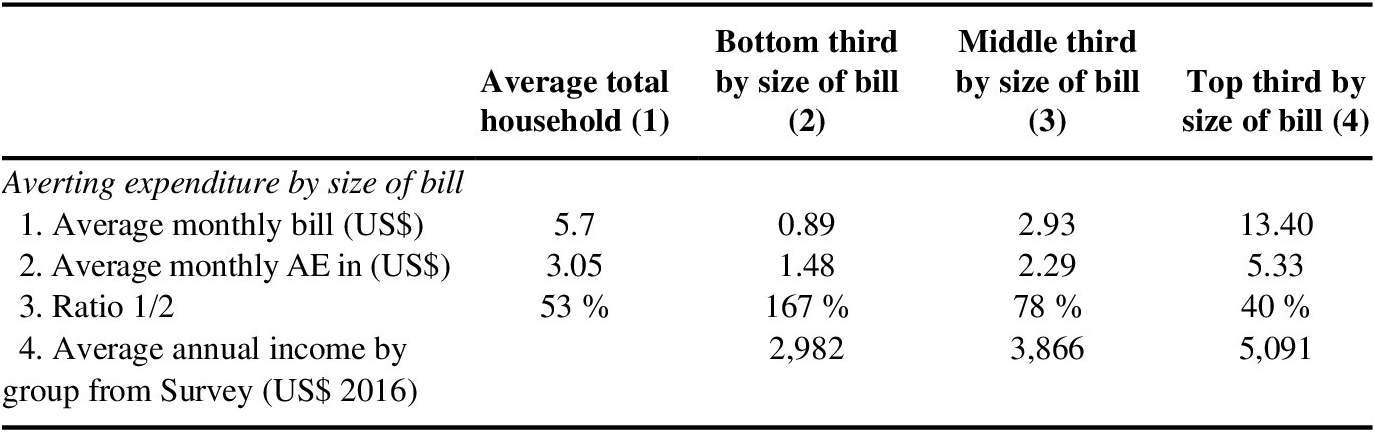
By weighting these average expenditures for each item by a household using the methodology shown in Table 2 by the number of households in the sample that use a particular coping device (Table 1, column 1) the average monthly coping costs per household can be derived. The average value of the coping costs incurred by households was US$ 3, (Table 3, column 1 row 2). This can be compared to the average monthly electricity bill of US$ 6 (Table 3, column 1 row 1) for the 1740 households in our sample. Hence, the average monthly value of averting expenditures is equal to 53 % of the current bill of households.
Averting expenditures per household by size of bill and income.

To obtain a fuller picture of how the coping costs are distributed across the households, the sample of households are divided into three equal groups according to the size of their monthly bills. These averages are reported in Table 3, row 1 columns 2, 3 and 4. The average household bill for smallest third of the bills is US$ 0.89, for the middle third the average bill is US$ 2.93 and for the largest third it was US$ 13.39. The households average everting expenditures as a proportion of the electricity bills can then be estimated for these three groups. The averages are 167, 78, and 40 % of the size or the electricity bills for the small, medium and large consumers, respectively. The incomes reported by the respondents were then averaged for each of these sets of households that are sorted by the size of their electricity bills. In Table 3, row 4, we find that the average annual reported income of the households with the smallest third of the electricity bills was US$ 2,982, while the average income of the middle third of customers by size was US$ 3,866 and for the third of the households with the largest electricity bills had incomes that averaged US$ 5,091 per year. This analysis clearly indicates that the burden of the averting expenditures that households made to reduce the impact of electricity outages falls disproportionally on those that purchase smaller amounts of electricity from the electric utility and are also relatively poor.
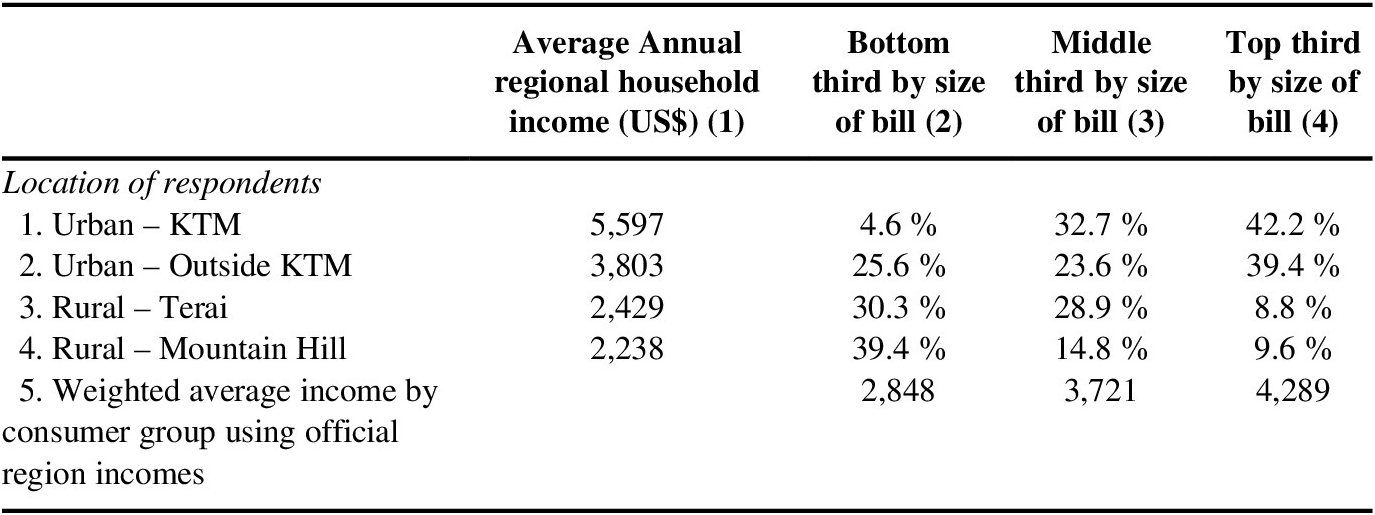
The information for the survey also allows one to identify the region where each household is located. In addition, the average income of the residents of each region are reported in Table 4, column 1. From columns 2, 3, and 4 it is clear that the small poorer electricity consumers are concentrated outside of Kathmandu with approximately 70 % residing in the rural areas. For those middle-sized customers approximately 56 % reside in Kathmandu or the other urban areas in Nepal. For those with the largest electricity bills, over 89 % live in either Kathmandu or the other urban areas. Even though the survey only covers those that have a formal electricity connection to the electricity grid, the quality of service being provided to grid connected customers in the rural areas is much worse than provided to those in Kathmandu and the other urban areas in Nepal. Although in no region of Nepal does one find high quality electricity service, the burden of coping with this problem falls disproportionally on the poor households living in the rural Terai and Mountain-Hill regions. It is these groups that report making averting expenditures (relative to their electricity bills) that are approximately four times as large as that experienced by the urban groups that have larger electricity bills.
Weighted average income of by household consumer group using official region incomes (US$ 2016).

By weighting the average income of the residents for each of the regions by the proportion of electricity consumers who are respondents to the survey from that region, a check can made as how representative the sample is to general population of electricity consumers in Nepal. We would expect to find that the regional based estimate of the average income of the respondents would be lower than what they actual report. This arises because the lowest income household in each of the regions are not likely to be connected to the electric utility’s service. Over the whole country approximately 30 % of the households do not have electricity service. Comparing the average incomes of each consumer class in Table 4, row 5 with Table 3, row 4, we find a very systematic pattern. In all cases in the average income of the group estimated by weighting regional average incomes is lower than the reported average incomes of the respondents. In the case with those with the bottom third and the middle third of by size of electricity bill, the incomes reported by the respondents are on average 4 % greater than estimated by weighting regional average incomes. For those with the largest third of the electricity bills the reported incomes are approximately 19 % higher than the average found by weighting regional average incomes. It the consumers in the urban areas that make up the vast majority (81.6 %) of the class of large household consumers. Because the distribution of incomes in the urban areas are likely to be much more unevenly distributed than in the rural areas, the gap between the average incomes of the large consumers that is derived from the reported incomes of the respondents and that estimated from the average incomes of the regions is expected to be largest for this class of customers. It is the poorest of the poor who will not be connected to the electricity service in urban areas.
For the analysis of AE for the business sector, a distinction is made between small, medium, and large businesses. The coping costs are all very consistent across all three sizes of firms. Solar panels are largely irrelevant. It is the inverters, voltage stabilizers, generators, and, above all, the cost of the fuel used to run the generators that dominate the AE (Appendix Table 9).
Of the total coping costs incurred to generate electricity, fuel costs incurred by small, medium, and large businesses account for 57, 66, and 74 %, respectively. On the other hand, the capital costs associated with this self-generation, including voltage stabilizers, inverters, and generators, represents 41, 33, and 25 %, respectively, of the total coping costs for small, medium and large businesses. Of the 249 small businesses, 74 had voltage stabilizers, 160 had inverters, and 103 had generators. Of the 214 medium businesses, 88 had voltage stabilizers, 133 had inverters, and 120 had generators. Of the 98 large businesses, 37 had voltage stabilizers, 61 had inverters, and 73 had generators. In each of the business categories, about 99 % of the AE consists of expenditures on these three capital items plus the fuel to run the generators. In small firms, the capital outlays are a relatively larger proportion of total AE than is the case for large firms, while fuel costs are a larger proportion of the outlays for large firms. This indicates that larger firms run their generators more, but because the generators are larger they are relatively cheaper in terms of the cost per KW of capacity.
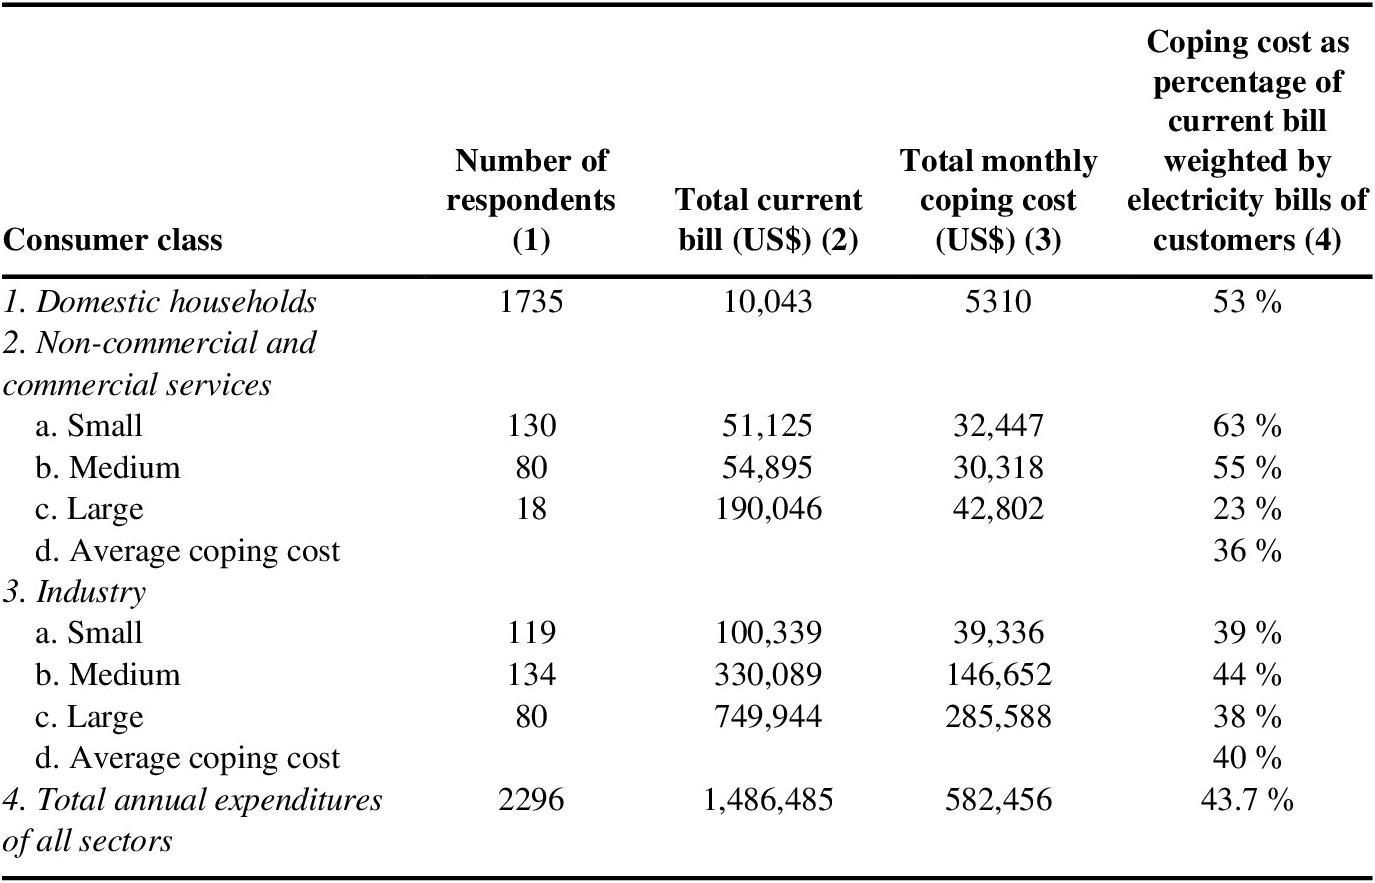
As summarized, the average monthly AEs for small businesses US$ 288, for medium-sized business US$ 827, and for large businesses US$ 3,351 and the average current bill for small businesses US$ 608, for medium-sized business US$ 1,799, and for large businesses US$ 9592.
The estimates of the average coping costs are presented in Table 5, column 4, for each class of electricity consumer. These estimates are expressed as the ratio of the monthly coping costs incurred by the household or business to the monthly electricity bill. These individual ratios are then weighted within each consumer class by the share that the electricity bill of individual customer represents of the total consumption of electricity for that particular consumer class. This procedure yields the average values for each sub-customer class, customer class, and overall average AE as a percentage of the entire sales of the utility to all consumers.
Estimated monthly coping cost by type and consumer class.

The monthly AE for households amounts to 53 % of their total payments to the electric utility (column 4). For service and industry, AE as a percentage of their electricity bill is 36 and 40 %, respectively, with a weighted average over all the electricity consumed of 43.7 % of the entire value of the revenues received by the utility for the electricity service.
It is clear that inverters do not result in additional electricity being consumed because they are charged up by electricity that is part of the establishment’s electricity bill. In contrast generators potentially allow the establishment to consume more electricity, not just store electricity as do inverters. The electricity rates are non-linear with rates charged in 2016–2017 ranging from 10 NRs to 13 NRs for energy per kWh with a fixed service charge per month that averages out to be approximately 1 NRs/kWh. Hence, there is a potential that self-generation might be an attractive option to supplement the electricity supply.
The average cost of electricity that shows up on the electricity bill for the typical industrial consumers who own generators is about 14 NRs/kWh. From our analysis of the costs of diesel generators in Nepal, the fuel and variable operating costs of diesel generators varies from 22.84 NRs/kWh for a small 60 KVA generator to 20.43 NRs/kWh for a large 1500 KVA generator.Footnote 5 This means that the variable cost of generation by diesel generators is between 1.63 and 1.46 times the energy price if purchasing electricity at the top rate of the electricity tariff schedule. If volume of electricity generation was linearly distributed along these two extremes then the average cost of self-generation would be approximately 1.55 of electricity tariff or 21.63 NRs/kWh. This is neglecting the capital cost of the generators. While the total averting expenditures made by business amount so 40 % or the electricity bill, we find that 88 % of the averting expenditures consists of the rental costs of the generators plus the fuel costs of self-generation. Hence, the AE expenditures of self-generation alone is an equal to approximately 35 % of their current electricity. When the rental costs of the generators are added to the fuel costs the average costs of self-generation increases to 27.25 NRs/kWh. The amount of time that the self-generation needs to take place in order to create a coping cost equal to 35 % or the electricity bill is estimated to be 15 % of the total electricity purchased and self-generated. This is a very modest percentage of time when compared with the amount of time these businesses experience planned and unplanned outages. It would appear the owners of the enterprises do not even self-generate enough to offset all the energy that is not purchased. Because of the high cost of self-generation, one can appreciate why most businesses do not attempt to self-generate if there is any other option.Footnote 6
From the data presented in Table 5, it would appear that there are substantial economies of scale in averting activities for the non-commercial and commercial services. The rate of AE per US$ of electricity purchased decreases with average size of the bills for the customer class. It is the small businesses that have to pay more in coping costs per unit of electricity consumed. This holds to a lesser degree with the firms in the industrial sector. This is also consistent with the results from the household sector where it is the small consumers that bear a heavier burden of averting expenditure outlays.
These results are very consistent with those found in similar AE studies for Africa (Steinbuks & Foster, Reference Steinbuks and Foster2010; Oseni & Pollitt, Reference Oseni and Pollitt2013; Oseni, Reference Oseni2017). While AEs are large, and always multiples larger on a kWh basis than the cost of power if it could be purchased from the electric utility, these mitigating expenditures still do not guarantee a reliable electricity service.
Furthermore, the estimates of the economic cost of electricity outages as estimated from stated preference methods are usually substantially larger than the estimates of WTP based on AE costs. Averting expenditures, in terms of the quality of electricity service tends, to be an imperfect substitute for reliable high quality service provided by a grid connection. The evidence from the stated preference part of this survey supports this statement. From the stated preference analysis, it was found that the range of estimates of the WTP for electricity reliability by households was between 64 and 83 % increase of the current electricity bill. For industry, the stated preference estimate of the WTP was between 71 and 94 % of the current electricity bill (Niroomand & Jenkins, Reference Niroomand and Jenkins2020). In contrast, the WTP estimate for households based on AE was a 53 % increase and the estimate of the WTP of industries from averting expenditure is 40 %.
4.1 Cost–benefit analysis of improvement of service
In 2017, the total sales revenue from the payment of electricity bills by non-business customers totaled US$ 210,751,132. This was made up of the bills of domestic consumers of US$ 186,672,368 and of non-commercial consumers of US$ 24,078,764. The total sales revenue in 2017 for business electricity was US$ 204,793,084, which comprised US$ 156,938,707 for industry consumers and US$ 47,854,377 for commercial consumers (NEA, 2017). These values for the total amount of receipts from billings are combined with the three sets of AE estimates for both households and businesses to construct a range of monetary values that measure the gross gain in economic welfare if the public utility were to reduce the frequency of electricity supply outages.
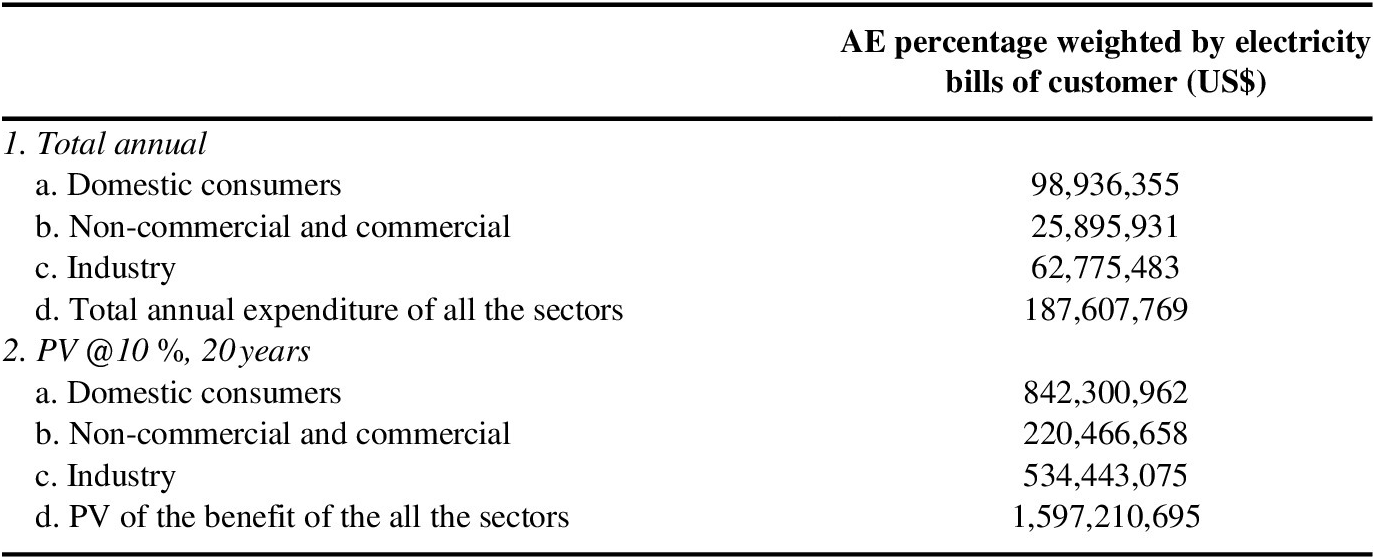
Using the average values for the AE potential to be saved, the annual estimates of the range of the monetary values of the gross benefits from improving the quality of the electricity service for both households and businesses in Nepal are reported in US$ in Table 6.
Estimate of the annual averting expenditure (AE) for reduction in outages by consumer class for 2016/2017.

Abbreviations: PV, present value.
Source: Electricity revenue by consumer class is published in the Nepal Electricity Authority (NEA) annual report (NEA, 2017).
In terms of annual gross benefits, the estimated value of reducing electricity outages based on the AE estimate of the WTP yields a value of US$ 187.6 million per year (Table 6, row 1d). Expressing the benefits of providing a reliable service over a period of 20 years yields a PV of benefits of US$ 1597.2 million (Table 6, row 2d), expressed in 2017 prices.
In order to address the problem associated with the quality of the electricity service in Nepal, a major set of investments will be needed to increase the capacity of both electricity generation and transmission. An example of one such investment is a major strengthening of the electricity transmission system in Nepal at a proposed cost of US$ 530 million. This investment is to be financed through a grant from the U.S. government via the Compact between the Millennium Challenge Corporation (MCC) and the Government of Nepal signed September 17, 2017. The counterpart organization within Nepal for the implementation of this project will be the NEA, which has contributed US$ 130 million. It is thought that this project, in conjunction with other investments made in the generation sector, will greatly improve the availability and quality of the overall electricity service (MCC, 2018). In addition, the NEA (2017) is in the process of undertaking a number of generation projects with a total cost of approximately US$ 350 million, facilitated by funding of US$ 150 million from the Asian Development Bank and several bilateral development assistance organizations. Hence, the total investment program for system improvement is approximately US$ 880 million.
A comparison of the present value of the reduction in coping costs of US$ 1,597 million with the estimated investment costs of US$ 880 million needed to rectify the situation indicates that the benefits are more than 80 % greater than the costs. Furthermore, it is clear from the survey respondents that the AE they are incurring combined with the service they are receiving from the electric utility is not providing them with as high a quality of service than they could obtain from a rehabilitated utility. For businesses, production is being interrupted at a tremendous cost, and damage is being inflicted on their equipment (Hashemi et al., Reference Hashemi, Jenkins, Jyoti and Ozbafli2018). For households, the quality of life is being reduced, even if they incur these coping costs. These AEs only partially mitigate the poor electricity service. It is clear that if further investment were needed to effectively eliminate the level of electricity outages, it is highly likely to be justified if it is effective in eliminating the electricity outages.
5. Conclusion and policy implications
The public electricity utility system in Nepal is in dire need of upgrading. Customers of the utility are enduring an inefficient and costly service. The levels of outages and voltage fluctuations are some of the greatest experienced by household and businesses anywhere in the world. To deal with the unavailability and unreliability of service, households and business are incurring a wide array of AEs.
The burden of the averting expenditures falls more heavily on the poorer households living in the rural areas and the smaller commercial and non-commercial businesses. Furthermore, it is the medium sized industrial businesses that are bearing relatively higher coping costs to achieve a tolerable level of electricity reliability. If investments are made to improve the overall level of electricity service quality it will be these poorer households and the small businesses that will benefit relatively more. This would be an important intervention to alleviate the incidence of poverty in Nepal.
While mitigation expenditures improve the quality of service over and above what it would otherwise have been, they in no way provide a perfect substitute for utility-level service. However, the magnitude of the AEs indicates that investments in the electricity system to improve the quality of the service would be a much less costly option than individual households and businesses engaging in averting expenditures.
From the estimates obtained for the current level of AE it would appear that investments being made by the government and donors, such as the USA through the MCC, and the Asian Development bank are justified on the basis of this illustrative economic cost–benefit analysis.
Supplementary Materials
To view supplementary material for this article, please visit http://dx.doi.org/10.1017/bca.2020.25.
Acknowledgements:
The project was funded by the MCC. The authors would like to thank the Solutions Consultant (P.) Ltd for their help in conducting the field survey, CPCS Transcom Limited for working alongside us during the project and the Office of the Millennium Challenge Nepal (OMCN) for helping with logistical issues, data availability, and stakeholder access. We wish to thank Dr. Lincoln P. Rosner, Brian Epley, and Jean-François Arsenault for the assistance they provided throughout the study process, from conceptualizations and design, to implementation and report preparation. We also wish to thank Dr. Roop Jyoti for his advice and assistance in providing information on the challenges facing business operations in Nepal.