

Introduction
When consumers are looking to make choices in the financial marketplace, it seems likely that their choices will be influenced by the availability of relevant information. Regulators of financial markets, therefore, require creditors to disclose relevant financial information about features of their loan products to prospective borrowers (hereafter, consumers) in certain ways. For instance, some jurisdictions require creditors to disclose key terms and conditions in strictly standardized, text-laden tabular formats just prior to the cardholder agreement form (Harvey, Reference Harvey2014). In the USA, these tables are referred to as Schumer boxes, in recognition of the senator who proposed them in the mid-1980s, but they may go by different names (e.g., transparency boxes, honesty boxes, information boxes, etc.) in other jurisdictions. These boxes typically contain information about interest rates, fees, grace periods, and minimum repayment amounts. Their goal is to ensure that consumers are made aware of and understand key terms and conditions that the regulator believes are critical to making an informed choice, and to facilitate cross-product comparisons [see Renuart & Thompson (Reference Renuart and Thompson2008) and Fleming (Reference Fleming2018) for reviews].
Additionally, mandated presentation standards may be different for different credit features in the Schumer box (hereafter, information box). For instance, in the USA, an amendment to the Truth in Lending Act (TILA) stipulates that long-term interest rates must be disclosed in fonts that are slightly bigger and bolder than those found elsewhere in the information box. According to the Federal Reserve Board (2000), the logic behind this requirement is ‘… to highlight the significance of this information, particularly in light of the larger type sizes typically used by card issuers to promote introductory rates’ (p. 58907) and to ensure that the annual percentage rate (APR) is not obscured by other terms. Consumer advocates generally believe that the type-size requirement is appropriate, whereas industry advocates argue that highlighting the APR reduces the conspicuity of other key features. While interview-based evaluations suggest that the larger font size enables consumers to more accurately identify this rate (Macro Intl Inc., 2007), laboratory tests have shown little to no discernible effect of this particular presentation standard on credit card choice (Braunsberger et al., Reference Braunsberger, Lucas and Roach2004, Reference Braunsberger, Lucas and Roach2005).
The goal of this article is to evaluate whether introducing a more dramatic increase to visual salience than is stipulated by regulators can influence credit card choice in a situation that permits a direct, side-by-side comparison between two cards. In particular, drawing inspiration from food choice studies (e.g., Milosavljevic et al., Reference Milosavljevic, Navalpakkam, Koch and Rangel2012), we investigate whether we can influence credit card choice by making one or two credit card features much brighter, and, therefore, relatively more salient visually, than others. We first provide some theoretical background, then describe our experimental design and analysis, and end with a discussion on the implications of our findings for policy.
Theoretical background
Regulators often base their decisions on the assumption that consumers in the financial marketplace are ‘econs’ rather than ‘humans’ (Thaler & Sunstein, Reference Thaler and Sunstein2008) and will ‘review and understand the disclosed information and then take it into account when making decisions’ (Behavioral Insights Team and Ontario Securities Commission, 2019, p. 4). However, studies in the laboratory and field have shown that many legislated disclosures are demonstrably ineffective despite conforming to regulatory statutes, a point that has been raised and repeated by scholars and supported by behavioral data for almost half of a century (e.g., Day, Reference Day1976; Cude, Reference Cude2005; Ben-Shahar & Schneider, Reference Ben-Shahar and Schneider2011; Loewenstein et al., Reference Loewenstein, Sunstein and Golman2014; Lunn et al., Reference Lunn, McGowan and Howard2018; Page, Reference Page2021). As documented by the Ontario Securities Commission (OSC) and Behavioral Insights Team (BIT; 2019), there are at least three broad barriers that delimit the effectiveness of financial disclosures: (1) people tend not to read them completely, (2) even if they read them, they may not understand, and (3) even if they understand them, they may not act in their best financial interest. To address the first barrier, the OSC and BIT have recommended using relative visual salience to draw attention to relevant text or documents. Recognizing that the manner in which information is provided matters, the Consumer Financial Protection Bureau (CFPB) has identified this as a priority research area (Johnson & Leary, Reference Johnson and Leary2017).
In line with the OSC and BIT's recommendation, research establishes that relative visual salience can determine the order in which information will be attended (e.g., Treisman & Gelade, Reference Treisman and Gelade1980; Duncan & Humphreys, Reference Duncan and Humphreys1989; Theeuwes, Reference Theeuwes1994; Itti & Koch, Reference Itti and Koch2001; Hilchey et al., Reference Hilchey, Taylor and Pratt2016; Wolfe & Horowitz, Reference Wolfe and Horowitz2017). When information stands out perceptually from its surroundings on an attention-guiding dimension (e.g., color, luminance, motion), then attention may initially be drawn toward it [Theeuwes, Reference Theeuwes1991, Reference Theeuwes1992; Theeuwes et al., Reference Theeuwes, Kramer, Hahn and Irwin1998; Theeuwes et al., Reference Theeuwes, De Vries and Godijn2003; see also Theeuwes (Reference Theeuwes2010) for review]. The relative visual salience of information, in combination with an individual's capacity for endogenously representing what it is that they are looking for and their experiences with the information, determines what will attract and sustain attention (Awh et al., Reference Awh, Belopolsky and Theeuwes2012; Failing & Theeuwes, Reference Failing and Theeuwes2018; Hilchey & Taylor, Reference Hilchey, Taylor, Soman and Yeung2021). In principle then, visual salience can be used by policymakers to help ensure that people process first whatever information matters most, but subtle visual differences of the sort legislated by the amendment to the TILA are much less likely to command attention (Rauschenberger, Reference Rauschenberger2003).
One issue with using visual salience to draw attention to a particular credit card feature is that it may lead directly or indirectly to untoward effects on choice (Orquin et al., Reference Orquin, Perkovic and Grunert2018). Since not all information can be fully processed at first blush, many financial product choices may not be fully informed for lack of motivation or capacity to exhaustively examine all relevant information (Simon, Reference Simon1955; Caplin et al., Reference Caplin, Dean and Martin2011; Gabaix, Reference Gabaix, Bernheim, Della Vigna and Laibson2019), which tends to be the rule, not the exception, for how people deal with financial disclosures. In nonexhaustive search, only information that is considered before the decision to stop searching can factor into product choice. The implication of nonexhaustive search is, thus, that visually salient information, which is more likely to be attended early on than nonsalient information, is guaranteed to have a disproportionately large impact on which product is chosen.
From other perspectives, the effect of relative visual salience on choice is more direct. Sequential sampling models suggest an amplifying role of attention on the information accrual rate toward some predetermined decision threshold [e.g., Krajbich et al., Reference Krajbich, Armel and Rangel2010; see Orquin & Loose (Reference Orquin and Loose2013) and Krajbich (Reference Krajbich2019) for reviews]. For instance, according to Towal et al. (Reference Towal, Mormann and Koch2013)'s drift-diffusion model, perceptual choice (i.e., eye gaze or overt attention) is determined by the weighted combination of a product's relative visual salience and subjective value, with increased salience and value increasing the probability that a product will attract and maintain eye gaze. Product choice is influenced by how long any given product is looked at because the amount of attention to a product determines the extent to which information about it can contribute to the decision to choose it. Simply put, even if all product information is attended to, it need not be attended to in equal measures, and it is this inequality that can influence choice. Theoretically, visual salience may, thus, influence the decision process either indirectly (by excluding important nonsalient information from consideration) or more directly (by determining the weight that is placed on any given product information relevant to a decision).
This hypothesis that choice (and not just attention) can tend toward visually salient options is not only suggested by theory. It is well supported empirically by laboratory food and nutrition choice studies (Bialkova & van Trijp, Reference Bialkova and van Trijp2011; Milosavljevic et al., Reference Milosavljevic, Navalpakkam, Koch and Rangel2012; Towal et al., Reference Towal, Mormann and Koch2013; Peschel et al., Reference Peschel, Orquin and Loose2019; Bogomolova et al., Reference Bogomolova, Oppewal, Cohen and Yao2020; Dai et al., Reference Dai, Cone and Moher2020). To provide just one seminal and presently relevant example, Milosavljevic et al. (Reference Milosavljevic, Navalpakkam, Koch and Rangel2012) varied the relative visual salience of items in a food choice task by making one brighter than others. Their results suggested that salience was a robust predictor of choice across all tested food exposure durations, especially when food preference was relatively weak, and choice was made under high cognitive load.
Objective
Our focus is on determining whether the relative visual salience of a credit card feature affects choice. We are investigating credit cards because these are well-known financial products with complex, multidimensional pricing schemes. Their multidimensionality allows us to display one or more of their familiar features more prominently than others. We are also investigating the role of visual salience on credit card choice because research suggests that consumers do not consistently choose the most cost-minimizing credit card products (Agarwal et al., Reference Agarwal, Chomsisengphet, Liu and Souleles2015; Carpenter et al., Reference Carpenter, Huet-Vaughn, Matthews, Robbett, Beckett and Jamison2021).
In our work, we determine whether credit card choices shift toward the product that outperforms the other on an unequivocally salient visual feature by altering relative feature brightness. We are following in the footsteps of the Milosavljevic et al. (Reference Milosavljevic, Navalpakkam, Koch and Rangel2012) study on food choice by altering the salience of a product's feature – not the product itself – by increasing its relative brightness. The general approach involves a straightforward online computer-based task that forces a choice between two competing credit card offers, the features of which are displayed simultaneously in tabular format against a dark background. The tables contain all credit card features that are required to be on display by Canada's Cost of Borrowing (Banks) Regulations, but for expository purposes, we have relaxed and modified the visual presentation standards to enhance the visual salience of key terms. We do this by manipulating between-subjects whether the rows in the table containing the annual interest rate, annual fee, both, or neither are relatively salient by making them much brighter than the rows containing other information. That is, each participant is randomly assigned to one of four conditions in a 2 (Annual Fee: visually salient vs. not) × 2 (Interest Fee: visually salient vs. not) factorial design. The choice is made in the context of a hypothetical scenario in which the cards differ only on their interest rates and annual fees, but the cost of carrying the average monthly balance on either of the two cards is equivalent over the lending term. This kind of scenario is chosen to help ensure that any formal cost–benefit analysis attempted by the consumer will not decisively favor either option, which should theoretically make it more difficult for consumers to define their preference and allow for the effect of visual salience to hold greater sway.
While it is important to note that a forced comparison between credit cards on the basis of their tabled features is likely to depart from how information boxes are used by consumers (if they are used at all during cross-product comparisons), it is worth reiterating that the purpose of these boxes is to facilitate comparisons between financial products on key terms and conditions. It is also worth pointing out that banks already provide tools on their websites to enable consumers to make side-by-side comparisons between credit cards on the basis of features that the lender voluntarily discloses in tables, whereas tools that enable consumers to compare between credit cards on the features that regulators judge as important are conspicuously absent. Upon documenting substantial effects of visual salience on credit card choice that are consistent with extant theory, we discuss the implications of using visual salience to attract attention to financial disclosures.
Method
Participants
We planned to collect data from 1600 participants, as power simulations with logistic regressions revealed that a sample size of 1600/4 conditions would be sufficient for detecting an absolute difference of 10% between any two conditions with at least 80% power at a conventional alpha level (0.05) for statistical significance. In the end, 1615 participants aged 18 years and older, living in Canada or the USA, were recruited through Amazon's Mechanism Turk platform between May 29, 2020 and June 24, 2020 (Buhrmester et al., Reference Buhrmester, Kwang, Gosling and Kazdin2016; Difallah et al., Reference Difallah, Filatova and Ipeirotis2018).Footnote 1 Each participant received informed consent, was compensated $0.70 USD for completing the experiment, and was debriefed afterward. From consent to debriefing, the experiment duration was variable but generally took 5–15 minutes to complete.
Procedure
The experiment was hosted on pavlovia.org, built in PsychoPy (Peirce et al., Reference Peirce, Gray, Simpson, MacAskill, Höchenberger, Sogo and Lindeløv2019), customized with Javascript code components and set to run in full-screen mode on laptops and desktops. The experiment was incompatible with cellular devices and tablets. All visual stimuli were rendered in gray (RGB: 128, 128, 128) or white (RGB: 255, 255, 255) and were displayed against a black background (RGB: 0, 0, 0). All text was displayed at 1/40 the size of the display window.
Prior to the experimental component of the design, participants reported their age and gender. After the experimental component, participants reported their country of residence (freeform), their highest level of educational attainment (freeform), and their relative preference for low annual fees or low interest rates (multiple choice) and then completed a three-question financial literacy test called the ‘Big Three’ (multiple choice; Lusardi & Mitchell, Reference Lusardi and Mitchell2011; see Supplementary Appendix for one full run of this study).
To begin the experimental component, each participant first had to correctly answer a question rendered in gray font: ‘Based on the text that you just read [above], what's Matt's favorite game?’ The nonsensical answer was ‘pineapple’, which they had to type in and then acknowledge by pressing the enter key. An incorrect answer ended the session. This question ensured that (1) the font was readable, which was important because it was identical to the nonsalient font that would be used to display select credit card information in the modified information boxes, and (2) participants were paying enough attention to ascertain the nonsensical answer. A correct answer to this question gave way to task instructions followed by a hypothetical credit card choice scenario that was rendered in white at the screen center and held constant across all participants:
You will carry an average monthly balance of $3000 on a credit card of your choosing for 10 months. After that, you will immediately pay off the balance in full and cancel the card. You will make purchases with this card and will always make at least the minimum payment. On the next screen, two credit card offers will be revealed to you. Your goal is to choose the credit card that will cost you the least, given the scenario above. Select the card on the left by pressing the ‘left arrow key’. Select the card on the right by pressing the ‘right arrow key’. Press the spacebar to reveal the cards.
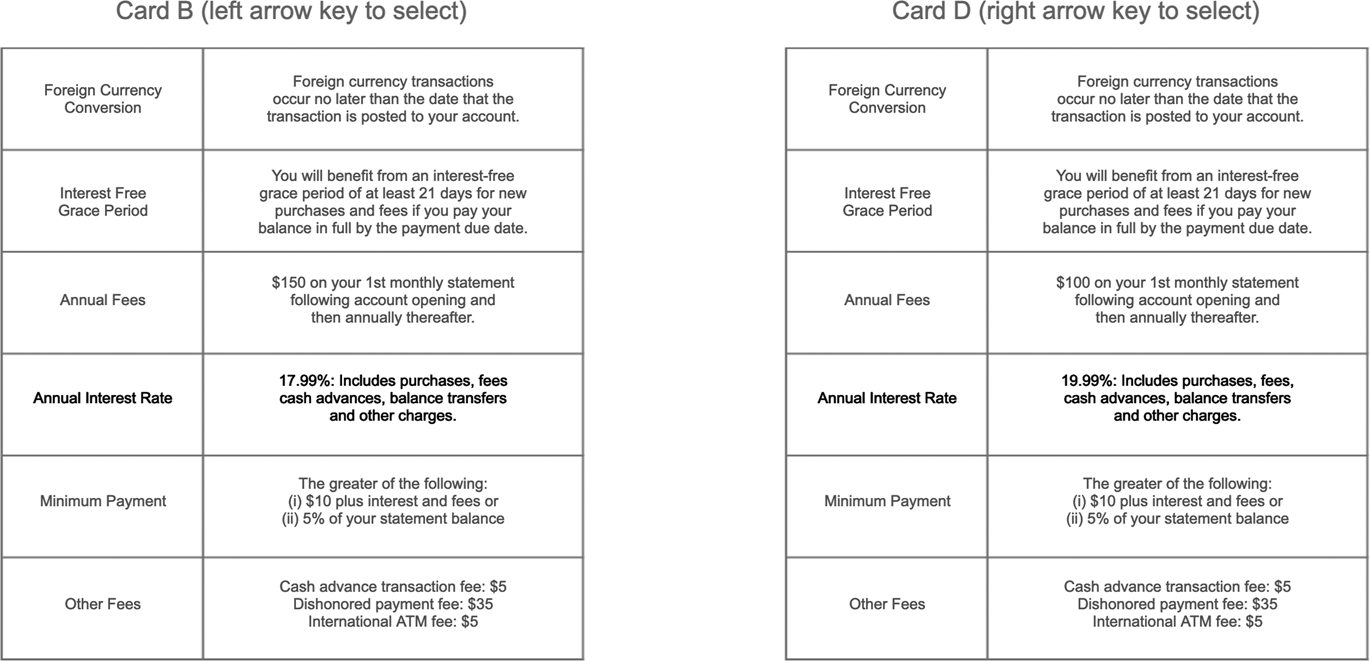
The next display contained two gray-outlined credit card information boxes (37.5% screen width × 62.5% screen height), one centered on the left side of the screen and the other centered on the right (see Figure 1). Each information box contained six evenly spaced rows demarcated by gray lines. A vertical gray line subdivided each box into two columns, with the width of the right column being roughly two times greater than the width of the left. In the left column, each credit card feature mandated by the Cost of Borrowing (Banks) Regulations appeared on a separate row: (1) Annual Fee, (2) Annual Interest Rate, (3) Interest-Free Grace Period, (4) Minimum Payment, (5) Foreign Currency Conversion, and (6) Other Fees. In the right column, there was a standard text-based description of the card feature along with relevant values. The order of the rows within each box was randomized, with the constraint that both boxes follow the same order. All credit card information was held constant across all cards and participants except for the annual fee and annual interest rate values. These were determined by an algorithm that randomly sampled interest rates (between 10.99% and 21.99%, separated by 1%) and annual fees (50, 100, 150, or 200) for the two card offers until the cost of carrying the balance on either card was equivalent over the lending term, with the constraint that the interest rates could not be equal. In effect, the algorithm ensures that one card has a higher annual fee and the other a higher interest rate within reasonable bounds. Whether the card offer on the left or right contained the lower interest rate was randomly determined. Finally, depending on random assignment, either the interest rate, annual fees, neither, or both were displayed in white, whereas all other text-based information onscreen was displayed in gray. This was the critical visual salience manipulation. Irrespective of the monitor, the contrast between white and gray and white and black (the background) would have been stark, causing white-rendered text to appear salient or as though it pops out.Footnote 2
An example of the display forcing a choice between two credit card options with contrast reversal for legibility. Depending on random assignment, either the annual interest rate was displayed saliently (shown), the annual fee was displayed saliently, both annual fee and interest rate were displayed saliently, or neither was displayed saliently.

This first scenario was followed by five more hypothetical credit card choice scenarios of the same form but that did not involve computing a trade-off between annual fees and interest rates. This is because the card with the lower interest rate also had the lower annual fee. The rates and fees for each scenario were determined by an algorithm that randomly sampled twice from the interest rate and annual fee lists, without replacement, and then randomly assigned the lowest and highest sampled values in each list to the left or right box. The average monthly balance in each scenario was also randomly determined as either $1000, $2000, $3000, $4000, or $5000. The information boxes for these five scenarios honored the salience condition to which the participant was assigned, such that either the annual interest rate, annual fee, both, or neither were displayed saliently. These five scenarios served as attention and/or comprehension checks, otherwise known as catch trials. If the participant understands that lower interest rates and annual fees are desirable and are paying attention, then they should have no trouble selecting the card that would lead to the lowest financial cost. Statistically speaking, it is unlikely that participants would get all five of the scenarios right if they did not understand or were not paying attention (p = 0.06 with an exact binomial test). Further, if the nonsalient font is legible, then the proportion of participants who successfully complete the catch trials should be similar across the four salience conditions. These five scenarios were followed by the aforementioned education and finance questions and then by a debriefing form.
Analysis plan
The main analysis involves running logistic regressions with annual fee salience and annual interest rate salience as two-level predictor variables of choice of the low annual fee card, which is a binary outcome variable. We plan to exclude participants who respond incorrectly to a catch trial, largely because we are unable to determine whether their responses are due to inattention, poor comprehension, defiance, or some combination (see the subsection ‘Descriptives and exclusions’ for more details). We compare goodness of fit between regression models with and without these predictor variables using likelihood-ratio tests. We also evaluate whether adding the relative location of the card feature in the information boxes (i.e., the annual interest rate appears above or below annual fee) can improve the fit. We subsequently build logistic regressions hierarchically to explore whether financial literacy score can influence credit card choice share, independent of or depending on the visual salience manipulations. Finally, we use analyses of variance (ANOVAs) to evaluate effects of salience on response time, which may attest to the extent to which information was processed. All analyses are carried out using ‘R’ statistical software (R Core Team, 2015).
Results
Descriptives and exclusions
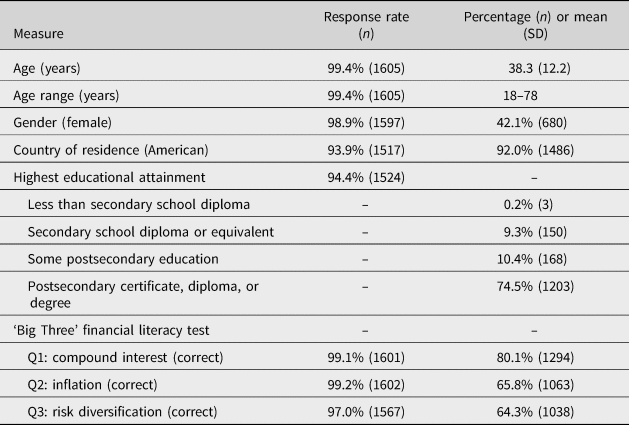
Demographics of the sample and scores on the ‘Big Three’ financial literacy test are presented in Table 1. The mean age is 38.3 years (range 18–78); 42.1% of participants are female, and 92.0% of participants report the USA as their country of residence. The sample is highly educated, with an overwhelming majority having graduated from high school, and 74.5% reporting a postsecondary degree, certificate, or diploma as their highest level of educational attainment. Finally, 80.1% of participants respond correctly to question 1 of the ‘Big Three’, which is particularly relevant because it assesses comprehension of compound interest. Accordingly, most participants in the sample possess at least a rudimentary understanding of interest.
Demographic characteristics and percent correct on each question of the ‘Big Three’ financial literacy test.

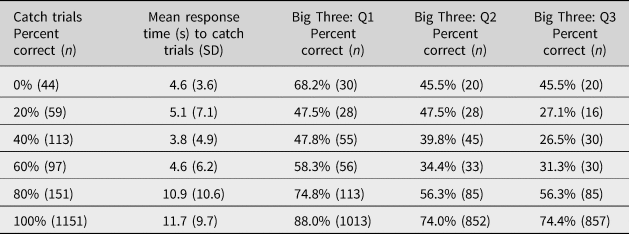
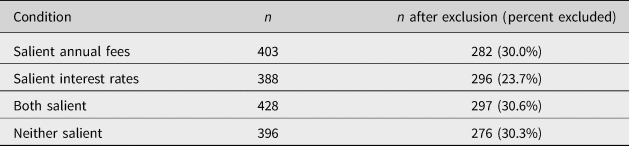
The main question is whether increasing the visual salience of credit card features disclosed in tabular format can influence choice when there is competition between two cards that forces a trade-off between annual fees and interest rates. To address this question, we exclude from all analyses, unless otherwise noted, all participants who responded incorrectly to one of the catch trials. The exclusion generally ensures that all remaining participants (1) consistently compared between card offers (i.e., made informed responses) and (2) acted as though lower interest rates and annual fees were desirable. This exclusion leads to the removal of 464 (or 28.7% of) participants from the data set (see Table 2), split roughly evenly across all experimental conditions (see Table 3).
Breakdown of exclusions segmented by the number of incorrect catch trial responses and the percent correct for each segment on each question on the ‘Big Three’ financial literacy test.

Breakdown of the data loss in each experimental condition, following exclusions for incorrect responses on catch trials.

Effects of visual salience on credit card choice
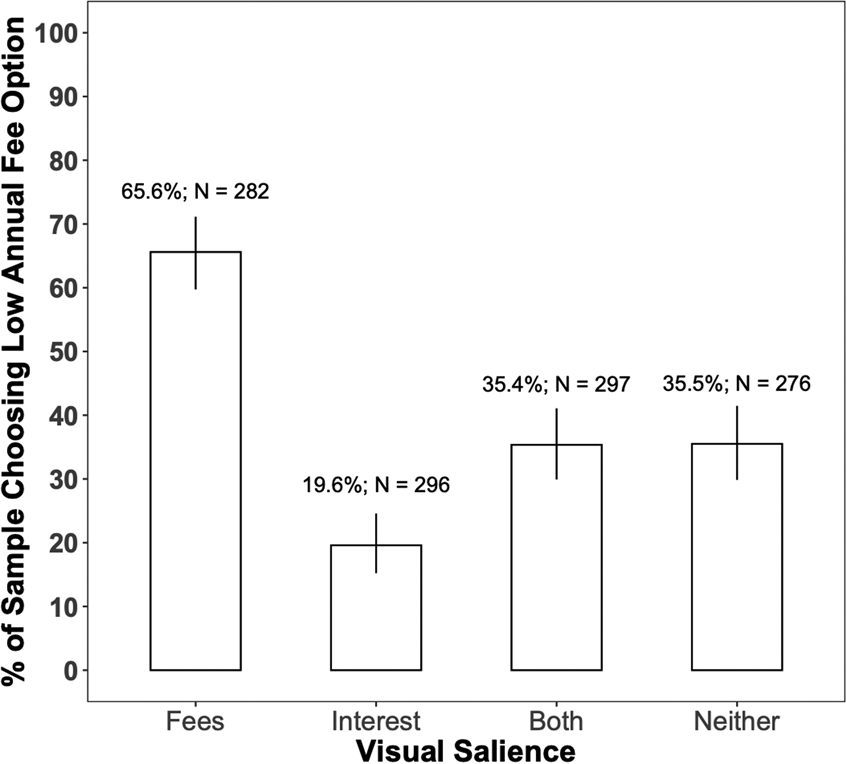
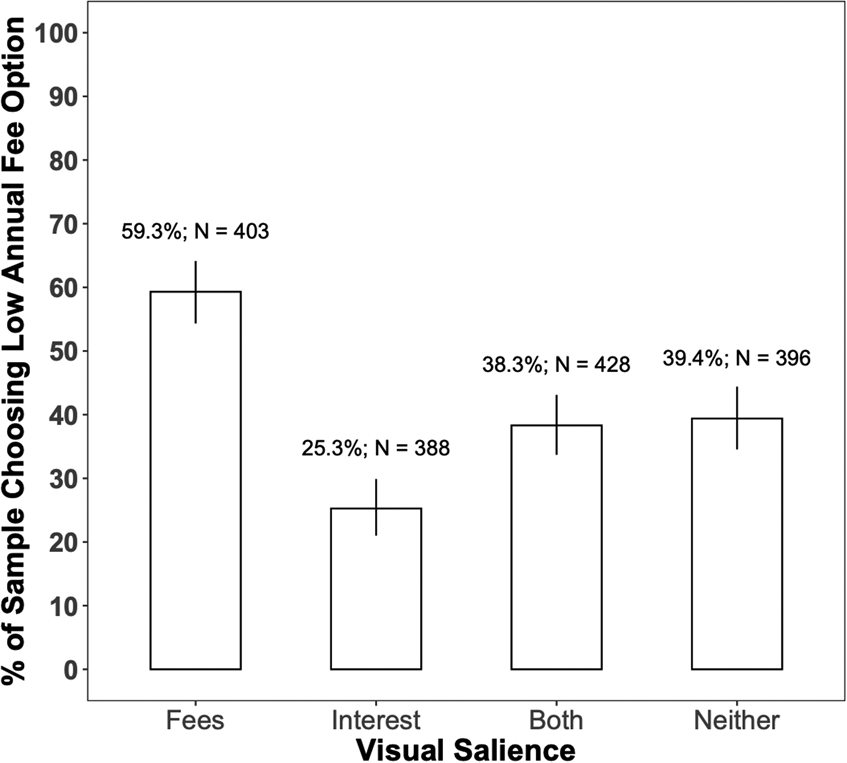
Credit card choice (low annual fee card selected; yes or no) is modeled with logistic regressions adding in stepwise annual fee salience (salient or not), then annual interest rate salience (salient or not), and then their interaction as predictors. Likelihood-ratio chi-square tests show that adding fee salience significantly improves goodness of fit, χ 2 (1149) = 63.9, p < 0.001, as does subsequently adding interest rate salience, χ 2 (1148) = 69.4, p < 0.001. The fit is improved marginally by adding the interaction term, χ 2 (1147) = 2.78, p = 0.10. The best-fitting and most parsimonious model, thus, predicts credit card choice from the additive effects of annual fee salience [b = 1.04, 95% confidence interval (CI) = 0.79–1.30] and annual interest rate (b = −1.06, 95% CI = −1.31 to −0.81). These coefficients correspond to odds ratios of 2.84 (95% CI = 2.20–3.67) for annual fee salience and 0.35 (95% CI = 0.27–0.45) for annual interest rate salience. Put simply, mostly interest-savvy participants who are definitively paying attention to at least one credit card feature tend strongly toward the card with the lower annual fee when it is visually salient, whereas they tend strongly toward the card with the lower annual interest rate when it is visually salient (see Figure 2). Note that both predictors remain significant when no exclusions are made, but understandably their predictive power is weakened (see Figure 3; annual fee salience: b = 0.71, 95% CI = 0.51–0.92; annual interest rate salience: b = −0.76, 95% CI = −0.96 to −0.56). This weakening is anticipated by the belief that a nontrivial proportion of excluded participants either did not compare between credit cards, did not understand the interest rate term, were defiant, or were some combination of these. Consistent with the idea that a large proportion of participants were not reliably comparing between credit cards, error-prone participants also responded, on average, twice as fast on catch trials as compared with participants who made only one or no errors (see Table 2).
Percentage of participants in each experimental condition choosing the card with the lower annual fee, after excluding participants for poor performance on catch trials. N = the total number of participants in the condition; % = the percentage of N that chose the low annual fee card. On the x-axis, Fees = annual fee is salient; Interest = interest rate is salient; Both = both fees and interest are salient; Neither = neither fees nor interest are salient. The error bars are 95% CIs conservatively estimated by the Clopper–Pearson method.

Percentage of participants in each experimental condition choosing the card with the lower annual fee, before excluding participants for poor performance on catch trials. N = the total number of participants in the condition; % = the percentage of N that chose the low annual fee card. On the x-axis, Fees = annual fee is salient; Interest = interest rate is salient; Both = both fees and interest are salient; Neither = neither fees nor interest are salient. The error bars are 95% CIs conservatively estimated by the Clopper–Pearson method.

Adding to the best-fitting model, the location of the annual fees relative to the location of the annual interest rates (i.e., annual fees appear either above or below the interest rate) improves the fit, χ 2 (1147) = 3.91, p = 0.05, but negligibly relative to the visual salience predictors (b = −0.25, 95% CI = −0.51–0). If there is an effect, it occurs because the lower annual fee card is more likely to be chosen when the annual fee appears above the annual interest rate instead of below it in the tables (40.9% vs. 36.7%, respectively). Additional model comparisons provide no support for an interaction between this predictor and the visual salience predictors (all ps > 0.20). On account of its weak effect and insignificant relationship with the visual salience variables, this predictor was dropped from subsequent analyses.
Effects of financial literacy on credit card choice
We undertook an exploratory analysis to evaluate whether adding financial literacy can improve the model fit or moderate effects of visual salience. First, each financial literacy question in the Big Three is scored as either correct (1) or incorrect (0), with ‘refuse to answer’, ‘do not know’, and incorrect responses all being scored as errors. The scores for each question are then summed for each participant to create a financial literacy score, which is treated as a continuous predictor variable in subsequent models. Before getting to the models, it is prudent to examine the distribution of these literacy scores for imbalance. Most participants (59.3%; n = 682) respond correctly to all three questions, whereas only 22.2% (n = 255) respond correctly to two of three, 14.4% (n = 166) respond correctly to one of three, and 4.2% (n = 48) provide no correct responses. Generally speaking, this imbalance precludes a meaningful estimate of credit card choice share for participants who completely flunked (0/3) the financial literacy test, with some cells in the full design containing only eight estimates (range = 8–20).
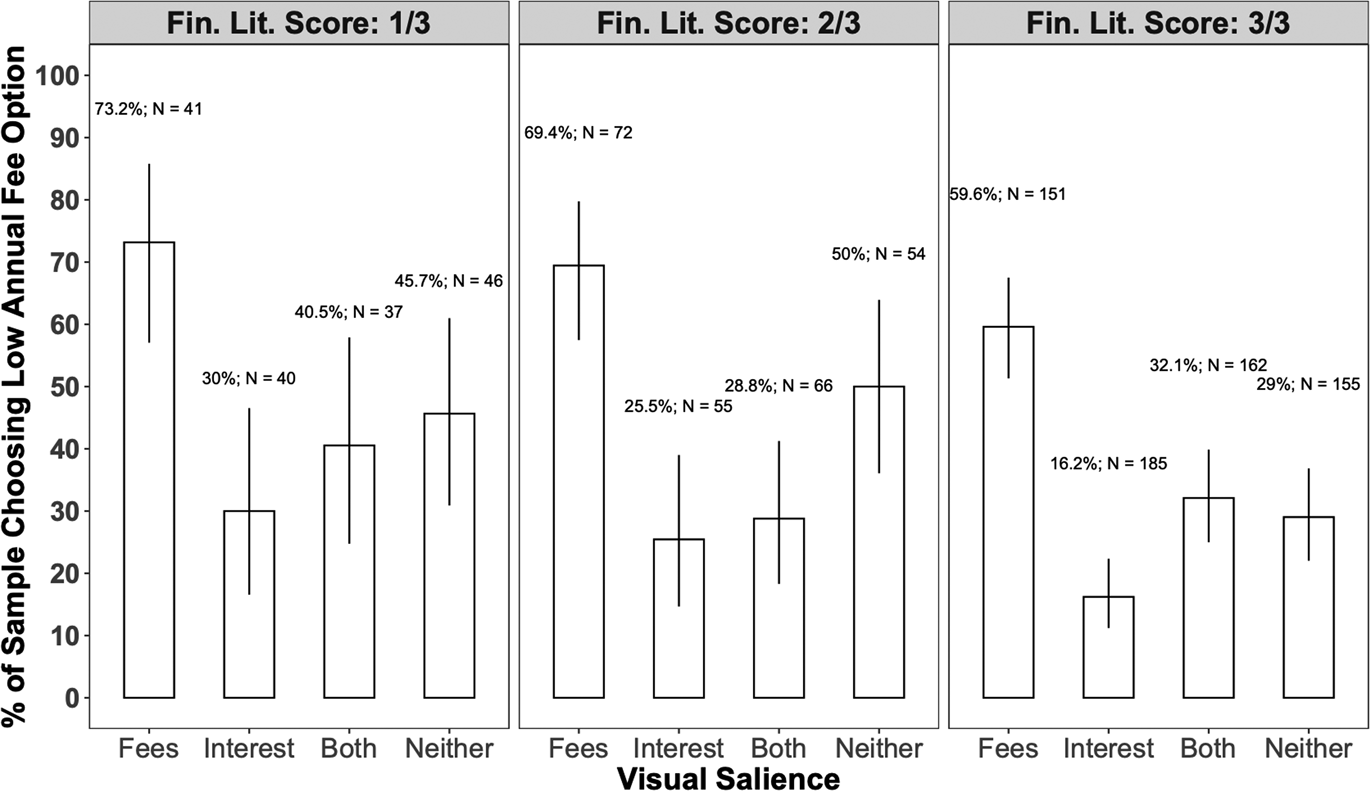
For the purpose of providing some sense of how financial literacy influences card choice share, we retained for these analyses only those participants who got at least one financial literacy question right. Adding as a predictor the three-level financial literacy variable to the model does improve goodness of fit relative to the model that only includes the visual salience variables as additive predictors, χ 2 (1098) = 2.78, p = 0.004. The basic effect of financial literacy is such that participants who score higher on financial literacy are more likely to choose against the card with the lower annual fee (b = −0.29, 95% CI = −0.46 to −0.12), with only 33.7% (n = 230) of participants with a perfect score choosing the card with the lower annual fee and 47.0% (n = 78) and 43.5% (n = 111) choosing the card with the lower annual fee for the 1/3 and 2/3 literacy scores, respectively. It is worth noting that, in the model, financial literacy is a much weaker predictor than either of the visual salience predictors (annual fee salience: b = 0.97, 95% CI = 0.71–1.23; annual interest rate salience: b = −1.07, 95% CI = −1.33 to −0.81). The fits do not improve significantly by including interactions between visual salience predictors and financial literacy (all ps > 0.10), but we advise caution in the interpretation of these findings, given that participants with low financial literacy scores are relatively undersampled. Nevertheless, the results clearly suggest that credit-savvy individuals’ card choice is strongly affected by visual salience and more weakly suggest that any moderating role of financial literacy is minor (see Figure 4).
Percentage of participants in each experimental condition choosing the card with the lower annual fees stratified by financial literacy score (columns). N = the total number of participants in the condition; % = the percentage of N that chose the low annual fee card. On the x-axis, Fees = annual fee is salient; Interest = interest rate is salient; Both = both fees and interest are salient; Neither = neither fees nor interest are salient. The error bars are 95% CIs conservatively estimated by the Clopper–Pearson method.

Effects of visual salience on response time
Visual salience may reduce response times for at least two different reasons. The first is that it is easier to make out the identity of something that stands out from the background relative to something that does not, even when the eyes are fixated on it. This is a perceptual factor. The second is that search may terminate prematurely in the context of salient information sources, either indirectly because the decision threshold is already low or directly because attention rapidly amplifies the evidentiary value of relevant salient information toward a decision threshold. These are cognitive factors. While we may not be able to readily distinguish between them, certain response time patterns would implicate a role for cognitive factors.
The choice response times to the scenario forcing a trade-off between annual fees and interest rates are highly variable (M = 37.0 s; SD = 36.8; range 0.9–393.3 s), likely owing to some combination of different monitor settings, environments, and individual differences. The distribution shows significant rightward skewness (3.05; z = 23.21, p < 0.001). Some response times are well in excess of three standard deviations of the mean, with seven participants having spent over three minutes on the credit card choice screen. Accordingly, all response time data were first converted to z-scores to detect outliers (>3 SDs from the sample mean). In total, 27 response times exceeded three standard deviations from the mean and these were excluded from further analysis.
The remaining response times were analyzed with a 2 (annual fee salience) × 2 (annual interest rate salience) ANOVA. The main effect of annual fee salience was not significant, F(1, 1121) = 1.63, p = 0.20, whereas the main effect of interest rate salience was significant, F(1, 1121) = 15.0, p < 0.001, as was their interaction, F(1, 1121) = 16.5, p < 0.001. The significant effect, nonsignificant effect, and interaction remain when the response time data are log-normalized. The pattern is such that response times are especially slow when neither values are salient (M = 40.8 s; SD = 27.5), especially fast when the annual interest rate is salient (M = 28.3 s; SD = 25.3), and somewhere in between when either both are salient (M = 32.4 s; SD = 26.5) or the annual fee is salient (M = 32.1 s; SD = 26.1). The pattern suggests definitively that non-interest-related content in the information boxes is processed relatively superficially when the interest rate alone is salient. The pattern can also be taken to suggest generally that participants process the contents of the information boxes selectively when they contain visually salient information. Finally, so long as everything in the information box other than annual fees and interest rates is irrelevant, increasing the relative visual salience of both terms results in a genuine performance advantage, given that choice share is roughly equal between salient and neither salient conditions, whereas responses times are faster in the former.
Discussion
When consumers make a choice between two credit cards whose features are disclosed in information boxes, choice shifts toward the product that outperforms the other on a visually salient feature. Visual salience can certainly affect choice, and this conclusion is robust in a large random sample of individuals that generally acted as though lower annual fees and interest rates are desirable. Financial literacy also factors in, such that consumers who achieve higher scores on the ‘Big Three’ financial literacy test show a greater tendency toward the credit card with the lower annual interest rate, but in this context, the magnitude of the financial literacy effect is much weaker than that of visual salience. Moreover, the findings strongly suggest that the effect of visual salience on credit card choice is robust even among consumers who demonstrate relatively high levels of financial literacy.
The effects of visual salience on response time are consistent with prevailing attention models of choice, in that nonsalient information is processed more cursorily when entered into competition with salient information. Theoretically, visual salience is affecting choice either because the consumer is not motivated to seek out information beyond that which is made salient (i.e., a form of satisficing) or because salient information attracts and holds attention for a longer period of time than nonsalient information, which likewise allows salient information to make a greater contribution to the decision than nonsalient information. These theories allow the possibility that the relative upweighting of salient information can occur because consumers believe that visually salient information is purposely made to stand out on account of its importance to decision-making, but future research is needed to pinpoint with certainty any metacognitive process(es) underlying the effect. In any case, these findings reveal that consumers weight relevant, visually salient credit card features more heavily than relevant, visually nonsalient credit card features when making direct cross-product comparisons.
Implications for effectiveness of disclosures
This study examines a specific situation in which a choice must be made between two credit cards on the basis of a side-by-side comparison of the features that are required to be on display by Canada's Cost of Borrowing (Banks) Regulations. While credit card providers routinely display credit card offers, and select accompanying features, side by side on their websites and brochures, information boxes typically appear in isolation (without any references to competitor terms and rates) just prior to making a final, confirmatory choice and accepting the cardholder agreement. Prior research has shown that the provision of reference information (reference points or ranges) allows consumers to better evaluate and interpret the focal information (Yeung & Soman, Reference Yeung and Soman2005). Accordingly, the absence of external reference points at the time the information box is presented has motivated researchers to show how adding such reference points (e.g., the distribution of interest rates in the market) can improve their effectiveness (Chin & de Bruin, Reference Chin and Bruine de Bruin2019).
When reference information is available, as in the current study, making relevant features salient influences choice. Practically speaking, visual salience can, thus, be used to help ensure that certain features are weighted more heavily when direct comparisons are being made between credit products. However, the findings also reify a concern that was raised by Chin and de Bruin (Reference Chin and Bruine de Bruin2019), in that even if a reference point is provided, a credit issuer can theoretically offset the effect of it by making other product features more salient, either at the time of or before any compulsory disclosure. This theoretical possibility likely translates into practice and could, hence, dampen the desired effects of the disclosure. Another concern is that even if regulators were to succeed at ensuring that a particular feature (e.g., annual interest rates) was attended to first or more often than any other, there would be a potential for unintended side-effects due to heterogeneity in consumers’ preference structures. For instance, consumers who never carry a monthly balance on their card might begin to make comparisons predominantly on the basis of a cost-irrelevant feature (e.g., interest rate) at the expense of say, a higher annual fee.
While it is impossible to represent information in a completely neutral fashion (e.g., Orquin et al., Reference Orquin, Perkovic and Grunert2018), it remains important to evaluate how highlighting select financial information could adversely impact consumers (Gabaix & Laibson, Reference Gabaix and Laibson2006; Grubb, Reference Grubb2015; Lunn et al., Reference Lunn, McGowan and Howard2018). Further consideration may lead to the conclusion that information disclosures should be customized to individual needs and preferences (Australian Securities and Investments Commission and the Dutch Authority for Financial Markets, 2019; Sunstein, Reference Sunstein2019; Lipnowski et al., Reference Lipnowski, Mathevet and Wei2020).
Implications for practice and policy
While we have not yet seen any formal content analysis of credit card marketing materials, we wish to reiterate that our own efforts at visiting Canadian banking websites suggest that, in practice, (1) information boxes are presented in isolation without reference information and (2) rather late in the credit card acquisition process (typically after the consumer has selected a card and just before the consumer agrees to the cardholder agreement).
What would happen if consumers viewed information boxes containing visually salient features but no external reference point, and when the information box is presented toward the end of the credit card acquisition process? We suggest that if a naïve consumer were to have their attention drawn to a previously overlooked card feature in the box via relative visual salience, then there could be no internal representation upon which to make any evaluation. This is because there can be no notion of a fair financial term if the information responsible for developing this notion has been ignored before or during the credit card acquisition process. In such cases, it is unclear how making changes to the presentation standards of theretofore ignored information would affect choice. At best, we suggest that some presentation standards might be expected to stimulate further cross-product comparisons by shocking the naïve consumer into an awareness of their own ignorance.
If the consumer were to have formed some internal representation of what constitutes a fair term, then the consumer could, in principle, draw from this wisdom to evaluate salient terms in the absence of any readily available external reference point. Note that in this case the consumer is expected to have already built up the knowledge to be able judge the value of any given financial term against the market, and that the most vulnerable (or naïve) consumers would – by definition – be unable to profit from such knowledge. Our speculation is that, paradoxically, the success of disclosing a key financial term saliently in the absence of an external referent depends on how well the consumer(s) already knows the going rates. However, it is an open question as to whether making a credit card feature salient in the absence of a salient external reference point at the end of a credit card acquisition process can stimulate further product search or influence choice and, if it can, which consumers (e.g., sophisticated vs. naïve) are most likely to be affected.
Conclusions
Our findings speak directly to the role of making a credit card feature visually salient specifically in contexts in which comparisons between financial products can be made easily on the basis of their features. We, therefore, caution policymakers from believing that salience of information will always influence choice. Field work suggests that financial disclosures can have a sizeable impact on behavior if they draw attention to cost-relevant information before or during the cross-product comparison stages of credit acquisition (e.g., Buell & Choi, Reference Buell and Choi2019), but perhaps not after the choice has been made implicitly or explicitly (e.g., Seira et al., Reference Seira, Elizondo and Laguna-Müggenburg2017). That is, visual salience can be used to help ensure that a particular feature competes in real time for attentional priority with the benefits and feature(s) that creditors already try to make salient. This strategy would theoretically be most effective at influencing choice (for better or worse) if the consumer was indecisive about their preferred credit card features and was under a time pressure or a high cognitive load. This study suggests further that this strategy could be effective on consumers at varying levels of financial literacy.
If regulators wish to ensure that a particular feature is assuredly given more weight, then it is incumbent upon them to ensure that it is disclosed saliently during the cross-product comparison stages of the credit card acquisition process. Doing so should make the disclosed information more competitive with promontory credit features, like introductory rates, as originally intended by the Federal Reserve Board (2000). In other words, we encourage regulators to consider further not only guidelines about the relative salience of key financial information, but also guidelines concerning (1) the provision of reference information to help consumers interpret information and (2) when in the credit card acquisition process the information ought to be provided.
Supplementary material
To view supplementary material for this article, please visit https://doi.org/10.1017/bpp.2021.14.
Acknowledgments
The authors acknowledge financial support from the Social Sciences and Humanities Research Council (SSHRC) of Canada's Partnership Grant program. All three authors are fellows of the Behavioural Economics in Action at the Rotman (BEAR) research center and also acknowledge support from BEAR.