INTRODUCTION
One of the long-standing questions about second language (L2) processing is whether L2 processing differs intrinsically from first language (L1) processing and whether L2 speakers can ultimately acquire the same processing strategies as those of native speakers. This question appears in many aspects of language processing, ranging from phonological to syntactic processing. Here, we consider this question in the context of prosodic and discourse processing: Given that we usually encounter sentences in context, L2 learners must learn how to process sentences as part of a discourse beyond isolated words and sentences to achieve a nativelike level in processing an L2. Despite some studies showing that L2 speakers rely more on discourse-level cues than native speakers (Felser & Cunnings, Reference Felser and Cunnings2012; Felser et al., Reference Felser, Sato and Bertenshaw2009; Pan & Felser, Reference Pan and Felser2011; Pan et al., Reference Pan, Schimke and Felser2015; Patterson et al., Reference Patterson, Trompelt and Felser2014), many other findings imply L2 learners have reduced sensitivity to discourse-level information compared to native speakers (e.g., Belletti et al., Reference Belletti, Bennati and Sorace2007; Cheng & Almor, Reference Cheng and Almor2017; Patterson et al., Reference Patterson, Esaulova and Felser2017).Footnote 1 There are multiple reasons why discourse processing may be a challenge in an L2: Using discourse-level information involves learning new form-function mappings as well as integrating information across different domains of language. As stated by the Interface Hypothesis (Sorace, Reference Sorace2011), bringing multiple sources of information together to derive an appropriate interpretation of an utterance can be especially difficult for L2 learners.
In the present study, we investigate L2 learners’ processing of one particular cue to discourse structure: contrastive pitch accents, which past work has shown that even relatively proficient L2 learners do not process in a fully nativelike way (e.g., Braun & Tagliapietra, Reference Braun and Tagliapietra2011; Lee & Fraundorf, Reference Lee and Fraundorf2017; Lee et al., Reference Lee, Perdomo and Kaan2020; Perdomo & Kaan, Reference Perdomo and Kaan2021). We review differences in how these cues are used in L1 and L2 discourse processing before we consider competing explanations of L1-L2 differences: L2 learners do not have the online-processing capability to consider pitch accenting cues, or L2 learners have not fully acquired the difficult mapping between pitch accent and information status. Then, we introduce our self-paced listening task, which can test whether L2 learners show nonnativelike processing of contrastive pitch accents even when online-processing demands are reduced.
PROMINENCE CUES IN L1 DISCOURSE PROCESSING
Discourse comprehension requires understanding and representing the information structure of an utterance—for example, which information is new or focused in the discourse, and which information is given or backgrounded. The information structure of the discourse can be signaled by various linguistic devices, such as word order variation, morphological marking, and prosody (see Arnold et al., Reference Arnold, Kaiser, Kahn and Kim2013, for review). For instance, in English spoken discourse, one cue that can indicate discourse structure is pitch accenting, a phonological construct realized acoustically with lengthening and increased pitch and intensity. At least two types of pitch accents make different contributions to the information structure of an utterance (Ladd, Reference Ladd2008). The H* presentational pitch accent, which involves a high tonal target, is thought to be associated primarily with new information whereas the L+H* contrastive pitch accent, which involves a high tonal target preceded by a steep rise from a low tone, is thought to signal a contrast between an entity and its alternatives (Pierrehumbert & Hirschberg, Reference Pierrehumbert, Hirschberg, Cohen, Morgan and Pollack1990; Watson et al., Reference Watson, Tanenhaus and Gunlogson2008). For example, in the discourse “John gave me a BOOK. The book had a pretty cover. Then he gave me a PENCIL,” the presence of an H* presentational pitch accent on the first occurrence of book and pencil mark them as new information. By contrast, in the sentence “Open the RED door, not the green door,” the speaker intends to contrast the red door with its alternative, the green door, by producing an L+H* contrastive pitch accent on the color adjective. Using a visual world eye-tracking study, Watson et al. (Reference Watson, Tanenhaus and Gunlogson2008) demonstrated that, while the H* pitch accent may sometimes also be interpreted contrastively, the L+H* pitch accent leads specifically to a contrastive reading.
Ample evidence now suggests that, for native speakers, contrastive pitch accents contribute to successful discourse comprehension. Contrastive pitch accents facilitate online reference resolution, in the face of temporarily ambiguous linguistic input, by favoring referents with a contrastive relation (e.g., a RED ball when there is also a blue ball; Arnold, Reference Arnold2008; Dahan et al., Reference Dahan, Tanenhaus and Chambers2002; Ito & Speer, Reference Ito and Speer2008; Ito et al., Reference Ito, Jincho, Minai, Yamane and Mazuka2012; Nakamura et al., Reference Nakamura, Arai and Mazuka2012; Watson et al., Reference Watson, Tanenhaus and Gunlogson2008; Weber et al., Reference Weber, Grice and Crocker2006). They also influence native speakers’ offline memory for a discourse by enhancing the representation of a specific contrast item (Fraundorf et al., Reference Fraundorf, Benjamin and Watson2013; Fraundorf et al., Reference Fraundorf, Watson and Benjamin2010, Reference Fraundorf, Watson and Benjamin2012).
PROMINENCE CUES IN L2 DISCOURSE PROCESSING
But it is also known that L2 learners have difficulty achieving a nativelike level in making use of contrastive pitch accents to enhance online language processing (e.g., Akker & Cutler, Reference Akker and Cutler2003; Braun & Tagliapietra, Reference Braun and Tagliapietra2011; Chen & Lai, Reference Chen, Lai, Zonneveld and Quené2011; Lee et al., Reference Lee, Perdomo and Kaan2020; Nakamura et al., Reference Nakamura, Arai, Hirose and Flynn2020; Perdomo & Kaan, Reference Perdomo and Kaan2021). For example, Nakamura et al. (Reference Nakamura, Arai, Hirose and Flynn2020) found that Japanese-speaking L2 learners of English failed to interpret L+H* contrastive pitch accents in online reference resolution as a cue to contrast as native English speakers do. A visual world eye-tracking study by Perdomo and Kaan (Reference Perdomo and Kaan2021) showed that L2 learners could establish a relevant contrast set in response to contrastive pitch accents when options for the contrast set were restricted by the visual display. However, L2 learners failed to use contrastive pitch accents predictively, as native speakers did. The authors manipulated the presence of a contrastive pitch accent on possessive proper nouns for sentences including two characters and two objects (e.g., We ate Angela’s ice cream but saved Benjamin’s/BENJAMIN’S cake in the fridge). For native English speakers, a contrastive pitch accent biased eye fixations toward the same object as the previously mentioned one (e.g., ice cream) even before the critical noun (e.g., cake) was heard. Like native speakers, L2 learners were more likely to fixate at the same object (e.g., ice cream) when the proper noun was accented than when it was not. However, for L2 learners, this difference did not come about until after the critical noun (e.g., cake) was heard, suggesting that L2 learners’ use of contrastive pitch accents was not as efficient as that of native speakers.
L2 learners’ nonnativelike processing of contrastive pitch accents is also reflected in their later memory for prominent information (Lee & Fraundorf, Reference Lee and Fraundorf2017). Consider the discourse in (1) in the following text. Emphasizing British in (1) with a contrastive pitch accent may lead native English speakers to retain as part of their discourse representation not just the true proposition that the British found one of the monkeys but also the salient contrastive alternative French. This is seen in the fact that, relative to an H* presentational pitch accent, the L+H* contrastive pitch accent led to a higher rate of correct rejections only of a memory probe referring to the specific contrastive alternative French (The French scientists found the endangered monkey) but not a probe about an unmentioned item from the same semantic category (The German scientists found the endangered monkey; Fraundorf et al. Reference Fraundorf, Watson and Benjamin2010, Reference Fraundorf, Watson and Benjamin2012).
-
(1) Both the British and the French biologists had been searching for the endangered monkeys. Finally, the BRITISH found one of the monkeys in Malaysia and planted a radio tag on it.
However, in representing a spoken discourse, L2 learners do not derive the same benefits from contrastive pitch accents as do L1 speakers. Lee and Fraundorf (Reference Lee and Fraundorf2017) tested Korean-speaking L2 English learners’ memory for an L2 discourse like (1) in the preceding text. They found that low- and mid-proficiency L2 learners did not show any memory effects at all of contrastive pitch accenting. And, for high-proficiency learners, the contrastive pitch accent did affect memory, but not by facilitating rejections of a memory probe about the contrast item. It instead facilitated rejections of a memory probe about an unmentioned item over and above the H* pitch accent. The finding indicates that high proficiency L2 learners were indeed sensitive to different pitch accent types and that the L+H* contrastive pitch accent helped them distinguish an unmentioned item from the set of alternatives. However, the fact that contrastive pitch accents did not lead high proficiency L2 learners to correctly rule out the salient alternative suggests that the representation constructed by L2 learners in response to contrastive pitch accents did not distinguish which is the contrastive alternative from which is the correct item as fully as that of native speakers.
In summary, there is evidence that, empirically, L2 learners do not capitalize on a cue to contrast in spoken discourse in the same way as L1 speakers do. Here, we consider the mechanisms that might explain such a difference.
WHAT DRIVES L2 PROCESSING DIFFERENCES?
A long-standing contrast in the L2 literature is between representational and processing accounts of L1-L2 differences. That is, although L1-L2 difference could arise if L2 learners had not acquired the same knowledge of the language as L1 speakers (or had not acquired it yet), it is also possible that L1-L2 differences could be observed even if L2 learners had similar knowledge of the language to that of L1 speakers but were not able to apply it in the experimental tasks—for instance, because they are slower in their online processing. The Interface Hypothesis (Sorace, Reference Sorace2011) posits limited processing resources as the source of L2 learners’ difficulties integrating multiple kinds of information for interpretation. In principle, this could explain L2 learners’ nonnativelike interpretation of contrastive pitch accents described in the preceding text because they require an interface between different levels of linguistic representation, that is, prosody and discourse structure.
Evidence that L2 learners’ limited processing resources may indeed underlie L1-L2 processing differences comes from the finding that even native speakers’ behavior may become similar to that of nonnative speakers in cognitively demanding situations (Hopp, Reference Hopp2009; Kilborn, Reference Kilborn and Harris1992; MacDonald, Reference McDonald2006). For example, Kilborn (Reference Kilborn and Harris1992) compared L2 speakers’ behavior with that of native speakers on a word monitoring task and found that advanced L2 speakers failed to integrate syntactic information with semantics as rapidly as native speakers during online comprehension. Crucially, native speakers showed a similar performance to that of L2 speakers when they performed the task in the presence of background noise. Hopp (Reference Hopp2009) demonstrated that native speakers’ behavior became similar to that of nonnative speakers in processing inflection when time pressure imposed a cognitive load. These data suggest that, in several other aspects of L2 language processing (e.g., syntactic and semantic processing), nonnativelike performance may be caused by increased cognitive load and reduced processing efficiency and that L1-L2 differences are quantitative rather than qualitative.
Does the processing demand account also apply to L2 comprehension at the levels of discourse and prosodic processing? Some offline studies have shown that, when online-processing demands were minimized, L2 learners were similar to native speakers in interpreting L2 contrastive pitch accents as a signal to contrast (e.g., Takahashi et al., Reference Takahashi, Kao, Baek, Yeung, Hwang and Broselow2018; Takeda, Reference Takeda2018). For example, Takahashi et al. (Reference Takahashi, Kao, Baek, Yeung, Hwang and Broselow2018) found that Mandarin-speaking L2 learners of English were faster to identify a referent that was contrastive in color with the previously activated referent (e.g., scarlet mittens) when a contrastive pitch accent was produced appropriately (e.g., Click on the purple mittens. Now click on the SCARLET mittens), compared to when it was used infelicitously (e.g., Click on the purple necklace. Now click on the SCARLET mittens). This finding suggests that, just like native speakers, L2 learners can infer the discourse status of referents from L2 contrastive pitch accents if they are provided with sufficient time to establish a relevant contrast set. The fact that L2 speakers behave like native speakers in untimed offline tasks when they do not in real-time online tasks suggests that nonnativelike processing of contrastive pitch accents could arise from online-processing demands rather than from a failure to learn the discourse meaning of contrastive pitch accents.
However, the evidence reviewed in the preceding text stems from offline judgment tasks. An even stronger test of the processing demand account is that, even in some online-processing tasks, L1-L2 differences in discourse processing should be negligible so long as there is sufficient time for L2 learners to integrate all the relevant cues. Support for this prediction comes from Lee and Fraundorf (Reference Lee and Fraundorf2019), who found that L2 learners can make nativelike use of other cues to prominence—namely, font emphasis, such as italicization or capitalization in written text, which for native speakers has been observed to promote representation of salient alternatives similarly to contrastive pitch accents (Fraundorf et al., Reference Fraundorf, Benjamin and Watson2013). The authors had L1-Korean learners of L2-English read—rather than listen to—discourses like (1) in which critical words were manipulated for font emphasis (i.e., capitalized or not). Critically, reading was self-paced, so L2 learners had as much time as desired to process the texts. In this task, font emphasis enhanced memory specifically by facilitating rejections of a probe about the contrastive alternative, just as for native speakers. One interpretation of these results is that nonnativelike encoding of contrastive pitch accents may not be due to intrinsic L1-L2 differences in encoding salient alternatives in response to prominence cues in general, but rather the cognitive demands of processing a prominence cue online in addition to words and syntax of running speech during listening (Lee & Fraundorf, Reference Lee and Fraundorf2017); thus, when these online-processing demands were minimized using self-paced reading, L2 learners could make appropriate use of prominence cues.
Nevertheless, an alternate interpretation of the preceding results is that L2 learners show nativelike comprehension of font emphasis (Lee & Fraundorf, Reference Lee and Fraundorf2019) but not prosodic cues (Lee & Fraundorf, Reference Lee and Fraundorf2017) simply because the meaning of font emphasis is easier to learn. In general, the complex-mapping hypothesis (Patterson et al., Reference Patterson, Esaulova and Felser2017; Schafer et al., Reference Schafer, Takeda, Rohde and Grüter2015) states that nativelike discourse processing depends on the complexity of the form-function mapping. For instance, Patterson et al. (Reference Patterson, Esaulova and Felser2017) examined L2 learners’ processing of cues to pronoun resolution. In German and Russian, L1 comprehenders show an “antifocus” effect such that within-sentence ambiguous pronouns are preferentially understood as referring to topicalized entities rather than a clefted (i.e., focused) subject because topichood is considered as a signal of givenness. Despite the fact that German and Russian have a similar focus structure, German-speaking L2 learners of Russian and Russian-speaking L2 learners of German did not show this antifocus effect, which Patterson et al. (Reference Patterson, Esaulova and Felser2017) interpreted as reflecting the complex mapping of syntactic structure to information structure and information structure to pronoun resolution. Schafer et al. (Reference Schafer, Takeda, Rohde and Grüter2015) also showed that nativelike discourse processing depends on the complexity of the mapping. The authors found that L2 learners’ pronoun resolution was nativelike when potential antecedents were produced with a contrastive pitch accent (story continuation task, David/DAVID served/was serving Paul/PAUL a pint of beer. He…): pronouns were associated with an accented antecedent irrespective of whether it was assigned the thematic role of source or goal. However, L2 learners failed to show a nativelike performance in interpreting accented pronouns (David served/was serving Paul a pint of beer. He/HE obviously…), which required a more complex computation in which the accessibility of two potential referents is compared and the pronoun is associated with the less prominent one.
This complex-mapping hypothesis could also explain prior results attributed to processing demands if the typeface convention of font emphasis presents a form-function mapping that is easier to learn than that of contrastive pitch accents. The mapping between specific pitch accent types and specific discourse functions is language-specific and is not explicitly taught in second language classrooms. Recent work also demonstrates that such a mapping is not one-to-one but has inter- and intraspeaker variation (Grice et al., Reference Grice, Ritter, Niemann and Roettger2017). Thus, L2 learners may experience difficulty learning L2 mappings between specific prosodic forms and functions, especially when those mappings do not match those of L1 (Braun & Tagliapietra, Reference Braun and Tagliapietra2011; Chen & Lai, Reference Chen, Lai, Zonneveld and Quené2011; Namjoshi, Reference Namjoshi2015; Ortega-Llebaria & Colantoni, Reference Ortega-Liebaria and Colantoni2014). Further, one of the acoustic properties that distinguish among different types of pitch accenting is the pattern of pitch excursion. However, pitch excursion is used to signal not only information structure but also syntactic structure or speech acts (Pierrehumbert & Hirschberg, Reference Pierrehumbert, Hirschberg, Cohen, Morgan and Pollack1990). For these reasons, the form-function mapping of contrastive pitch accents may require a more complex computation, which could make it difficult for L2 learners to learn. This may be especially true for Korean L2 learners, whose L1 does not use contrastive pitch accents as a signal to contrast (Jun, Reference Jun1993, Reference Jun and Jun2005).
Thus, it is possible that the inherent difficulty of grasping the exact function of the contrastive pitch accents results in the L1-L2 difference in the way the contrastive information is encoded and represented in memory. This view does not necessarily assume that L2 learners would be completely insensitive to the information conveyed by contrastive pitch accents. For instance, L2 learners may construct an alternative set online in response to contrastive pitch accents but still fail to use that information efficiently to make local predictions (Perdomo & Kaan, Reference Perdomo and Kaan2021) or to represent it in memory in a nativelike way, distinguishing what is the salient alternative from what is the critical referent (Lee & Fraundorf, Reference Lee and Fraundorf2017). On this view, reducing online-processing demands might not be sufficient for leading to a nativelike behavior unless L2 learners had a sufficient amount of naturalistic exposure to fully acquire to process and encode contrastive pitch accents.
PRESENT STUDY
The present study explores what gives rise to L1-L2 differences in sensitivity to cues in discourse processing, here examining the memory effects of contrastive pitch accents. We tested whether L2 learners are able to show a nativelike behavior in processing and representing in memory the information conveyed by contrastive pitch accents if online-processing demands are minimized; that is, if the task allows them to take as long as they fully derive a contrastive interpretation and encode salient alternatives while listening. To do so, we adopted a self-paced listening task, which allows participants as much time as desired to process the discourses, just as in reading. We compare the results obtained under this task to previously obtained data on experimenter-paced listening with the same prominence cue and the same materials (Fraundorf et al., Reference Fraundorf, Watson and Benjamin2010; Lee & Fraundorf, Reference Lee and Fraundorf2017), which had revealed differences between L1 speakers and proficient L2 learners; this comparison between self- and experimenter-paced listening effectively varies time pressure across studies.
If L2 learners’ nonnativelike processing and representation of contrastive pitch accents were indeed due to online-processing demands (i.e., the processing-demand hypothesis), we would expect their behavior to converge with that of native speakers in situations in which online-processing demands are reduced. By contrast, if the conflicting results across studies arose from the inherent difficulty of learning a complex form-function mapping of contrastive pitch accents (i.e., the complex-mapping hypothesis), L2 learners’ performance on the self-paced listening task should not differ from their performance on the experimenter-paced listening task.
METHODS
PARTICIPANTS
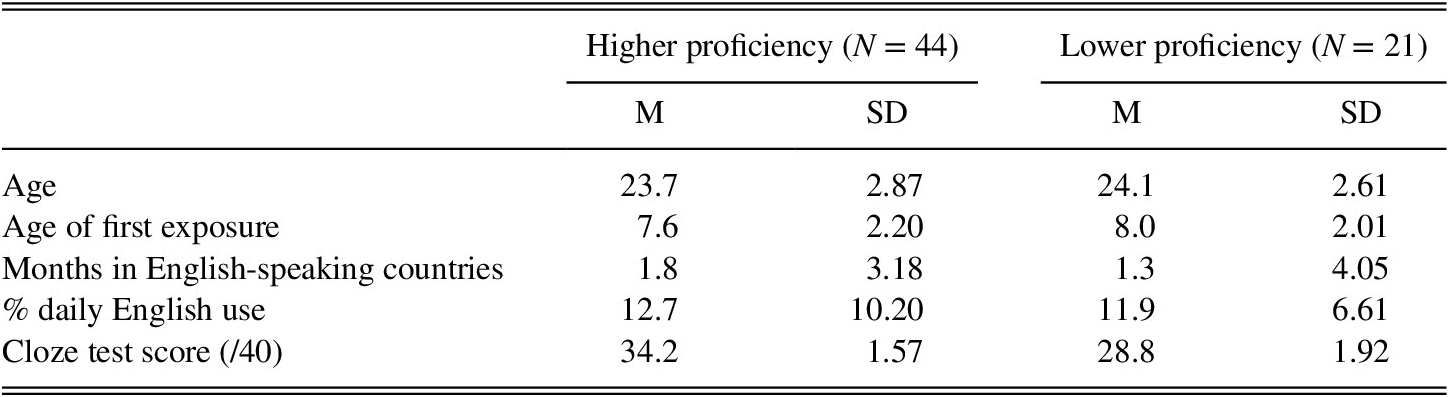
Participants were 62 native English speakers (mean age: 19.0Footnote 2, 22 males, 40 females) and 68 native Korean speakers who learned English as an L2 (mean age: 23.8, 35 males, 30 females). Three L2 participants were excluded due to technical error. Native English speakers were undergraduate students at the University of Pittsburgh and participated in the study for course credit. The L2 participants were undergraduate or graduate students at Yonsei University and were paid for their participation. Their length of stay in an English-speaking country before the age of 15 was no longer than 6 months. We assessed L2 participants’ English proficiency using a multiple-choice cloze test (Lee & Fraundorf, Reference Lee and Fraundorf2017, Reference Lee and Fraundorf2019). In the cloze test, a passage was provided with 40 blanks, and for each blank, participants had to select one from three response alternatives. Table 1 summarizes the L2 participants’ biographical information and cloze test scores. Based on the cloze test scores, we classified the participants into two proficiency groups: higher proficiency and lower proficiency groups. The cutoff point was set at 32, following Lee and Fraundorf (Reference Lee and Fraundorf2017).
Summary of the L2 participants’ biographical information (means and standard deviations)

Note: The percentage of daily English use was self-computed by each participant relative to all daily language activities including reading.
MATERIALS
The stimulus materials consisted of 36 recorded stories taken from Experiment 3 of Fraundorf et al. (Reference Fraundorf, Watson and Benjamin2010). Each story began with a context passage, such as (2a) in the following text, that established two pairs of contrasting alternatives (here, Grand Canyon vs. Everglades and spring vs. fall). Then, each story continued with a continuation passage, such as (2b), that referred to one member from each pair, which we term the critical words.
-
(2a) Steve and his wife had been wanting to visit the Grand Canyon and the Everglades. Steve’s employer told him he could take a week of vacation either in the spring or in the fall.
-
(2b) Steve and his family considered their options before eventually deciding to visit the Grand Canyon in the spring.
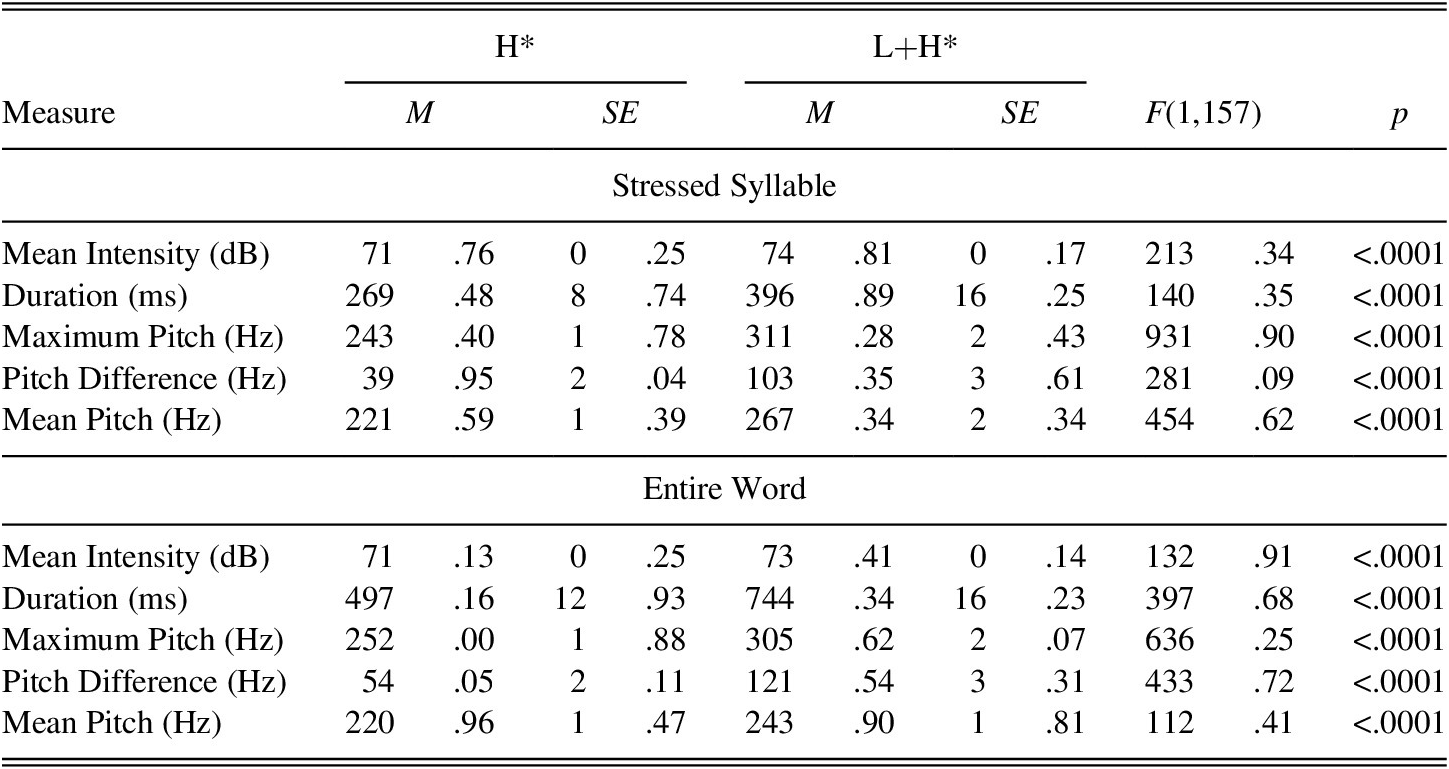
The stories were recorded by a native female speaker of American English with an Inland North American accent (Labov et al., Reference Labov, Ash and Boberg2006). We manipulated whether each of the two critical words in the continuation passage was heard with a presentational (H*) or a contrastive (L+H*) pitch accent, such that each continuation passage could be heard with a contrastive pitch accent on the first critical word, on the second, on both, or neither. (The materials were originally constructed to have two contrast sets per passage to test whether a contrastive pitch accent on one critical word would affect memory for the other. However, Fraundorf et al. (Reference Fraundorf, Watson and Benjamin2010) report no such effects, so we collapse over this variable in the present analyses.) Pitch accenting was manipulated using auditory cross-splicing so that all audio except the critical words was held constant across conditions. Table 2 (Fraundorf et al., Reference Fraundorf, Watson and Benjamin2010, p. 376) presents means and standard errors of acoustic measure verifying that the L+H* and H* conditions differed.
Mean acoustic measures by accent type.

Note: Reprinted from Fraundorf et al., Reference Fraundorf, Watson and Benjamin2010, p. 376. Copyright 2010 by Elsevier Inc.
To test participants’ memory for the stories, two sets of probe statements were constructed for each story—one for each critical word in the continuation, such as (3a)–(3c) in the following text for Grand Canyon and (4a)–(4c) for spring. Each critical word could be tested with either a correct probe describing what happened in the story (3a, 4a), a false contrastive probe in which the correct critical word was replaced by its salient alternative (3b, 4b), or a false unmentioned probe in which the critical word was replaced with a word that was same from the semantic category but that was never mentioned in any of the original stories (3c, 4c). Participants were tested separately on each of the two critical words from every text; the probe statements were constructed so that the probe for one critical word did not reveal the answer to the other. However, each individual critical word was tested only once. Thus, each participant would see one of (3a), (3b), or (3c), and one of (4a), (4b), or (4c).
-
(3a) Steve and his wife decided to go to the Grand Canyon on vacation.
-
(3b) Steve and his wife decided to go to the Everglades on vacation.
-
(3c) Steve and his wife decided to go to Yellowstone on vacation.
-
(4a) Steve and his wife decided to visit a national park for vacation during the spring.
-
(4b) Steve and his wife decided to visit a national park for vacation during the fall.
-
(4c) Steve and his wife decided to visit a national park for vacation during the summer.
These manipulations resulted in a 2 × 3 (pitch accent type × probe type) design. The assignment of items to conditions was counterbalanced across lists using a Latin Square design such that each critical word could appear in each condition; thus, differences across conditions were independent of the particular lexical items.
We also imposed one other control. In example (2) mentioned in the preceding text, the member of each alternative set that is referenced in the continuation passage is also the first introduced in the context passage (e.g., Grand Canyon is mentioned before Everglades in 2a and is also the one referred to in 2b). If this were the case in all items, participants might be able to predict the outcome of the continuation passage even before hearing it. To avoid this possibility, order of mention was varied across items such that, across the stimulus set, the critical word in the continuation passage was mentioned first in the context passage in half of the items but mentioned second in the other half.
PROCEDURE
The experiment comprised a study phase and a test phase. Unlike Fraundorf et al. (Reference Fraundorf, Watson and Benjamin2010), where native speakers were tested with a 24-hour lag between study and test, the test phase immediately followed the study phase as in Lee and Fraundorf (Reference Lee and Fraundorf2017). Participants were instructed in English that they would listen to 36 short stories and that their memory for these stories would be tested after listening to all of them.
For the study phase, we used a self-paced listening task. Participants were told to listen to the stories in a segment-by-segment fashion at their own pace. Each of the 36 stories were segmented into prosodic phrases so that it would have natural segment boundaries as illustrated in (4) in the following text (double slashes indicate segment boundaries). The average number of segments per story was 10.3 across stories (range: 6–17). The two critical words of each story (e.g., Grand Canyon and spring) always appeared in separate segments. The stories were presented in a randomized order.
-
(4) Steve and his wife had been wanting to visit the Grand Canyon // and the Everglades. // Steve’s employer told him // he could take a week of vacation // either in the spring // or in the fall. // Steve and his family considered their options // before eventually deciding to visit the Grand Canyon // in the spring.
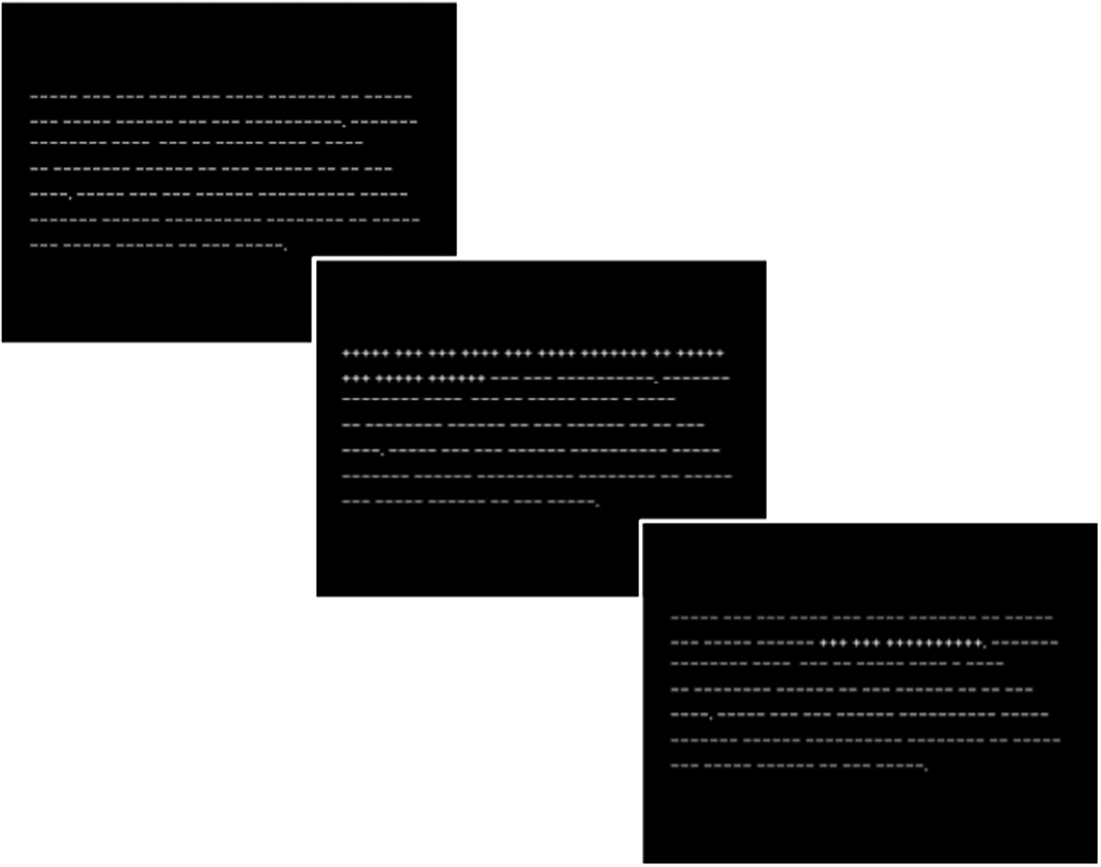
Although the stories were presented only in auditory form, we did display a visual indicator of participants’ progress (see Figure 1). Each trial began with the display of a set of lines, arranged in paragraph form, matched in length to each of the words in the story. Once participants pressed the space bar, the first segment was played, and the lines representing the corresponding words switched to crosses. Participants had to press the space bar to listen to the next segment. Once the next segment began, the crosses in the previous segment were reverted to lines. This display accomplished two purposes: (a) it indicated to participants their progress through each story, which could be rather lengthy, and (b) it closely matched the display of the typical moving-window reading paradigm (except without actual words being displayed), allowing us to compare our present results with those obtained by Lee and Fraundorf (Reference Lee and Fraundorf2019) for identical materials in a self-paced reading task.
Example displays.

During the test phase, participants had to read statements, which were presented one at a time, and indicate whether each statement was true or false by pressing a key on the keyboard. Test stimuli were composed of 72 statements about the stories that they had heard in the study phase (one statement per critical word). We instructed participants to judge the statement as being false if any part of it was not exactly true. The order of the test statements was rerandomized into a different order from the study phase.
RESULTS
We measured online listening time from the offset of each segment to the onset of key press so that it indexed time spent to process the segment before moving on to the subsequent segment. A preliminary analysis indicated no significant effect of accent type on online listening time for both L1 and L2 speakers, indicating that neither group required extra time to process prominent words beyond the time provided by contrastive pitch accents.
Our primary measure of interest was in participants’ responses to the memory test. One challenge in interpreting these responses is that the correct answer varied across conditions: “true” for the correct probes, but “false” for the contrast and unmentioned probes. Thus, differences across conditions in the rate of correct responses may be driven in part by an overall bias to respond “true” or “false.”
Signal-detection analyses (Macmillan & Creelman, Reference Macmillan and Creelman2005) have recently been suggested as a solution to this problem in language processing (Huang & Ferreira, Reference Huang and Ferreira2020). These analyses have long been used in the study of visual psychophysics (Green & Swets, Reference Green and Swets1966) and—relevant to our present investigation—long-term memory (Banks, Reference Banks1970). (See Murayama et al., Reference Murayama, Sakaki, Yan and Smith2014, and Wright et al., Reference Wright, Horry and Skagerberg2008, for applications to multilevel models using the log odds ratio; see also Fraundorf et al., Reference Fraundorf, Benjamin and Watson2013; Fraundorf et al., Reference Fraundorf, Watson and Benjamin2010; James et al., Reference James, Fraundorf, Lee and Watson2018; Lee & Fraundorf, Reference Lee and Fraundorf2017, Reference Lee and Fraundorf2019; Tokowicz & MacWhinney, Reference Tokowicz and MacWhinney2005 for applications to language processing.) In a detection-theoretic analysis, the dependent variable is not the rate of accuracy but the type of response given; that is, did a particular participant judge a particular probe as being “true” (or “false”)? The response given can then be examined as a function of conceptually and empirically dissociable influences: (a) a participant’s response bias to respond “true” or “false” (the overall rate of “true” responses) and (b) their sensitivity to whether individual probes are true or false (responding “true” more when the probe is in fact true).
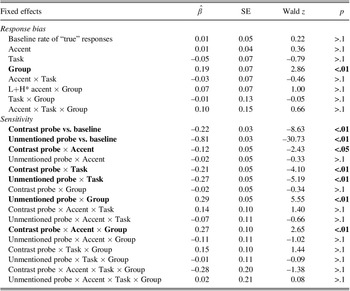
To examine whether reduced time pressure helped L2 learners process and represent contrastive pitch accents in a nativelike manner, we directly compared the native speakers and L2 learners tested on the self-paced listening task here to participants previously tested on the experimenter-paced listening task (Fraundorf et al., Reference Fraundorf, Watson and Benjamin2010; Lee & Fraundorf, Reference Lee and Fraundorf2017).Footnote 3 To this end, we first fit a mixed logit model (Jaeger, Reference Jaeger2008) with an intercept term, probe type (correct vs. contrast vs. unmentioned), accent type (H* vs. L+H*), task (experimenter-paced listening vs. self-paced listening), group (L1 vs. L2), and their interactions as fixed effects. In this model, the intercept term captures response bias; that is, the overall rate of responding “true.” Sensitivity to whether a probe statement is veridically true is captured by including the probe type as an independent variable. That is, by combining all three probe types into a single model, we can test whether people respond “true” more for the probe types that indeed represent true statements. Specifically, the probe type variable was effect-coded for two planned comparisons. In one comparison, the rate of “true” responses to contrast probes was compared to the grand mean of “true” responses. In the other comparison, the rate of “true” responses to unmentioned probes was compared to the grand mean of “true” responses. The other variables (accent type, task, and group) serve as influences on sensitivity when they interact with probe and as influences on response bias when they do not; these variables were coded using mean-centered contrast coding.
This and the following models all had by-participant and by-item random intercepts as random effects. Random slopes were added to the random effects structure only when the model fit improved (p’s> .05).
Table 3 displays the results of this model. We first consider the effects on response bias—that is, those independent of whether the presented probe was true or false. As displayed in Table 3, there was no overall bias to respond either “true” or “false” (z = 0.22, p > .1). There was a main effect of group (z = 2.86, p < .01), indicating that L2 speakers provided more “true” responses than native speakers overall (L1: 48%, L2: 52%). This effect was driven primarily by the fact that L2 speakers were more likely to incorrectly judge unmentioned probes as being “true” than native speakers, as revealed by a significant unmentioned probe by group interaction (z = 5.55, p < .01). There were no main effects of accent type or task (experimenter-paced listening vs. self-paced listening) on the rate of “true” responses.
Fixed effect estimates for the model of “true” responses (N = 15,451) for both L1 and L2 speakers. Significant effects are in bold.

Note: SE = standard error.
Next, we turn to participants’ ability to discern whether particular probes were true or false. Collapsed over groups (L1 vs. L2) and tasks, the two kinds of incorrect probes led to fewer “true” responses compared to the overall rate of “true” responses (contrast: z = –8.63, p < .01; unmentioned: z = –30.73, p < .01). This veridical memory for the discourse was significantly better in the self-paced listening task than in the experimenter-paced listening task. This was confirmed by significant interactions between probe type and task (contrast: z = –4.10, p < .01; unmentioned: z = –5.19, p < .01). The absence of significant three-way interactions among probe type, task, and group indicates that this task difference did not vary significantly across L1 and L2 groups. However, there was a significant three-way interaction among contrast probe, accent type, and group (z = 2.65, p < .01), indicating that, averaging across the experimenter-paced and self-paced listening tasks, the effect of contrastive pitch accents on rejections of contrast probes varied between L1 and L2 listeners.
The four-way interaction among probe type, accent type, task, and group was not significant. This suggests that L2 speakers’ processing and representation of contrastive pitch accents were not nativelike even in a temporally less demanding task.
Nevertheless, to better understand the contrast probe × accent × group interaction, we analyzed the data separately for native speakers and L2 speakers.
NATIVE ENGLISH SPEAKERS
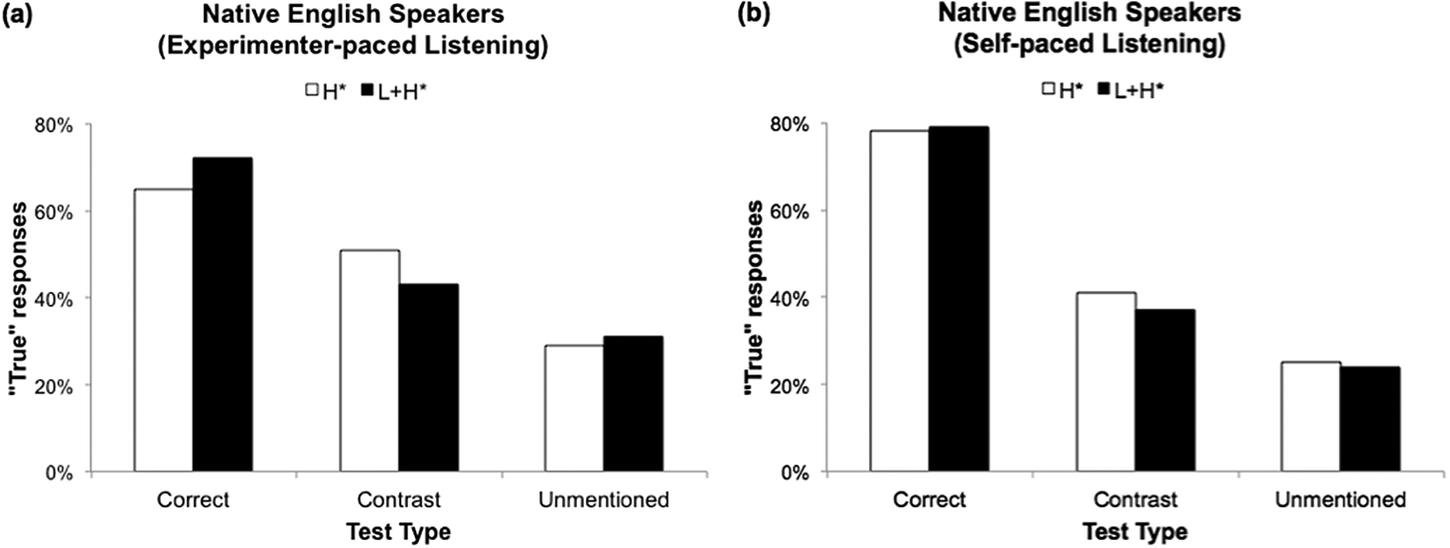
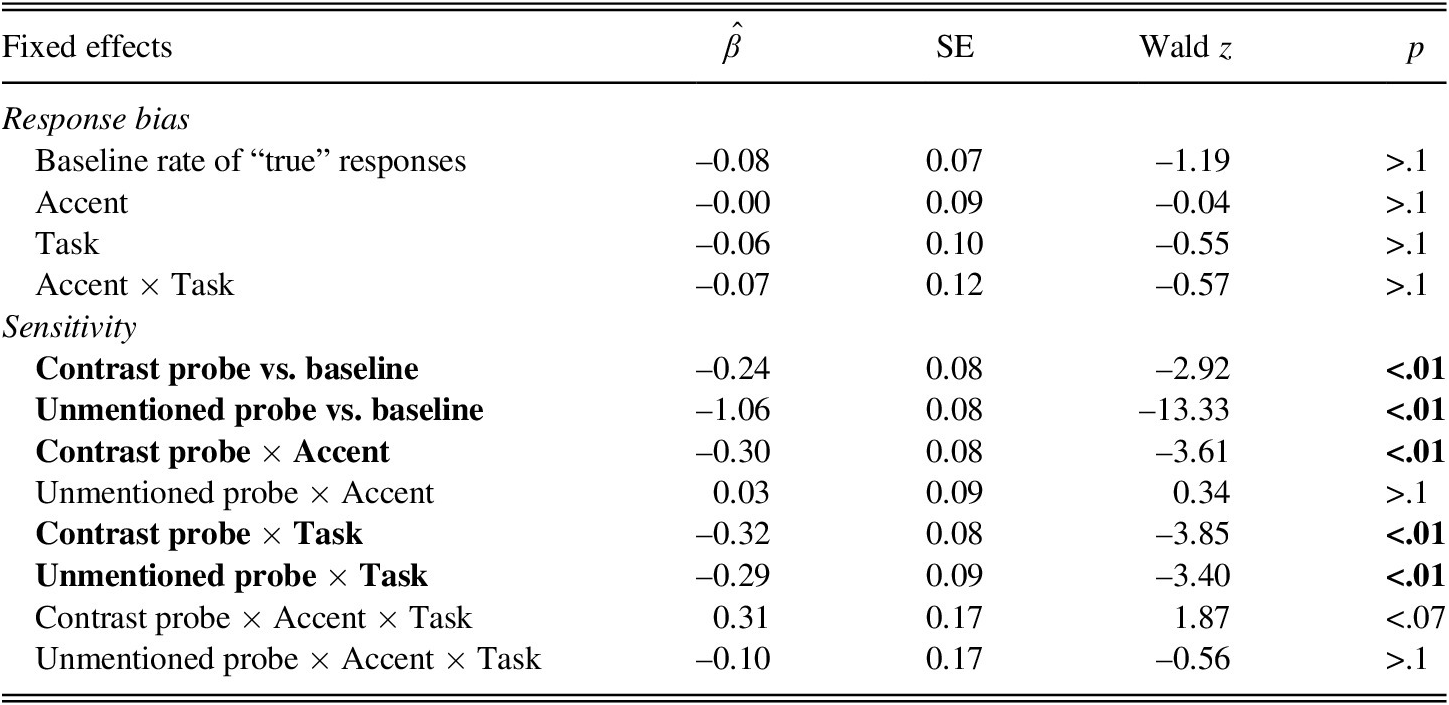
Figures 2a and 2b present mean percentages of “true” responses as a function of probe type and accent type, for native speakers who performed the experimenter-paced listening task (Fraundorf et al., Reference Fraundorf, Watson and Benjamin2010) and the self-paced listening task (our present data), respectively. The final model for native speakers’ data had probe type, accent type, task (experimenter-paced listening vs. self-paced listening), and their interactions as fixed effects, and by-participant and by-item random intercepts and by-item random slopes for probe type as random effects (Table 4).
Mean percentage of “true” responses as a function of probe type and accent type for native English speakers. (a) Experimenter-paced listening task (Fraundorf et al., Reference Fraundorf, Watson and Benjamin2010) and (b) self-paced listening task. Responding “true” is a hit to a correct probe and a false alarm to a contrast or unmentioned probe.

Fixed effect estimates for the model of “true” responses (N = 6,560) for native English speakers. Significant effects are in bold.

Note: SE = standard error.
As illustrated in Figure 1, native English speakers were less likely to respond “true” to the two types of incorrect probes compared to the overall rate of “true” responses (contrast: z = –2.92, p < .01; unmentioned: z = –13.33, p < .01). Their memory for the content of the discourse was more accurate in the self-paced listening task than in the experimenter-paced listening task, as revealed by significant interactions between probe types and task (contrast: z = –3.85, p < .01; unmentioned: z = –3.40, p < .01). Collapsed over the tasks, contrastive (L + H*) pitch accents benefited native speakers’ memory over and above noncontrastive (H*) pitch accents by facilitating rejections of statements about the contrastive alternative (z = –3.61, p < .01). Crucially, this mnemonic effect of contrastive pitch accents did not significantly vary across tasks, as revealed by an absence of a reliable three-way interaction among probe type, accent type, and task (z = 1.87, p < .07). Contrastive pitch accents had no effects on rejections of statements about the unmentioned item.
KOREAN-SPEAKING LEARNERS OF L2 ENGLISH
In our initial analysis, we did not find the significant four-way interaction among probe type, accent type, task, and group that would have suggested L2 speakers’ processing and representation of contrastive pitch accents could become more nativelike in a temporally less demanding task. However, one possibility is that such an effect might emerge specifically for higher proficiency learners.
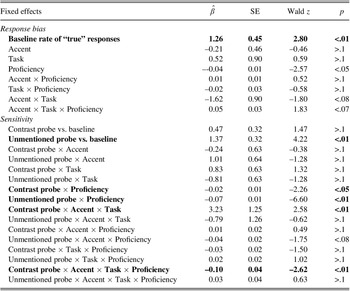
Thus, we examined whether higher proficiency L2 speakers’ memory was affected by task demands differently from that of lower proficiency L2 speakers by including cloze test scores as a predictor variable in the model for L2 speakers. Proficiency was treated as a continuous variable in this model by using mean-centered cloze test scores; including the full range of scores rather than a categorical classification provides greater statistical power by using all of the information present in the data (Cohen, Reference Cohen1983). Thus, the final model for L2 speakers included probe type, accent type, task (experimenter-paced listening vs. self-paced listening), proficiency (cloze test scores), and their interactions as fixed effects (Table 5). The model also had by-participant and by-item random intercepts and by-item random slopes for probe type and accent type.
Fixed effect estimates for the model of “true” responses (N = 8,891) for all L2 speakers. Significant effects are in bold.

Note: SE = standard error.
There was an overall bias to respond “true” (z = 2.80, p < .01) averaging across all L2 speakers. Collapsed over all L2 speakers, there were significantly fewer “true” responses to the unmentioned probes compared to the overall rate of “true” responses (z = 4.22, p < .01), indicating that even L2 speakers could successfully reject items never part of the original discourse. However, while “true” responses to the contrast probes were numerically fewer compared to the grand mean of “true” responses, this difference was not significant (z = 1.47, p > .1), indicating that L2 learners—as a whole—struggled to rule out the salient alternatives. L2 speakers’ ability to correctly reject the two types of incorrect probes was modulated by L2 proficiency (correct: z = –2.26, p < .05, unmentioned: z = –6.60, p < .01), indicating that higher proficiency L2 participants had better memory for the discourse.
Of greatest interest were the effects of contrastive pitch accents and the presentation format. Averaging across all L2 speakers, there were no main effects of accent type nor task. However, the four-way interaction among contrast probe, accent type, task, and proficiency was significant (z = –2.62, p < .01).
DECOMPOSITION OF THE PROFICIENCY EFFECTS
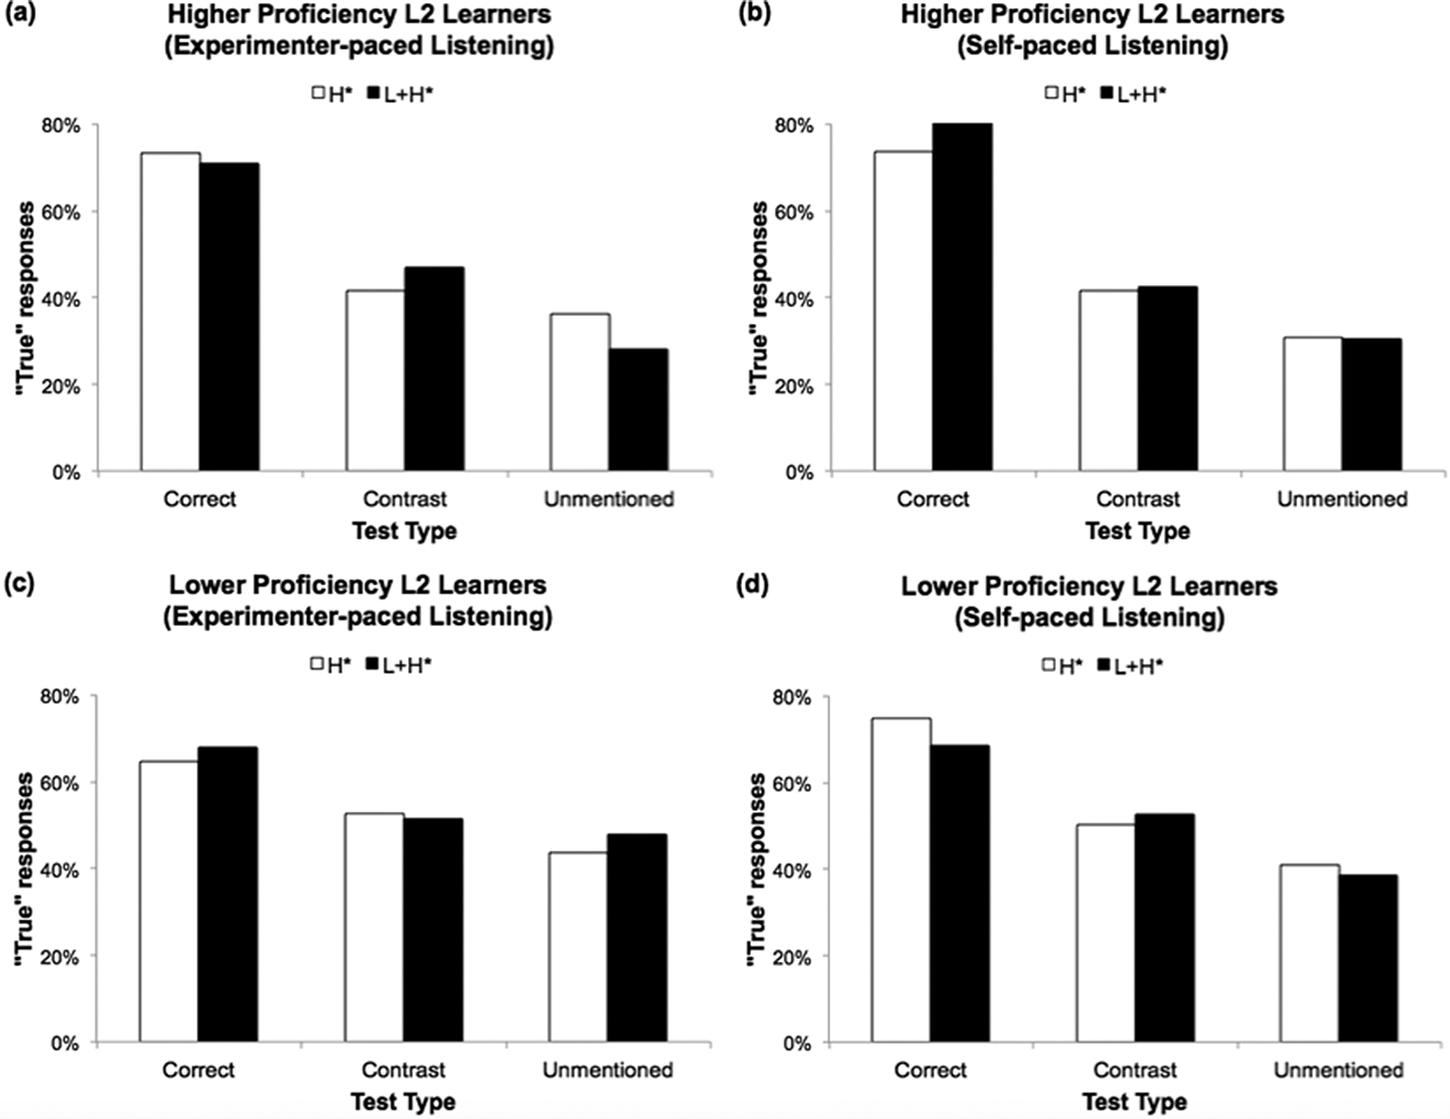
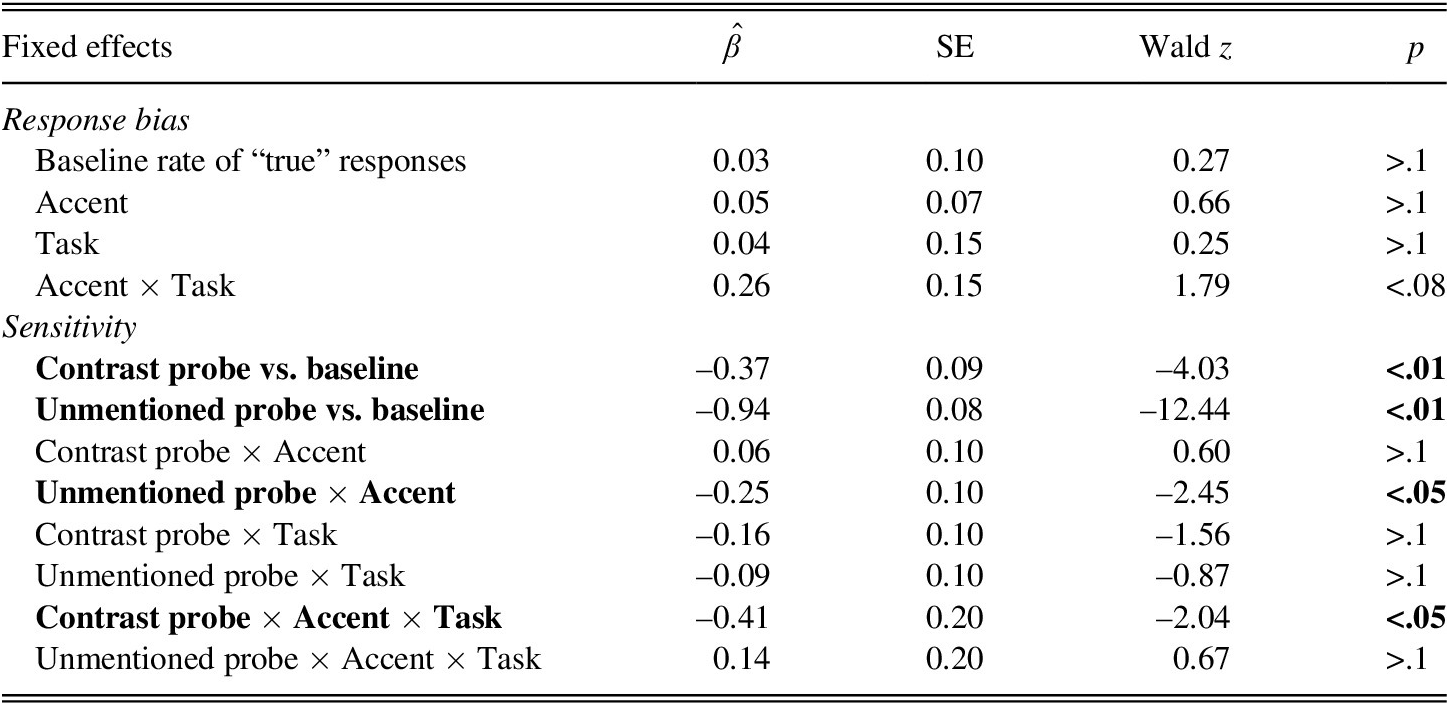
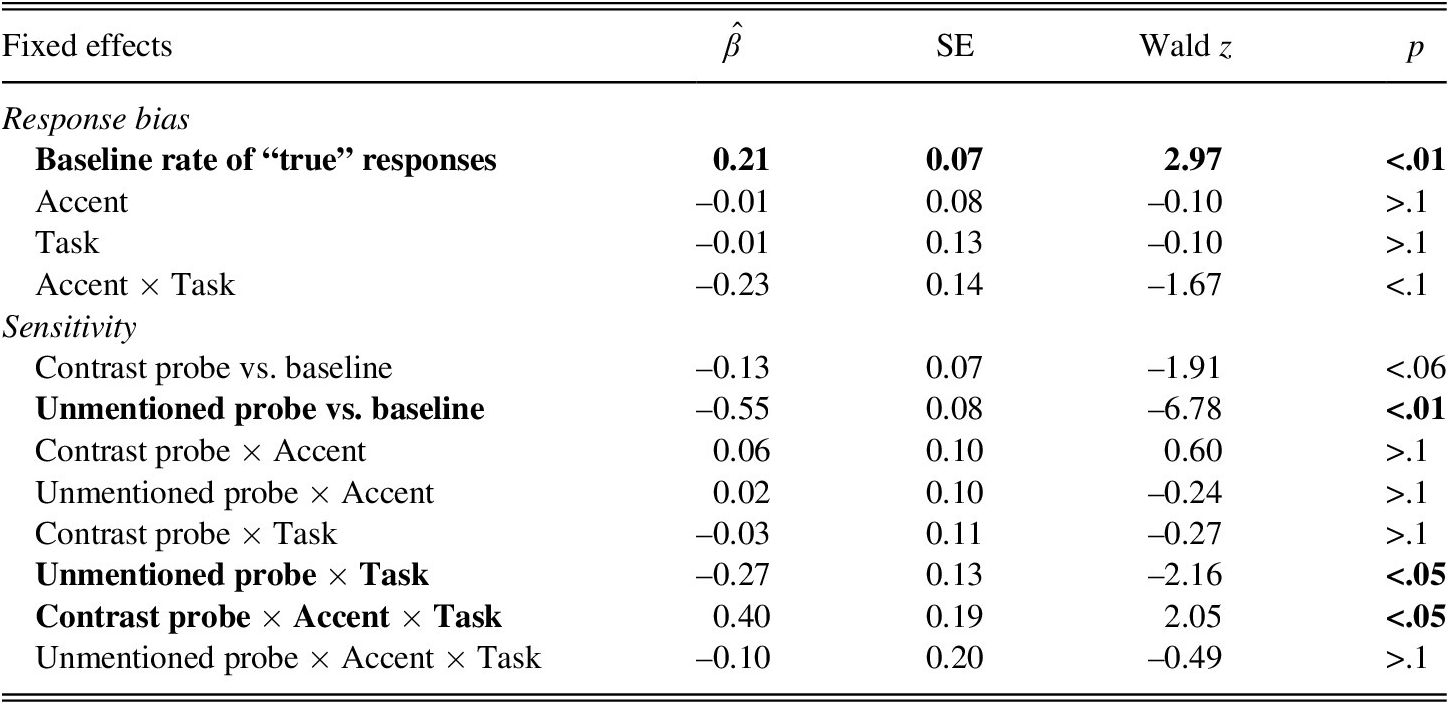
To further investigate the proficiency effects, the L2 data were analyzed separately for the higher proficiency group and the lower proficiency group. Figure 3 displays mean percentages of “true” responses as a function of probe type and accent type, for the higher proficiency L2 speaker group (panel [a] and [b]) and the lower proficiency L2 speaker group (panel [c] and [d]), in the experimenter-paced listening task (Lee & Fraundorf, Reference Lee and Fraundorf2017, [a] and [c]) and the self-paced listening task ([b] and [d]). Tables 6 and 7 present parameter estimates for the model with probe type, accent type, and task as fixed effects for the higher proficiency group and the lower proficiency group, respectively. Both models had by-participant and by-item random intercepts and by-item random slopes for probe type and accent type as random effects.
Mean percentage of “true” responses as a function of probe type and accent type for the higher proficiency L2 speaker group and the lower proficiency L2 speaker group; (a) and (c) experimenter-paced listening task (Lee & Fraundorf, Reference Lee and Fraundorf2017), and (b) and (d) self-paced listening task. Responding “true” is a hit to a correct probe and a false alarm to a contrast or unmentioned probe.

Fixed effect estimates for the model of “true” responses (N = 4,622) for higher proficiency L2 speakers. Significant effects are in bold.

Note: SE = standard error.
Fixed effect estimates for the model of “true” responses (N = 4,269) for lower proficiency L2 speakers. Significant effects are in bold.

Note: SE = standard error.
Higher proficiency L2 speakers did not show an overall bias to respond either “true” or “false” (Table 6, z = 0.27, p > .1). Among just the higher proficiency group, there was no main effect of task or interactions with it. Averaging across tasks, higher proficiency L2 speakers were less apt to affirm both types of incorrect probes compared to their overall rate of “true” response (contrast: z = –4.03, p < .05, unmentioned: z = –12.44, p < .05), indicating veridical memory for the discourse. Averaging across tasks, higher proficiency learners showed a significant effect of accent type on rejections of unmentioned probes (z = –2.45, p < .05): The contrastive pitch accent helped the higher proficiency group to correctly reject unmentioned probes over and above the noncontrastive pitch accent. This suggests that higher proficiency L2 speakers were able to differentiate between the two types of pitch accent. However, there was no mnemonic effect of contrastive pitch accents on rejections of the salient alternative (z = 0.67, p > .1), indicating that the way higher proficiency L2 speakers represent contrastive pitch accents differed from the way native speakers do. Crucially, the absence of a significant three-way interaction among unmentioned probe, accent type, and task indicates that extra processing time provided by the self-paced listening task did not lead higher proficiency L2 speakers to reach nativelike processing and representation of contrastive pitch accents.
Unlike the higher proficiency L2 speaker group, lower proficiency L2 speakers (Table 7) had an overall bias to respond “true” (z = 2.97, p > .1). They also showed limited memory for the content of the discourse, failing to reliably reject statements about the contrast item (z = –1.91, p < .06). Nevertheless, lower proficiency L2 speakers provided significantly fewer “true” responses to the unmentioned probes compared to the overall rate of “true” responses, suggesting that they remembered the content of the discourse to some extent. This ability was modulated by task (z = –2.16, p < .05), suggesting better memory in the self-paced listening task than in the experimenter-paced listening task; note, however, that the absence of a three-way interaction of probe type × task × proficiency in the model of all L2 speakers (Table 5) suggests only weak evidence that proficiency affected whether task type modulated L2 learners’ memory for different probe types.
Lower proficiency L2 speakers did not reveal any effects of accent type on rejections of unmentioned probes, but they showed a significant contrast probe × accent type × task interaction (z = 2.05, p < .05). To explore this three-way interaction, we fit a separate two-way (probe type × accent type) model to each task. The results revealed that the interaction between contrast probe and accent type was not significant in either task (experimenter-paced listening: z = –1.32, p > .1, self-paced listening: z = 1.69, p < .1). The interaction seems to be driven by the fact that in the self-paced listening task, the rate of false alarms to the contrast probes was numerically higher when the target word was originally produced with a contrastive pitch accent than when it was produced with a noncontrastive pitch accent, which was the reverse of the pattern observed for native speakers.
In sum, the data for the lower proficiency group suggest that reduced time pressure in the self-paced listening task improved memory for the discourse to some extent. But, there was no evidence that lower proficiency L2 speakers were sensitive to contrastive pitch accents in a similar way either to native speakers or to higher proficiency L2 speakers.
DISCUSSION
Using a self-paced listening task, we explored what gives rise to L1-L2 differences in encoding and representing a salient alternative in response to contrastive pitch accents. In particular, we tested whether allowing participants sufficient time to process spoken discourse, using self-paced listening, might lead to more nativelike patterns of discourse comprehension. We directly compared memory performance on the self-paced listening task to earlier studies using an experimenter-paced listening task (Fraundorf et al., Reference Fraundorf, Watson and Benjamin2010; Lee & Fraundorf, Reference Lee and Fraundorf2017), which did not necessarily give participants as much time as desired to process the discourse.
For native English speakers, contrastive pitch accents benefited memory by facilitating rejections of statements about the contrastive alternative, just as in the experimenter-paced listening task. Note that the L1, experimenter-paced listening task had a different retention interval than the other tasks. This difference is indeed a confound and may account for the fact that native speakers showed better overall memory performance in the self-paced listening task than in the experimenter-paced listening task. However, the question of interest here was not whether and how task type affects overall memory performance. The current study focuses instead on whether task type modulates how contrastive pitch accents, in particular, affect later memory for discourse. Previous L1 studies showed that the difference in retention interval had no impact on the contrastive-accent effect in L1 processing. While Experiment 3 of Fraundorf et al. (Reference Fraundorf, Watson and Benjamin2010), in which our L1 data for the experimenter-paced listening task originated, tested native speakers’ recognition memory with a 24-hour lag between study and test, other L1 studies looking at mnemonic effects of prominence cues on memory for discourse (Fraundorf et al., Reference Fraundorf, Watson and Benjamin2010, Reference Fraundorf, Watson and Benjamin2012, 2013) had the test phase immediately after the study phase just as in our self-paced listening task. Despite this difference in the length of retention interval, the effects of contrastive pitch accents on salient alternatives were replicated across studies. Crucially, the current data revealed that native speakers derived the same benefits from contrastive pitch accents across tasks. The fact that we replicated the previous finding using a self-paced listening task suggests that the task used here was sensitive enough to capture the comprehenders’ sensitivity to contrastive pitch accents.
But, even in the self-paced listening task, L2 listeners did not show a nativelike behavior. For higher proficiency L2 learners, we found a mnemonic benefit of contrastive pitch accents: The content of the discourse was better recalled when the critical word had been produced with a contrastive pitch accent than when it had not. However, higher proficiency L2 leaners differed from native speakers in how contrastive pitch accents affected later memory for discourse. Just as in the experimenter-paced listening task, contrastive pitch accents helped rejections of statements only about the unmentioned item, and not about the contrast item. This result indicates that higher proficiency L2 learners brought to mind the contrast between the critical word and its salient alternative in response to contrastive pitch accents, but they failed to distinguish the contrastive alternative from the correct item in their memory representation of the discourse. For lower proficiency L2 learners, reduced time pressure had an effect of improving overall memory for discourse, but this effect was not modulated by pitch accent type.
In sum, the data show that—contrary to the processing-demand hypothesis—the contrastive pitch accents failed to lead even higher proficiency L2 learners to process and represent the discourse in a nativelike way even in situations in which they were allowed to process the discourse under no time constraint. The fact that having more time for the task did not lead to a nativelike behavior suggests that L2 learners’ nonnativelike encoding and representation of contrastive pitch accents are not attributable solely to online-processing demands.
UNDERSTANDING PROMINENCE IN L2 ENGLISH
As discussed in the preceding text, contrastive pitch accents helped higher proficiency L2 learners later rule out the unmentioned entity. This suggests that higher proficiency L2 learners were not insensitive to contrastive pitch accents. They were able to derive a contrastive interpretation to some extent. Nevertheless, a nonnativelike behavior resulted from the failure to fully integrate the salient alternative into their discourse representation.
One might argue that L2 learners could have difficulty representing the contrastive alternative in a nativelike way because they did not have strong lexical representations for the words in contrast sets. However, there are reasons to think that the strength of the representation of the referents alone is not sufficient to account for the absence of a nativelike effect of contrastive pitch accents. First, we looked up the word frequency of the two words in each of 65 out of 72 pairs of alternatives.Footnote 4 The mean log frequencies of the two members (SUBTLEXUS corpus; Brysbaert and New, Reference Brysbaert and New2009) of the contrast sets were similar (first contrast set: 2.8 vs. 2.8; second contrast set: 2.9 vs. 3.0). This suggests that, at least, there is no a priori reason for participants to be more familiar with the correct target than the salient alternative. Second, Lee and Fraundorf (Reference Lee and Fraundorf2019) used similar critical words to those used in the present study, and found that L2 learners represented a written discourse in response to font emphasis in the same way as native speakers did. Third, the current results demonstrated that higher proficiency L2 participants had some degree of veridical memory for the discourse: both types of incorrect probes were less likely to be judged as being true compared to their overall rate of “true” response. This suggests that higher proficiency L2 participants did not have much difficulty understanding the literal text. Finally, the contrastive pitch accent helped higher proficiency L2 learners reject only the statements about an unmentioned item. This indicates that they did distinguish the contrastive alternatives from other items that were not part of the contrast set, suggesting that higher proficiency L2 learners had indeed brought the contrast set to the mind. Rather, this result suggests that they failed to reject the contrastive alternative because of the failure to encode which of the two items in the contrast set was the contrastive alternative.
THE COMPLEX-MAPPING HYPOTHESIS
The current result stands in contrast to previous findings (Lee & Fraundorf, Reference Lee and Fraundorf2019) that L2 learners showed nativelike use of font emphasis to encode and represent a discourse in memory. This suggests that the nonnativelike behavior tied specifically to contrastive pitch accents is not due simply to L2 learners’ difficulty of mapping prominence cues onto the structure of L2 discourse. Integrating multiple sources of information is not always challenging for L2 learners. What is particularly challenging for L2 learners seems to be learning the exact function of a specific type of prominence cue, that is, the contrastive pitch accent, or at least using it to make inferences about salient alternatives.
The discrepancy in results between previous work (Lee & Fraundorf, Reference Lee and Fraundorf2019) and the current study lends support to the complex-mapping hypothesis by implying that L2 learners’ nativelike discourse processing depends on the complexity of the form-function mapping of prominence cues. In Lee and Fraundorf (Reference Lee and Fraundorf2019), L2 learners showed nativelike processing of font emphasis, which could be acquired relatively easily as a typeface convention. By comparison, in the present study, the form-function mapping of contrastive pitch accents is more complicated because it is language-specific, and pitch movements may signal functions other than marking information structure. Thus, the finding that contrastive pitch accents failed to lead L2 learners to distinguish what was the correct item from what was the salient alternative—even when online-processing demands were reduced—suggests that contrastive pitch accents are inherently difficult to learn to process as a cue for L2 learners, presumably because of their complex form-function mapping.
What about the past offline tasks that did show nativelike processing of contrastive pitch accents? We note that these tasks not only lacked time pressure, but they were also accompanied by visual contexts. The presence of visual contexts could lead L2 learners to process contrastive pitch accents in a nativelike way by helping them make inferences about the information structure as well as reducing memory load (e.g., Takahashi et al., Reference Takahashi, Kao, Baek, Yeung, Hwang and Broselow2018; Takeda, Reference Takeda2018). In other words, visual contexts likely helped L2 participants compute the pragmatic function of contrastive pitch accents. By contrast, previous online tasks that failed to show a nativelike performance either provided no visual context or used a visual context that required a complex computation (e.g., Akker & Cutler, Reference Akker and Cutler2003; Lee et al., Reference Lee, Perdomo and Kaan2020; Nakamura et al., Reference Nakamura, Arai, Hirose and Flynn2020). For example, Nakamura et al. (Reference Nakamura, Arai, Hirose and Flynn2020) found that Japanese-speaking L2 learners of English failed to interpret L+H* contrastive pitch accents in online reference resolution as a cue to contrast as native English speakers do. The task required participants to interpret L+H* contrastive pitch accents in a context-dependent way: as a cue to contrast only in a two-referent context and not in a one-referent context. L2 learners’ nonnativelike behavior in this particular study may be attributed at least in part to the demands of integrating visual and prosodic information, which made it difficult for them to derive an appropriate interpretation from contrastive pitch accents, rather than to a deficit in prosodic processing per se. Thus, the difference in ease of computing a form-function mapping of contrastive pitch accents could underlie the seemingly conflicting findings between prior online and offline studies.
A FUNDAMENTAL REPRESENTATIONAL DEFICIT?
The present study demonstrates that nonnativelike encoding and representation of contrastive pitch accents can lead to L1-L2 differences in spoken discourse comprehension. The data show that L2 learners fail to reach a nativelike level in integrating the salient alternative into their discourse representation in response to contrastive pitch accents even in less temporally demanding situations. However, it is still not clear whether the L1-L2 difference reported here reflects a fundamental representational deficit. Evidence against a fundamental difference comes from studies showing that L2 learners’ performance varies by task demands or L2 proficiency level or that native speakers’ performance becomes nonnativelike as a function of increased cognitive demands (Frenck-Mestre, Reference Frenck-Mestre, Heredia and Altarriba2002; Hopp, Reference Hopp2006, Reference Hopp2009, Reference Hopp2010; Jackson, Reference Jackson2008; Jackson & Bobb, Reference Jackson and Bobb2009; Jackson & Dussias, Reference Jackson and Dussias2009; Kilborn, Reference Kilborn and Harris1992; McDonald, Reference McDonald2006). Another piece of evidence comes from studies focusing on L2 learners with extensive naturalistic L2 exposure (Pliatsikas & Marinis, Reference Pliatsikas and Marinis2013). The shallow structure hypothesis argues that filler-gap processing requires a complex computation of syntax and, thus, it is one of the domains for which a fundamental L1-L2 difference might exist (Clahsen & Felser, Reference Clahsen and Felser2006). Nevertheless, Pliatsikas and Marinis demonstrated that L2 learners with extensive naturalistic L2 exposure showed a filler-gap effect similar to that observed for native English speakers while those with limited naturalistic exposure did not, indicating that the input provided through naturalistic exposure made it possible for L2 learners to construct a detailed syntactic representation that included empty categories just as native speakers did.
In the current study, we only tested L2 learners who had no or limited naturalistic L2 exposure. Forty-four out of 65 L2 learners who participated in the study had never lived in an L2 environment. For the remaining 21 participants, only four had an experience of staying in an English-speaking country for longer than 6 months. Given that the form-function mapping of contrastive pitch accents is not explicitly taught in L2-English classroom and that it may be only acquired through extensive exposure to L2 input, only sufficient amount of naturalistic exposure may provide the input sufficient for fully learning native-like encoding and representation of contrastive pitch accents.
Thus, although we have evidence that there is an L1-L2 difference in response to contrastive pitch accents, we cannot conclude whether this representational deficit is a fundamental one or a quantitative one that could be alleviated with further experience. That question could only be answered in future research that tests L2 learners with extensive naturalistic exposure—more than any of our present participants—and determines whether their performance converges with that of native speakers.
CONCLUSION
Our results demonstrate that higher proficiency Korean-speaking L2 learners of English show some sensitivity to contrastive pitch accents during spoken discourse comprehension, but still fail to fully integrate into memory which was the salient alternative even when online-processing demands are reduced. This finding, combined with previous evidence for nativelike comprehension of font emphasis (Lee & Fraundorf, Reference Lee and Fraundorf2019), suggests that what might underlie nonnativelike processing of contrastive pitch accents is L2 learners’ failure to fully acquire the difficult mapping between pitch accent and information status rather than the lack of the online-processing capability to encode and represent the salient alternative in response to prominence cues. More generally, this work supports the complex-mapping hypothesis (Patterson et al., Reference Patterson, Esaulova and Felser2017; Schafer et al., Reference Schafer, Takeda, Rohde and Grüter2015) that L2 leaners’ ability to acquire and use cues to L2 discourse processing depends in part on the complexity of the required form-meaning mapping.
Competing Interest
The author(s) declare none.