Implications
The Rusitec system maintained the main microbial groups in the rumen, but bacterial diversity increased over the incubation period and microbial abundance differed markedly from that in the rumen inoculum, indicating that information on microbial populations developed in fermenters cannot be directly transposed to in vivo conditions. Both the use of 15N as a microbial marker and the quantification of total microbial DNA detected greater microbial growth in fermenters fed a medium-concentrate diet (MC) than in those fed a high-concentrate diet (HC), suggesting that determining total microbial DNA can be appropriate to assess microbial growth in Rusitec fermenters.
Introduction
Two of the most commonly used in vitro systems to study ruminal fermentation are the continuous-culture fermenters and the semi-continuous flow Rusitec system. Both of them are run over periods of several days and quantitative and qualitative changes in the microbial populations through the incubation period are therefore likely to occur. Several studies have monitored the shifts in microbial populations in continuous-culture fermenters (Soto et al., Reference Soto, Molina-Alcaide, Khelil and Yáñez-Ruiz2012 and Reference Soto, Yáñez-Ruiz, Cantalapiedra-Hijar, Vivas and Molina-Alcaide2013; Martínez-Fernández et al., Reference Martínez-Fernández, Abecia, Martin-Garcia, Ramos-Morales, Denman, Newbold, Molina-Alcaide and Yáñez-Ruiz2015), but to our knowledge there is only a recent study on this topic in Rusitec fermenters (Lengowski et al., Reference Lengowski, Zuber, Witzig, Möhring, Boguhn and Rodehutscord2016). Lengowski et al. (Reference Lengowski, Zuber, Witzig, Möhring, Boguhn and Rodehutscord2016) analyzed the changes in microbial populations over the first 48 h of incubation and on day 13, and reported important changes, recommending that the adaptation phase should last longer than 48 h. However, there is little information on the microbial changes occurring between the day 2 and the end of the incubation, and most is limited to protozoal populations (Martínez et al., Reference Martínez, Ranilla, Tejido, Ramos and Carro2010a and Reference Martínez, Ranilla, Ramos, Tejido and Carro2011a). Lengowski et al. (Reference Lengowski, Zuber, Witzig, Möhring, Boguhn and Rodehutscord2016) reported the effects of forage source (grass v. corn silage) on microbial numbers, but the influence of other dietary factors, such as concentrate level on specific microbial populations has hardly been investigated (Martínez et al., Reference Martínez, Ranilla, Tejido, Ramos and Carro2010a). Therefore, the first objective of this study was to assess the shifts in microbial populations (bacteria, protozoa, fungi and methanogenic archaea) and fermentation characteristics on days 0, 3, 8 and 14 in Rusitec fermenters fed two contrasting diets, as well as to investigate the relationships between microbial populations and fermentation characteristics. These sampling days were selected because Rusitec trials have commonly an 8-day adaptation period followed by a 4- to 6-day sampling period. Sampling on day 3 was chosen because previous studies have evidenced a dramatic change in fermentation parameters (Martinez et al., Reference Martínez, Ranilla, Ramos, Tejido and Carro2011b) and microbial populations (Lengowski et al., Reference Lengowski, Zuber, Witzig, Möhring, Boguhn and Rodehutscord2016) over the 2 first incubation days in Rusitec fermenters. A second objective of this study was to compare values of microbial growth determined using 15N as an external marker with concentrations of microbial DNA in the fermenters to assess if both procedures detected similar differences between diets. Belanche et al. (Reference Belanche, de la Fuente, Yañez-Ruiz, Newbold, Calleja and Balcells2011) used purine bases and total microbial DNA to estimate microbial protein synthesis in lambs and concluded that both methods gave similar results, but microbial DNA showed a greater specificity, allowing the origin of the microbial population in digesta to be distinguished (bacterial v. protozoa). To our best knowledge this approach has not been tested in Rusitec fermenters.
Materials and methods
Animals and diets
In total, six rumen-cannulated Merino sheep (57.4±2.95 kg of BW) were used as ruminal fluid donors for the in vitro incubations in a cross-over experimental design with two periods of 30 days each. Sheep management and rumen content withdrawal were carried out in accordance with the Spanish guidelines for experimental animal protection (Royal Decree 1201/2005 of 10 October on the protection of animals used for experimentation or other scientific purposes), and experimental protocols were approved by the Institutional Animal Care and Use Committee of the University of León.
Diets were formulated to be representative of those fed to dairy animals (MC; 50% alfalfa hay and 50% of a commercial concentrate; as-fed basis) and to fattening ruminants (HC; 15% of barley straw and 85% of a concentrate for fattening lambs). The MC and HC diets had 935 and 942 g organic matter, 186 and 150 g CP, 368 and 252 g NDF and 162 and 95.2 g ADF per kg dry matter (DM), respectively. Procedures for chemical analyses of diets have been described by Martínez et al. (Reference Martínez, Ranilla, Tejido, Ramos and Carro2010b). Three sheep were fed the MC diet and the other three received the HC diet. Both diets were fed twice daily (0900 and 1800 h) at a daily rate of 52 g DM/kg BW0.75 to minimize feed selection. Sheep were gradually adapted to the corresponding diet for 2 weeks before starting the in vitro incubations.
Rusitec incubations, sampling and chemical analyses
Two identical 14-d incubation runs were carried out using four Rusitec fermenters (500 ml effective volume) in a cross-over design. The general incubation procedure was as described by Martínez et al. (Reference Martínez, Ranilla, Tejido, Ramos and Carro2010c), and forage and concentrate were fed once daily into separate nylon bags to supply 30 g of DM. Ruminal contents from each sheep were collected immediately before the morning feeding and transferred to fermenters within 30 min of collection. Each fermenter was inoculated with 250 ml of strained rumen fluid, 200 ml of artificial saliva and 80 g of solid rumen contents supplied into a nylon bag. In addition, two feed bags (one with forage and one with concentrate) were incubated in each fermenter. Samples of solid ruminal contents (25 g) and of the mixture of rumen fluid and artificial saliva (20 ml) were taken in sterile containers and stored at −80°C until DNA extraction. After 24 h, each fermenter was opened, the bags containing rumen digesta solids and concentrate were removed and washed twice with 40 ml of fermenter liquid, and two new bags (one with forage and one with concentrate) were supplied. On subsequent days, two bags (one with forage and one with concentrate, which had been in the fermenter for 48 and 24 h, respectively) were collected from each fermenter and two new feed bags were supplied. Artificial saliva was continuously infused at a rate of 740 ml/day (dilution rate of 5.14%/h).
On days 3, 8 and 14 of incubation, the pH of the fluid of each fermenter was determined immediately before feeding and the following samples were collected: 3 ml of fluid from each fermenter were taken into a sterile container and immediately frozen at −80°C for DNA extraction and 3 ml were frozen (−80°C) for determination of amylase and xylanase activities as described by Giraldo et al. (Reference Giraldo, Ranilla, Tejido and Carro2007); 5 ml of effluent were added to 3 ml of deproteinizing solution (10% of metaphosphoric acid and 0.06% crotonic acid; wt/vol) for volatile fatty acid (VFA) determination, and 5 ml of effluent were stored at −20°C for ammonia-N and total lactate determinations following the procedures described in Martínez et al. (Reference Martínez, Ranilla, Tejido, Ramos and Carro2010a). The content of the two nylon bags collected from each fermenter was weighed, mixed, about 5 g were frozen at −80°C for DNA extraction, and 10 g were dried at 105°C in a forced-air oven for determination of DM content. Finally, the gas produced was collected and analyzed for CH4 concentration by gas chromatography as described by Martínez et al. (Reference Martínez, Ranilla, Tejido, Ramos and Carro2010b). From day 10 to 14, a solution of 15NH4Cl (Sigma-Aldrich Quimica S.L., Madrid, Spain) was added to the artificial saliva (4.0 mg of 15N/g of dietary N) for measuring microbial growth following the procedure described by Martínez et al. (Reference Martínez, Ranilla, Tejido, Ramos and Carro2010c).
Extraction of DNA, quantitative polymerase chain reaction (qPCR) and automated ribosomal intergenic spacer analysis (ARISA)
DNA was isolated in triplicate from the pellet obtained after centrifuging 1 ml of liquid samples (20,000×g, 5 min, 4°C) and from lyophilized solid digesta samples (200 mg DM). The DNA was extracted following the repeated bead-beating plus column procedure described by Yu and Morrison (Reference Yu and Morrison2004), with the exception that an additional step involving the treatment of samples with cetyltrimethylammonium bromide was included to remove PCR inhibitors (Saro et al., Reference Saro, Ranilla and Carro2012). Absorbance ratios (A260 : A280) of eluted DNA were measured in a NanoDrop ND-1000 (NanoDrop Technologies, Wilmington, DE, USA) to assess the purity of DNA. Absorbance ratios were between 1.72 and 2.01 for A260 : A280, and between 1.89 and 2.26 for A260 : A230.
Absolute quantification of total bacteria and protozoa was performed by qPCR using as standard DNA extracted from microbial pellets. Bacterial pellets were isolated from rumen contents of sheep after treating the digesta with a Stomacher (Stomacher 400 Circulator; Seward Ltd, London, UK) as described by Ramos et al. (Reference Ramos, Tejido, Martínez, Ranilla and Carro2009b). Protozoal pellets were obtained after decantation of protozoal fraction as described by Saro et al. (Reference Saro, Ranilla and Carro2012), and the cross contamination of bacterial DNA in the protozoal DNA was measured with qPCR and subtracted from the concentration determined with spectrophotometry. The populations of Fibrobacter succinogenes, Ruminococcus flavefaciens, Ruminococcus albus, fungi and methanogenic archaea were determined by qPCR in relation to the total bacterial population. A full description of the primers used for general bacteria, F. succinogenes, R. flavefaciens and fungi has been given by Denman and McSweeney (Reference Denman and McSweeney2006), and primers used for general protozoa, R. albus and methanogenic archaea have been described by Sylvester et al. (Reference Sylvester, Karnati, Yu, Morrison and Firkins2004), Koike and Kobayashi (Reference Koike and Kobayashi2001) and Denman et al. (Reference Denman, Tomkins and McSweeney2007), respectively. Amplification efficiencies for each primer pair were investigated by examining dilution series (from 10–1 to 10–5) of a pooled DNA template in triplicate and plotting the observed threshold cycle (C t ) values against the logarithm of total DNA concentration. Values of slopes (ranging from −3.35 to −3.71) and regression coefficients (0.99) were similar to those previously reported for the same primers by Denman and McSweeney (Reference Denman and McSweeney2006) for bacteria, fungi, F. succinogenes and R. flavefaciens, by Sylvester et al. (Reference Sylvester, Karnati, Yu, Morrison and Firkins2004) for protozoa, and by Koike and Kobayashi (Reference Koike and Kobayashi2001) for R. albus, and PCR efficiencies ranged from 95.6% to 96.0%. The qPCR was performed in triplicate using an ABI PRISM 7000 Sequence Detection System (Applied Biosystems, Warrington, UK) as previously described (Saro et al., Reference Saro, Ranilla, Cifuentes, Roselló-Mora and Carro2014b). In brief, each PCR reaction mixture (20 µl final volume) contained 10 µl SYBR Green PCR Master Mix (Applied Biosystems), 0.9 µl of 20 µM each primer, 6.2 µl of milli Q water and 2 µl of extracted DNA.
For ARISA analyses, the DNA was amplified using universal bacterial primers 16S-1392F and 23S-125R as described by Saro et al. (Reference Saro, Ranilla and Carro2012). Thermocycling and ARISA technique were conducted in a 2720 Thermal Cycler (Applied Biosystem, Foster City, CA, USA) and a MegaBACE 500 (Amersham Biosciences, Little Chalfont, UK), respectively (Saro et al., Reference Saro, Ranilla and Carro2012). Peaks were identified by comparison with an internal size standard using the GeneMarker Software v1.80 (SoftGenetics, State College, PA, USA) and the presence/absence of the different peaks was considered to compare the electropherograms profiles by using a (dis)similarity matrix. A principal coordinates analysis of the Bray–Curtis dissimilarities between samples was used to visualize differences among groups of samples using the R environment and R package vegan (Oksanen et al., Reference Prevot, Senaud and Prensier2015). The Shannon’s diversity index was calculated to evaluate the diversity of bacterial communities, and dendrograms were constructed using the Pearson’s coefficient and the unweighted pair-group method using arithmetic averages options in the MVSP v3.12d software (Kovach Computing Service, Anglesey, Wales, UK). Finally, the associations among microbial populations and fermentation measurements were investigated by principal component analysis (PCA) using the R environment (2015).
Calculations and statistical analyses
F. succinogenes, R. flavefaciens, R. albus, fungi and methanogenic archaea DNA concentrations were determined relatively to the absolute quantification of total bacteria as
 ${\rm 2}^{{{\minus} {{(C_{t} }} {{\,{\rm target}{\minus}C_{t} \,{\rm total}\,{\rm bacteria})}} $
, where C
t
represents the threshold cycle after correcting for differences in amplification efficiencies between the target and the reference (total bacteria).
Microbial and fermentation data were analyzed independently for each digesta phase as a mixed model with repeated measures using the MIXED procedure of SAS (SAS Institute Inc., Cary, NC, USA). The statistical model used included diet, incubation run, time and diet×time as fixed effects, and fermenter as a random effect. Data on microbial growth were analyzed independently for each method (15N and total DNA) as a mixed model which included diet, digesta phase, incubation run and diet×digesta phase as fixed effects, and fermenter as a random effect. Effects were declared significant at P<0.05, and P<0.10 was considered a trend. Correlations between values of microbial growth determined by using 15N or quantification of total microbial DNA were assessed by Pearson’s correlation analysis using the PROC CORR of SAS.
Results
Microbial populations and bacterial diversity
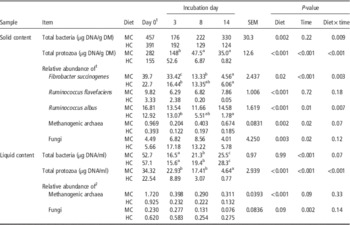
Most of the microbial populations analyzed varied with the incubation time (P<0.05), and diet×time interactions (either significant or a trend) were detected for most variables (Table 1). Concentrations of total protozoal DNA and the relative abundance of fungi decreased with time in both digesta phases (P=0.024 to <0.001), but changes in fungi were significant (P<0.05) only for HC diet. In contrast, bacterial DNA concentrations in liquid (LIQ) and the relative abundance of methanogenic archaea in solid (SOL) increased with incubation time (P<0.001 and 0.021, respectively), although changes in methanogenic archaea were only significant (P<0.05) for MC diet. Total bacterial DNA concentrations and relative abundance of R. flavefaciens remained unchanged (P=0.224 and 0.722, respectively) over the incubation period in SOL.
Evolution through the incubation period of total bacterial DNA, total protozoal DNA and the relative abundance of Ruminococcus flavefaciens, Ruminococcus albus, Fibrobacter succinogenes, methanogenic archaea and fungal DNA in solid and liquid contents of Rusitec fermenters fed diets with medium- (MC) and high-concentrate (HC) content (n=4)

1 Data on samples taken on day 0 (inoculum for the fermenters) were not included in the statistical analysis.
2
Microbial DNA measured relative to total bacterial DNA, calculated as
${\rm 2}^{{{\minus}} {{(C_{t} {{\,{\rm target}{\minus}C_{t} \,{\rm total bacteria})}}}}} {\times}{\rm 10}^{{\rm 2}} $
.
a,b,cWithin each row, means without a common superscript letters differ (P<0.05). Superscript letters are only shown when a significant (P<0.05) P value for both time effect and diet×time interaction were detected.
The incubated diet affected (P<0.05) all determined microbial populations, with the exception of total bacteria (P=0.998) and fungi relative abundance in LIQ, although there was a trend (P=0.086) to lower fungi values with the MC diet. Compared with HC fermenters, the MC fermenters had greater (P<0.05) concentrations of total bacterial and protozoal DNA and relative abundance of the three fibrolytic bacteria and methanogenic archaea in SOL, as well as greater total protozoal DNA and relative abundance of methanogenic archaea in LIQ, but lower (P<0.05) relative abundances of fungi in both digesta phases.
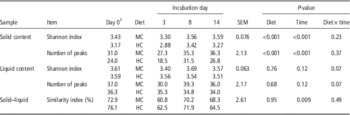
Both the number of peaks and Shannon index in the SOL phase were greater (P<0.001) in MC fermenters compared with HC fermenters (Table 2). No differences (P>0.05) between diets in bacterial diversity were observed in the LIQ phase, although the diet×time interaction tended to be significant for both Shannon index and number of peaks (P=0.069 and 0.071, respectively). Whereas the Shannon index and number of peaks in SOL were greater on days 8 and 14 post-incubation than on day 3, both parameters remained unchanged (P>0.05) in LIQ over the incubation period. For both diets, the similarity index between SOL and LIQ phases increased (P<0.05) from day 3 to day 8, but recovered initial values by the end of the incubation.
Evolution through the incubation period of Shannon index and numbers of peaks detected in the automated ribosomal intergenic spacer analysis (ARISA) electropherograms in solid and liquid contents of Rusitec fermenters fed diets with medium- (MC) and high-concentrate (HC) content, and similarity index of ARISA profiles between solid and liquid contents

1 Data on samples taken on day 0 (inoculum for the fermenters) were not included in the statistical analysis.
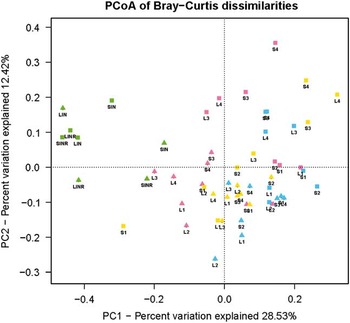
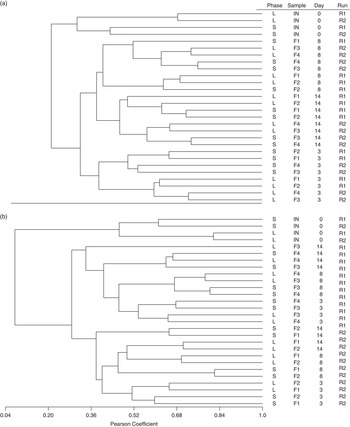
The PCA plot of bacterial community (Figure 1) segregated samples by component 2 into two groups corresponding to diet. In total, 22 out of the 24 samples from the fermenters receiving the MC diet grouped below axis 2, whereas 16 samples from the HC-fed fermenters were above. Within each group, samples tended to group by sampling day, although this pattern was only evident for inocula samples and fermenters’ samples of day 3. Percentages of variance explained by the principal coordinates 1 and 2 were 28.53% and 12.42%, respectively. Based on these results, separate dendrograms were constructed for samples from MC and HC fermenters. Samples from MC fermenters formed three clear clusters according to sampling day, and samples of day 3 subclustered further according digesta phase (Figure 2a); in contrast, no clear pattern of subclustering was observed for samples of days 8 and 14. Samples from HC fermenters grouped according incubation run (Figure 2b), with all samples from the first incubation run (fermenters 3 and 4) forming a cluster and those from the second incubation run grouping in a different cluster. Within each cluster, samples of day 3 formed a subcluster with samples from SOL and LIQ subgrouping further. Similarly to that observed for MC fermenters, no clear clustering pattern was detected for samples from days 8 to 14. For both diets, inocula samples formed a separated cluster and subclustered further according digesta phase (SOL and LIQ).
Principal coordinates analysis (PCoA) plot of Bray–Curtis dissimilarities in the automated ribosomal intergenic spacer analysis (ARISA) profiles of DNA samples from liquid (L) and solid (S) phases from Rusitec fermenters fed medium-concentrate (triangles) or high-concentrate (squares) diets. Points are colored according sampling time on day 0 (inocula, green), 3 (pink), 8 (yellow) and 14 (blue) after inoculation. Numbers 1 to 4 correspond to individual fermenters. Samples IN and INR are ruminal inocula in the incubation run 1 and 2, respectively.

Dendrograms of automated ribosomal intergenic spacer analysis (ARISA) profiles of bacterial communities in solid (S) and liquid (L) ruminal content from sheep used as inoculum (IN) and in Rusitec fermenters (F) for medium- (a) and high-concentrate diets (b). Incubation runs 1 and 2 are indicated by R1 and R2, respectively. Numbers 1 to 4 correspond to individual fermenters. In each case, donor sheep were fed the same diet incubated in the fermenters.

Fermentation parameters and relationships with microbial populations
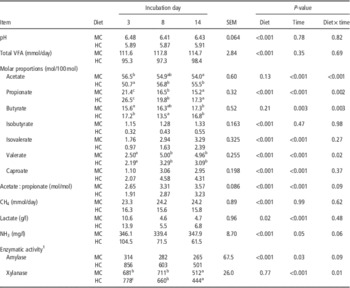
Values of pH, daily production of VFA and CH4 and molar proportions of isobutyrate in the fermenters remained stable from day 3 to 14 (P=0.345 to 0.985), but the rest of the fermentation parameters varied with time (Table 3). Molar proportions of acetate and propionate, lactate concentrations and enzymatic activities decreased (P<0.05) from day 3 to the end of the incubation, whereas molar proportions of butyrate, isovalerate, valerate and caproate, and acetate : propionate ratio increased with time (P<0.05). Significant diet×time interactions (P<0.05) were detected for the proportions of acetate, propionate, butyrate and valerate, and xylanase activity, and trends (P<0.10) were observed for acetate : propionate ratio, ammonia-N concentrations and amylase activity. As expected, the diet had a marked influence on fermentation parameters. Compared with the MC diet, the fermentation of the HC diet resulted in lower (P<0.001) pH values, proportions of isoacids and valerate, acetate : propionate ratios and ammonia-N concentrations, but greater propionate and caproate proportions (P<0.001), lactate concentrations (P=0.015) and amylase activity (P<0.001).
Evolution through the incubation period of fermentation parameters and enzymatic activity in Rusitec fermenters fed diets with medium- (MC) and high-concentrate (HC) content

VFA=volatile fatty acid.
1 Amylase activity is expressed as nanomoles of glucose released from soluble starch by 1 ml of liquid fermenters’ content in 1 min at 39°C and pH 6.5. Xylanase activity is expressed as nanomoles of xylose liberated from oat spelt xylan by 1 ml of liquid fermenters’ content in 1 min at 39°C and pH 6.5.
a,b,cWithin each row, means without a common superscript letters differ (P<0.05). Superscript letters are only shown when a significant (P<0.05) P value for both time effect and diet×time interaction were detected.
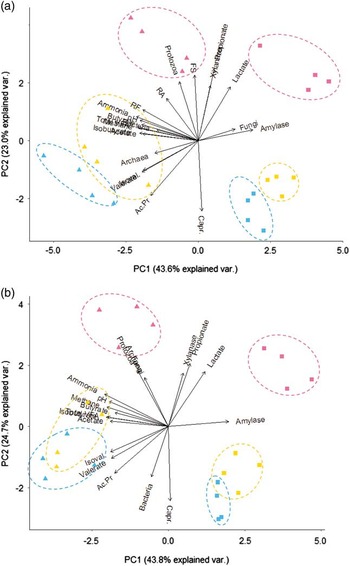
The PCA in Figure 3 shows how samples from different fermenters grouped according to the abundance of microbial populations and fermentation parameters. Samples taken on day 3 were clearly distinct from those taken on days 8 and 14, which largely clustered into their respective groups in SOL (Figure 3a), but showed some overlap in LIQ (Figure 3b). Samples from SOL and LIQ taken on day 3 from HC fermenters were related with greater propionate proportions, amylase activity and lactate concentrations, whereas those from MC fermenters were related to greater protozoa populations. For both SOL and LIQ, samples taken on days 8 and 14 from HC fermenters were related to greater caproate proportions and amylase activity, and those from MC fermenters were related to greater valerate and isovalerate proportions. The SOL samples from MC fermenters taken on day 3 were related to greater protozoal DNA concentrations and abundances of the three cellulolytic bacteria.
Principal component analysis plot of microbial populations and fermentation parameters (data from Table 3, excepting individual volatile fatty acid (VFA) that were expressed as mmol/day), with arrows indicating increasing values. Samples from solid (a) and liquid (b) phases from Rusitec fermenters fed medium-concentrate (triangles) or high-concentrate (squares) diets. Points are colored according to sampling time on day 3 (pink), 8 (yellow) and 14 (blue) after inoculation. Each symbol corresponds to a fermenter sample. Ac.Pr=acetate/propionate ratio; Capr=caproate; FS=Fibrobacter succinogenes; RF=Ruminococcus flavefaciens; RA=Ruminococcus albus.

Daily microbial growth
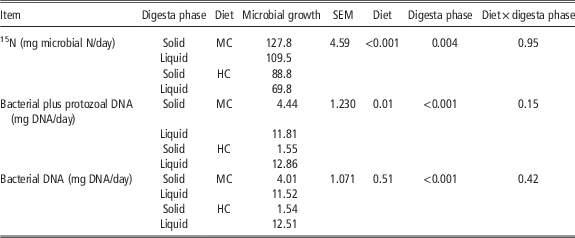
As shown in Table 4, there were no diet×digesta phase interactions for any method of estimating microbial growth (P=0.146 to 0.949). With both 15N and total DNA, the MC diet promoted greater (P<0.001 and 0.013, respectively) microbial growth than the HC diet, but there was no differences (P=0.509) between diets in the bacterial DNA. Whereas the use of 15N revealed greater (P=0.004) microbial growth in SOL compared with LIQ, the opposite was found for total microbial DNA and bacterial DNA (P<0.001). There were no relationship between the values of microbial growth obtained with 15N and the amount of total DNA (bacterial plus protozoal) in each fermenter (r=0.521; P=0.186; n=8), but a trend was observed when only values in LIQ were considered (r=0.620; P=0.100; n=8).
Daily microbial growth in the solid and liquid phases of Rusitec fermenters fed diets with medium- (MC) and high-concentrate (HC) content as determined using 15N as a microbial marker or from bacterial and protozoal DNA concentrations

Discussion
A decline over time in protozoa numbers has been repeatedly reported in the LIQ phase of Rusitec fermenters (Carro et al., Reference Carro, Lebzien and Rohr1995; Martínez et al., Reference Martínez, Ranilla, Tejido, Ramos and Carro2010c and Reference Martínez, Ranilla, Ramos, Tejido and Carro2011a; Lengowski et al., Reference Lengowski, Zuber, Witzig, Möhring, Boguhn and Rodehutscord2016), and our results also showed a decrease in the SOL phase, in agreement with that observed by Lengowski et al. (Reference Lengowski, Zuber, Witzig, Möhring, Boguhn and Rodehutscord2016) in Rusitec fermenters fed silages. In fact, there was a positive correlation between protozoal DNA concentrations in SOL and LIQ phases of the fermenters (r=0.844; P<0.001; n=24). Protozoal DNA concentrations in SOL were reduced from day 3 to 14 by 4.2 and 4.9 times for MC and HC diets, respectively, and by 4.9 and 11.5 times in LIQ. The lower pH in the HC fermenters probably contributed to their reduced protozoa population, as protozoa decreased at pH values<6.0 in Rusitec fermenters (Carro et al., Reference Carro, Lebzien and Rohr1995; Martínez et al., Reference Martínez, Ranilla, Ramos, Tejido and Carro2011a). Moreover, the shorter retention time of the SOL digesta in the HC fermenters could have also contributed to the lower protozoa concentrations, because the sequestration of protozoa among particulate digesta is an important factor in maintaining their concentration (Nakamura and Kurihara, Reference Nakamura and Kurihara1978).
Bacterial DNA concentrations increased with time in both digesta phases in MC fermenters and in the LIQ of HC fermenters. In Rusitec fermenters inoculated with sheep’ ruminal content, Prevot et al. (Reference Oksanen, Blanchet, Kindt, Legendre, Minchin, O’Hara, Simpson, Solymos, Stevens and Wagner1994) observed that fluorescence counts of bacteria in LIQ dropped markedly during the first 2 days of incubation, but remained fairly stable afterwards until the end of the 6-day incubation period. Similar results were observed by Lengowski et al. (Reference Lengowski, Zuber, Witzig, Möhring, Boguhn and Rodehutscord2016) in the LIQ phase Rusitec fermenters fed silages and inoculated with rumen fluid from cows, but bacterial concentrations in SOL were unchanged over a 13-day incubation period. Studies with continuous-culture fermenters and inocula from goats or cows have observed increased bacterial abundance with time (Soto et al., Reference Soto, Yáñez-Ruiz, Cantalapiedra-Hijar, Vivas and Molina-Alcaide2013), no temporal changes (Muetzel et al., Reference Muetzel, Lawrence, Hoffmann and Becker2009; Soto et al., Reference Soto, Molina-Alcaide, Khelil and Yáñez-Ruiz2012) or decreased abundances (Martínez-Fernández et al., Reference Martínez-Fernández, Abecia, Martin-Garcia, Ramos-Morales, Denman, Newbold, Molina-Alcaide and Yáñez-Ruiz2015). Differences in the source of the inoculum and its dilution with artificial saliva, the operation conditions of the fermenters, and the type of diet can help to explain the variability of these results.
The three fibrolytic populations analyzed showed a different evolution with incubation time. F. succinogenes was the most abundant in all fermenters on days 3 and 8, which is in good agreement with in vivo studies identifying F. succinogenes as the most abundant cellulolytic bacteria in sheep rumen (Michalet-Doreau et al., Reference Michalet-Doreau, Fernandez, Peyron, Millet and Fonty2001; Saro et al., Reference Saro, Ranilla and Carro2012 and Reference Saro, Ranilla, Cifuentes, Roselló-Mora and Carro2014b). The conditions in MC fermenters seem to have been more favorable for the growth of both Ruminococci, whose relative abundances remained quite stable, than for F. succinogenes. In contrast, the relative abundance of the three cellulolytic bacteria decreased with time in HC fermenters, which probably was partly due to the low pH values.
The relative abundance of methanogens in SOL increased from day 3 to 14, indicating that the conditions inside the feed-containing nylon bags were appropriate for their growth. Some species have doubling times longer than 12 h (Thauer et al., Reference Thauer, Kaster, Seedorf, Buckel and Hedderich2008) and therefore the long retention times of SOL would favor their growth. In contrast, the relative abundance of methanogens in the LIQ tended to decrease with increasing time for both diets. A factor that might have impaired the maintenance of methanogens and other microbes in LIQ is the daily opening of the fermenters to supply the feed, as methanogens growth has been reported to decrease in the presence of oxygen (Tholen et al., Reference Tholen, Pester and Brune2007). The lower relative abundances of methanogens in both digesta phases of HC fermenters may be pH related, as pH values in MC fermenters were in the range of optimum values for ruminal methanogenesis but those in HC fermenters were below (van Kessel and Russell, Reference van Kessel and Russell1996). The lower methane production in HC fermenters than in MC fermenters supports this hypothesis (Table 3).
The greater relative abundance of fungi in HC fermenters than in MC fermenters was unexpected, as it is contrary to the general idea that high-fiber diets would promote larger fungal populations due to the relevant role that they have in fiber degradation, but others have reported no differences in fungal relative abundances between diets with variable fiber content in continuous-culture fermenters (Soto et al., Reference Soto, Molina-Alcaide, Khelil and Yáñez-Ruiz2012).
The dendrograms in Figure 2 clearly show changes in bacterial diversity over the incubation period. Samples from MC fermenters grouped according sampling day, but samples from HC fermenters separated in two groups according incubation run, which was attributed to a greater individual variability in the bacterial populations when sheep were fed the HC diet. For both diets, inocula samples formed a separated cluster, indicating that bacterial populations markedly changed after inoculation of fermenters. Inocula samples subclustered according digesta phase, confirming the results from previous studies showing differences in bacterial diversity between SOL and LIQ phases in sheep rumen (Michalet-Doreau et al., Reference Michalet-Doreau, Fernandez, Peyron, Millet and Fonty2001; Saro et al., Reference Saro, Ranilla, Tejido and Carro2014a).
The greater bacterial diversity observed in the SOL phase of MC fermenters compared with HC fermenters agrees well with the results of in vivo studies in sheep fed different diets (Martínez et al., Reference Martínez, Ranilla, Tejido, Ramos and Carro2010a). The lack of differences between diets in bacterial diversity in the LIQ phase of the fermenters supports other results showing a lack of influence of diets with different forage : concentrate ratio on bacterial diversity (assessed by ARISA) in the ruminal fluid of sheep (Martínez et al., Reference Martínez, Ranilla, Tejido, Ramos and Carro2010a). In contrast, Kocherginskaya et al. (Reference Kocherginskaya, Aminov and White2001) reported higher diversity (assessed by denaturation gradient gel electroforesis (DDGE) and shotgun libraries) in the LIQ phase of the rumen of corn-fed steers than in those fed hay. Diet has been repeatedly shown to affect the bacterial community profile, but it is difficult to draw general conclusions, as its influence on bacterial populations in SOL and LIQ digesta may be variable. In addition, the fingerprinting technique used to measure bacterial diversity could influence the results obtained (Saro et al., Reference Saro, Ranilla, Tejido and Carro2014a).
The evolution of fermentation parameters confirmed previous results indicating that an 8-day adaptation period was adequate to reach relatively steady-state conditions in the fermenters (Martínez et al., Reference Martínez, Ranilla, Ramos, Tejido and Carro2011b), because most of parameters had similar values on days 8 and 14. Moreover, differences between the two diets in fermentation parameters followed the pattern observed in vivo (Ramos et al., Reference Ramos, Tejido, Ranilla, Martínez, Saro and Carro2009a; Martínez et al., Reference Martínez, Ranilla, Tejido, Ramos and Carro2010a) for diets with different concentrate proportions. The PCA (Figure 3a) placed the 3-day SOL samples from MC fermenters coupled with increasing relative abundance of the three cellulolytic bacteria, which is in agreement with the greater abundance of cellulolytic bacteria observed in sheep fed high- or medium-forage diets compared with those fed HC diets (Mosoni et al., Reference Mosoni, Chaucheyras-Durand, Béra-Maillet and Forano2007). The relative abundance of cellulolytic bacteria was related to butyrate proportions, but surprisingly was not associated to acetate proportions. As pointed out by Mosoni et al. (Reference Mosoni, Chaucheyras-Durand, Béra-Maillet and Forano2007), qPCR quantifies both viable and non-viable cells and therefore may not reflect the real activity of these species in the rumen at the sampling time.
Belanche et al. (Reference Belanche, de la Fuente, Yañez-Ruiz, Newbold, Calleja and Balcells2011) reported similar estimates of microbial growth in lambs using purine bases as a microbial marker and microbial DNA sequences (bacterial and protozoal DNA). Our study confirmed only partially their results, as both 15N and quantification of total microbial DNA detected greater microbial growth in MC fermenters than in HC fermenters, but showed different results in the comparison of microbial growth in SOL and LIQ digesta. It has to be noticed that both 15N enrichment and total microbial DNA were measured in the same SOL samples, but in different LIQ samples (15N in the effluent and total microbial DNA in fermenters’ content). This was done to collect SOL and LIQ samples at the same time in relation to feeding. Lengowski et al. (Reference Lengowski, Zuber, Witzig, Möhring, Boguhn and Rodehutscord2016) reported that bacterial and protozoal rRNA genes concentrations in the liquid of Rusitec fermenters on day 13 of incubation were relatively stable over a period of 24 h. However, studies analyzing 15N enrichment and total microbial DNA in the same LIQ samples would be necessary to confirm the suitability of the quantification of total microbial DNA to estimate microbial growth in vitro in Rusitec fermenters.
In conclusion, the Rusitec system was able to maintain all microbial populations studied, but the abundance (absolute or relative) of most of them decreased over the incubation period and varied markedly from those in the inocula. Distinct microbial populations were found in the solid and liquid phases of the fermenters, and the influence of the diet was, in general, more pronounced in the solid digesta than in the liquid phase.
Acknowledgments
This work was supported by the Spanish Ministry of Economy and Competitiveness under the Project AGL2011-22628. We would like to thank Dr Benjamin Rabanal for helping us with qPCR and ARISA analyses.