



Nomenclature
- EA
-
energy absorption
- HEX
-
hexagonal honeycomb
- REH
-
re-entrant honeycomb
- SEA
-
specific energy absorption
- a
-
unit cell length
- s
-
unit cell height
- t
-
wall thickness
- v
-
impact speed
- ɛ
-
strain
1.0 Introduction
In recent years, driven by the rapid development of the low-altitude economy [Reference Sun, Wang, Zhang and Wandelt1] and the urban air mobility (UAM) sector [Reference Johnson and Silva2], the number of small aircraft, unmanned aerial vehicles (UAVs) [Reference Almeida, Da Silva and Rodrigues Pinto3] and rotorcraft has increased significantly [Reference Meng, Ji, Liu, Liu, Sun, Xiao and Yang4]. This phenomenon has made safety and reliability a vital focus in current aerospace design [Reference Brown5]. Crashworthiness is the critical safety metric used to evaluate an aircraft’s ability to protect its occupants and vital components during landing or crashing [Reference Adams and Lankarani6]. Crashworthy fuselage structures are a highly critical design objective, contributing significantly to enhancing occupant survivability during impact events [Reference Guida, Marulo and Abrate7]. However, the fuselage structure must not be overly stiff to avoid transmitting or amplifying high-impact loads to the occupants. Ideally, the design should incorporate frangible elements to effectively limit the load transmitted to the occupants.
Research efforts aimed at enhancing aircraft crashworthiness are predominantly focused on the design of the bottom structure of the fuselage [Reference Xianfei, Yunwen, Xiaofeng and Qiang8], which serves as the critical barrier for absorbing vertical impact energy [Reference Atli-Veltin and Gandhi9] and protecting occupants. Some specific concepts have been proposed to improve crash performance [Reference Alkhatib, Mahdi and Dean10, Reference Wang, Nie and Ren11]; for instance, Jackson et al. [Reference Jackson, Fasanella and Kellas12] introduced a composite fuselage concept utilising highly efficient energy absorbers such as composite sandwich, truss structures, composite tubes and crushable foam blocks as the substructure of the cabin floor. Ren et al. [Reference Ren and Xiang13] investigated the influence of various strut configurations on failure mechanisms and energy absorption (EA). Meng et al. [Reference Meng, Zhou and Yang14] proposed using hexagonal honeycombs as a floor structure energy absorber without sacrificing cargo volume. While there is extensive research concerning the bottom of conventional aircraft [Reference Ren and Xiang15], studies focusing on the sub-floor energy-absorbing structures for small aircraft remain insufficient.
Honeycomb structures have been widely applied in the energy-absorbing design of aerospace and vehicle structures owing to their high strength-to-weight ratio, high stiffness-to-weight ratio and prominent EA performance [Reference Zhang, Yang, Li, Huang, Feng, Shen and Lu16–Reference Wang, Ren and Jiang19]. Foundational research by Gibson and Ashby systematically elucidated the EA mechanisms of hexagonal honeycombs [Reference Gibson and Ashby20], facilitating their sustained application in engineering energy-absorbing structures. Recently, negative Poisson’s ratio honeycombs [Reference Wang, An, He, Wen and Xi21–Reference Zheng, Wang, Wang and Yue24] have emerged, featuring re-entrant geometric topologies that enable more stable hierarchical folding and enhanced EA efficiency during compression [Reference Xiao, Kang, Li, Wu, Lu, Zhao and Fang25–Reference Luo, Gao, Zhou, Zhang, Bao, Chen and Wang27]. Consequently, these materials have become a focal point of research in the domain of structural EA [Reference Al Antali, Umer, Zhou and Cantwell28]. Numerous investigations have been conducted on metal frames, energy-absorbing tubes [Reference Ren and Xiang29] and honeycomb sandwich structure [Reference Li, Wang, Xu, Cao and Li30–Reference Wang, Ren, Guo, Yang, Deng, Yang and Jiang32]. However, there is still a gap in the research on applying these energy-absorbing technologies to the bottom structure of small aircraft or helicopters.
Low-altitude aircraft are characterised by small geometric scales and limited internal space, which significantly restricts the integration of energy-absorbing components [Reference Goyal, Reiche, Fernando and Cohen33]. Moreover, research on the crashworthiness of low-altitude aircraft remains relatively limited. This paper proposes a design method for different types of honeycomb fillers for the bottom of small aircraft. Unlike conventional studies that mainly focus on flat honeycomb specimens, the present work introduces a geometry-conforming honeycomb energy-absorbing layer integrated into the curved lower fuselage, which better represents the constrained space and deformation characteristics of real aircraft structures. Two typical honeycomb structure designs, standard hexagonal honeycomb (HEX) and re-entrant honeycomb (REH), were selected for investigation. Firstly, the foundational honeycomb models were validated using the LS-DYNA explicit dynamics model. Subsequently, the impact of honeycomb type, cell size (3–6 mm), and wall thickness (0.2–0.5 mm) on deformation behaviour, plateau stress characteristics and SEA was comprehensively examined. The findings provide useful guidance for improving the crashworthy design of small aircraft during low-altitude flight operations.
2.0 Structure design
Electric vertical take-off and landing (e-VTOL) aircraft primarily operate within urban and peri-urban low-altitude airspace, where the complexity of the operating environment poses significant challenges to safety [Reference Meng, Ji, Liu, Liu, Sun, Xiao and Yang4]. Among various safety considerations, crashworthiness is a critical aspect that directly affects the survivability of the aircraft under impact conditions. Compared with conventional commercial aircraft, eVTOL vehicles exhibit highly diverse configurations and lack unified design standards. Their limited capability for unpowered landing further increases the risk under emergency conditions. In addition, crash scenarios for eVTOL aircraft are inherently complex, involving diverse ground conditions and potential interactions with urban infrastructures such as buildings. Furthermore, due to constraints imposed by onboard energy systems, eVTOL aircraft require an extreme lightweight design, which restricts their passive EA capacity [Reference Xu, Guan, Wang, Zhuang and Gan34]. The relatively small overall size of these vehicles also leads to limited available space for crashworthiness design, making it difficult to incorporate dedicated energy-absorbing components in a conventional manner. Under these constraints, integrating lightweight and efficient energy-absorbing structures into limited and geometrically constrained spaces becomes a key challenge.
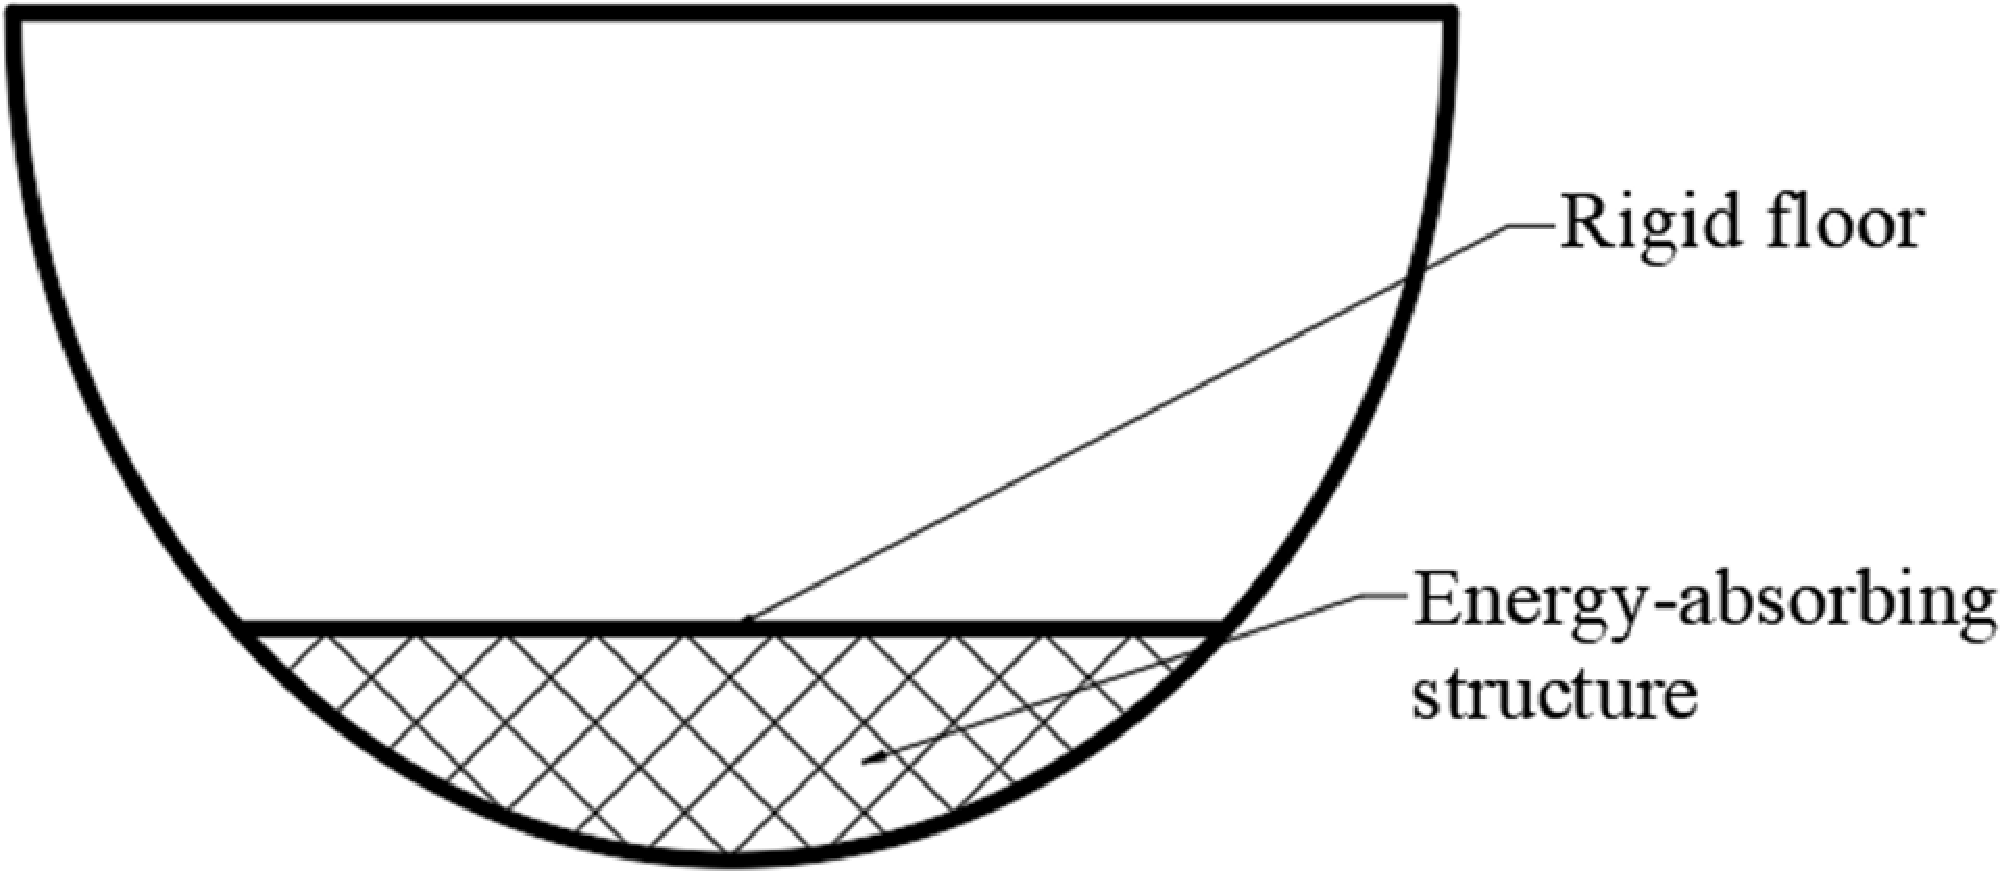
To investigate the influence of structural scale on impact response, this study adopted a periodic array of honeycomb energy-absorbing structures, and the overall layout was consistent with the simplified cross-section of the small aircraft shown in Fig. 1. The structure comprises an energy-absorbing layer positioned within the arc-shaped body shell and an upper rigid floor, creating a typical ‘rigid support layer-energy-absorbing filling layer-skin’ sandwich configuration. This energy-absorbing structure is closely aligned with the arc contour at the bottom of the aircraft, allowing it to exhibit similar deformation to the skin during impact landings, which significantly mitigates the peak load experienced by the main structure. This design not only adheres to the structural characteristics of an actual aircraft bottom but also establishes a reliable framework for assessing the mechanical response of the honeycomb structure under spatial constraints.
Structure layout of small aircraft and helicopter.

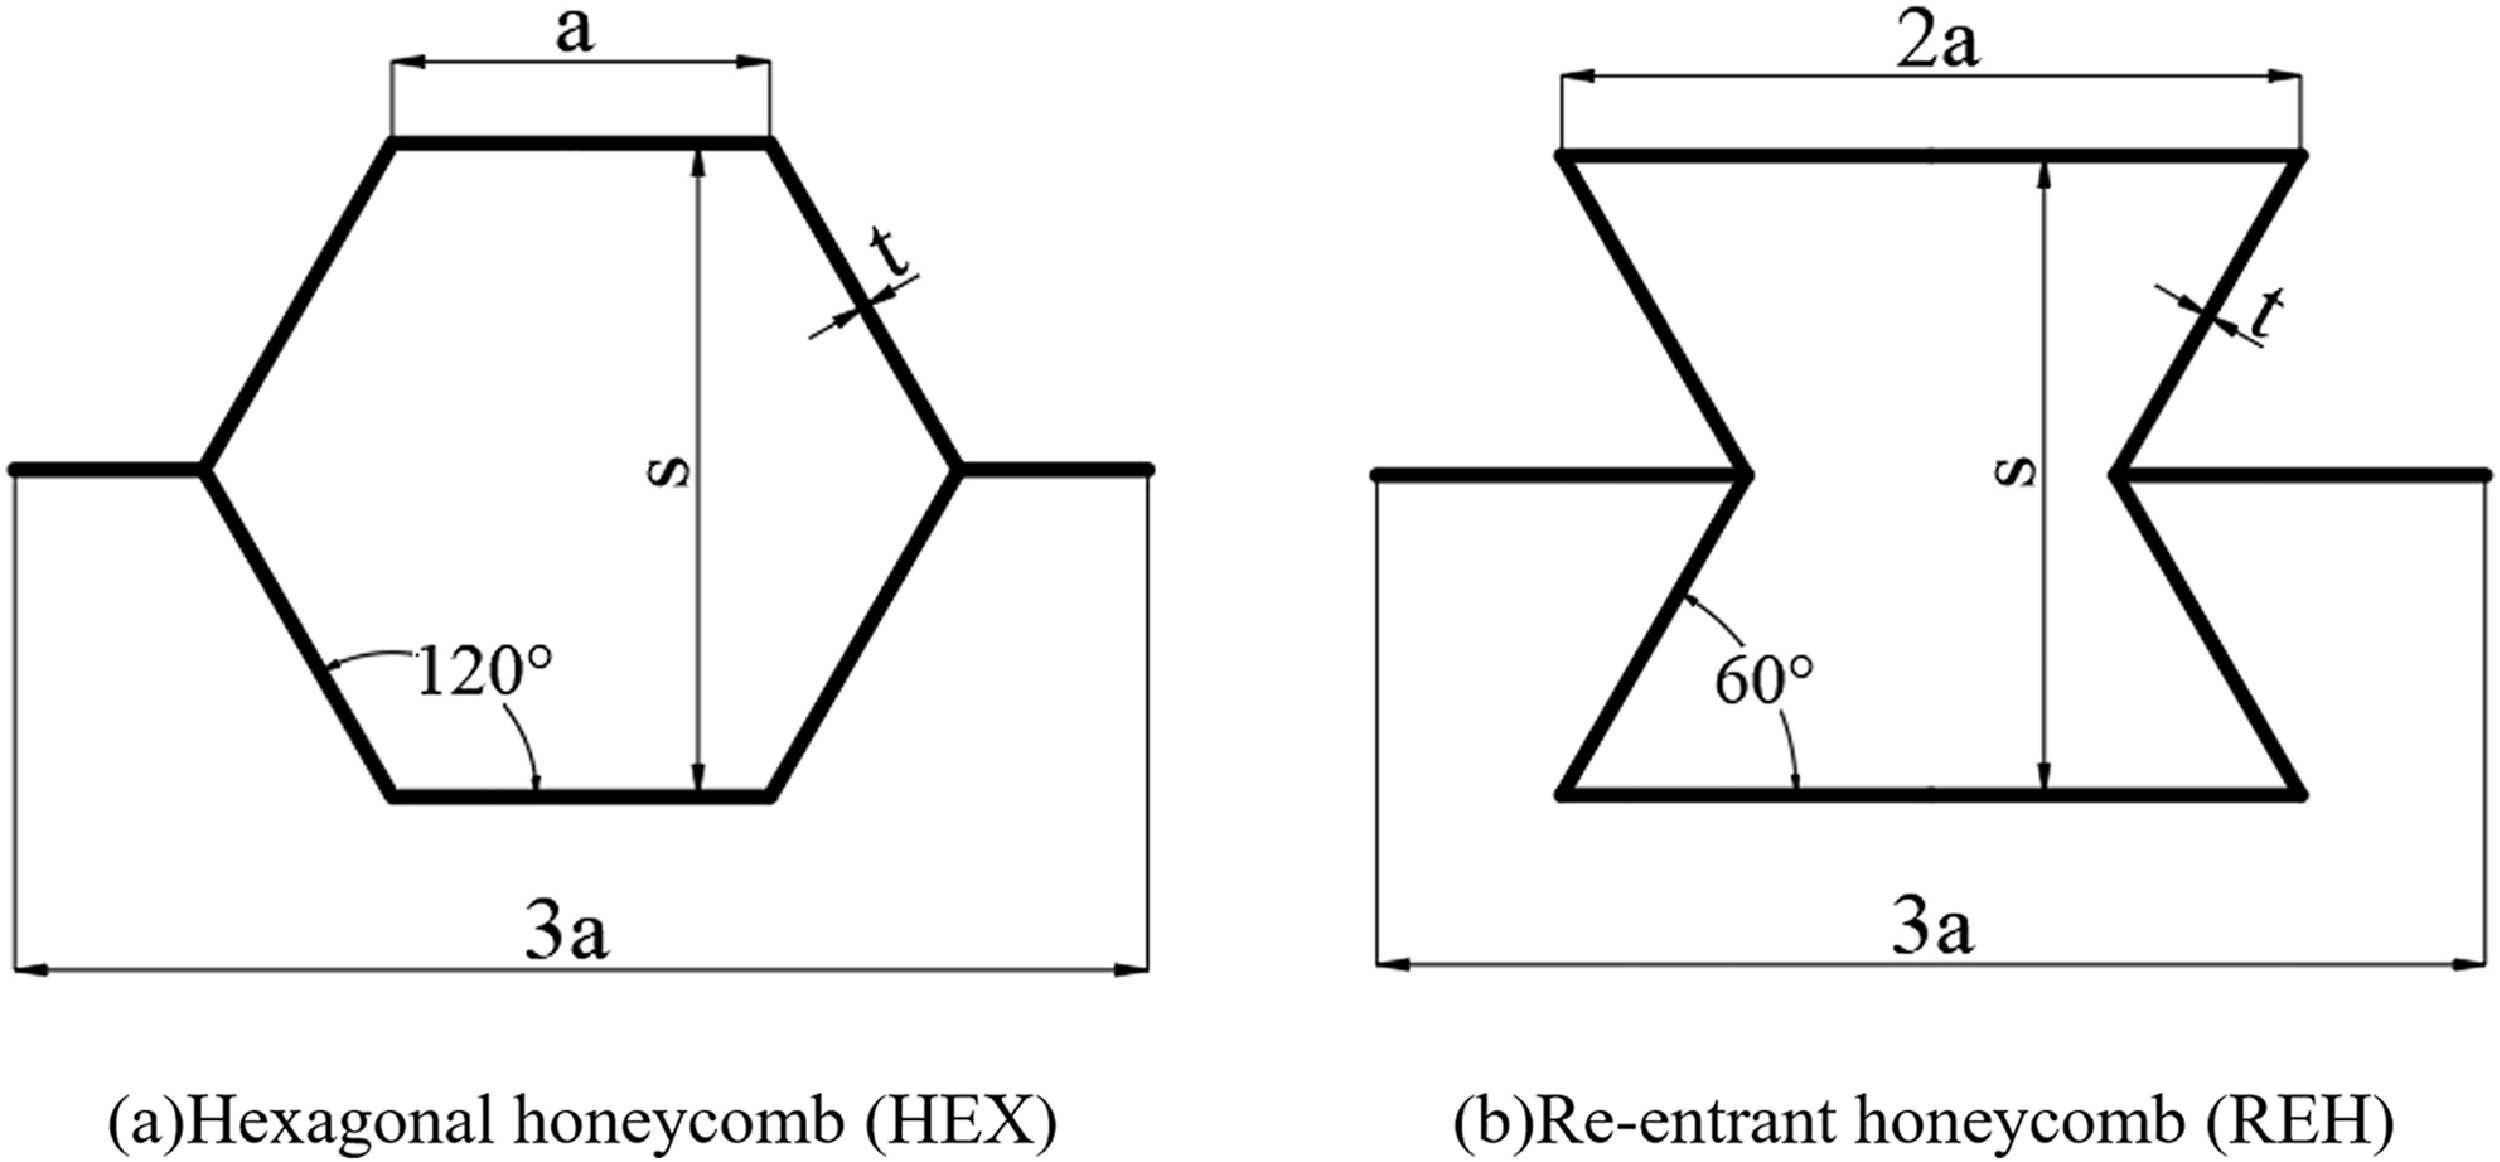
Honeycomb structures are extensively utilised in aerospace applications for landing buffering and impact protection, owing to their high specific strength, superior plastic buckling characteristics and stable EA performance [Reference Deng and Qin35–Reference Zou, Xu, Niu, Fang and Jiang37]. This study leverages the mechanical advantages of conventional hexagonal honeycombs and incorporates topological design concepts to develop two types of honeycomb unit cell structures suitable for the bottom filling of a small aircraft, as illustrated in Fig. 2. These structures include standard HEX and REH. Both unit cell types can be periodically assembled to create macroscopically uniform filling materials while exhibiting distinct buckling mechanisms during the compression process. This allows for a comparative analysis of their EA capabilities and crushing deformation modes under vertical impact conditions.
Structural schematics of HEX and REH honeycomb cells.

The standard HEX unit cell, depicted in Fig. 2(a), mimics the efficient packing arrangement of natural honeycombs. With its 120° internal angle, the HEX unit cell can easily generate controlled interlaminar buckling bands when subjected to pressure [Reference Hu, You and Yu38]. This characteristic not only establishes a stable stress section but also effectively mitigates local stress concentration. The dimensions of the HEX unit cell are governed by three primary parameters: cell length (a), height (s) and wall thickness (t). The total width of the unit cell equals 3a. This configuration finds extensive application in lightweight energy-absorbing components in engineering and is particularly valuable for investigating the distinct deformation behaviours of unit cells of varying sizes during the absorption of impact energy. As shown in Fig. 2(b), REH utilises the design principles of auxetic structures, characterised by a negative Poisson’s ratio. By incorporating a 60° angle of inward contraction, the unit cells exhibit a pronounced tendency for lateral shrinkage under applied pressure. In contrast to the convex profile of the HEX structure, REH unit cells are more prone to initiate multi-level buckling during vertical compression, thereby enhancing initial EA efficiency. The geometric parameters of REH correspond to those of HEX, with the horizontal length of each unit cell measuring 2a and the overall width measuring 3a. This configuration ensures that the dimensions are comparable to those of HEX-filled honeycombs, facilitating a better fit with the arc shell at the bottom of the aircraft.
This study establishes four distinct unit cell sizes (
 $a = 3$
, 4, 5, 6 mm) for both types of honeycomb unit cells (HEX and REH). It maintains a consistent wall thickness (t) and relative density across these sizes to ensure uniform material usage. By employing this parameterisation approach, the study systematically analyses the effects of cellular scale on structural buckling modes, platform stresses and SEA. Furthermore, both honeycomb unit cell types satisfy periodic laying conditions, resulting in uniform filling materials on a macro scale, which ensures consistent overall equivalent performance across varying unit cell sizes. This conforming configuration ensures a continuous load path between the external skin and the primary energy-absorbing units, facilitating an immediate and uniform distribution of impact forces while preventing localised stress concentrations or premature skin buckling. This configuration allows the energy-absorbing structure to closely conform to the geometry of the aircraft’s bottom, thereby facilitating the subsequent development of a complete finite element model and impact response analysis.
3.0 Finite element model and validation
3.1 Finite element model
This study employs a one-fifth-scale simplified fuselage model [Reference Jackson, Fasanella and Kellas12] to approximate the cylindrical fuselage structure, with certain simplifications introduced, including the neglect of the influence of longitudinal stiffeners on the deformation behaviour. This approach is necessitated by the limited space in small aircraft compared to larger ones. In this context, the floor is treated as a rigid plate, with the weight of seats, passengers and the fuselage structure situated above it. The simplified fuselage model is illustrated in Fig. 3. The elliptical aspect ratio of the fuselage is 1: 0.85, with a total height of 304.8 mm, a total width of 259.08 mm and a distance of 41.656 mm between the floor and the bottom of the fuselage, which corresponds to the height of the energy-absorbing layer. As the floor functions as a rigid plate, solely the lower part of the fuselage with the floor is constructed using Al-2024-T3 material with properties detailed in Table 1. The combined mass of the floor and fuselage is 4.46 kg, with the fuselage thickness set at 50 mm. The initial descent speed of the fuselage model is defined as
 $v = 9.45$
m/s, positioned 1 mm above the inflexible wall. Due to limitations in the contact algorithm of the finite element software, contact between the fuselage’s bottom and the platform initiates at 0.1 ms to prevent instantaneous contact at time zero. This 0.1 ms delay, although brief in the context of the entire impact event, allows for assuming that contact for the falling simulation commences at
 $t = 0$
ms.
Properties of the Al-2024-T3

Table 1 Long description
A table detailing the properties of Al-2024-T3 material. The table has four columns and one row. Column headers are Young modulus (MPa), Poisson's ratio, Yield stress (MPa), and Mass density (kg/m^3). Row 1: Young modulus, 70,000; Poisson's ratio, 0.33; Yield stress, 385; Mass density, 2,700.
Simplified scaled fuselage FE model.

3.2 Model validation
This study established a finite element model consistent with that described in the literature [Reference Ruan, Lu, Wang and Yu39], as illustrated in Fig. 4(c). In this model, 16 honeycomb unit cells are arranged in the
 $X_{1}$
direction, while 15 honeycomb unit cells are oriented in the X2 direction. The dimensions of the unit cell are defined as
 $s = 4.7$
mm and
 $a = 2.7$
mm, corresponding to the geometric parameter
 $\beta = 120^{\circ}$
, as indicated in Fig. 4(a). The wall thickness of each unit cell is set to 0.2 mm. Numerical simulations were conducted using LS-DYNA for dynamic analysis. The cellular walls were discretised using Belytschko-Tsay shell elements, which are computationally efficient for large deformation analysis. To suppress zero-energy modes, Flanagan-Belytschko stiffness-based hourglass control was applied. The material constitutive model incorporates elastic and ideal plastic characteristics. The Young’s modulus is specified as 69 GPa, the yield stress is 76 MPa and the Poisson’s ratio is 0.3.
Validation model for aluminum honeycomb crushing. (a) Cell size. (b) Crushing test [Reference Papka and Kyriakides40]. (c) Crushing simulation.

To identify the optimal mesh density, a sensitivity analysis was performed as illustrated in Fig. 5. The results indicate that the simulated crushing force tends to converge and stabilize when the element size is refined below 1 mm. While further refinement increases the computational overhead, the variation in results remains negligible. Consequently, a mesh size of 1 mm was adopted to achieve a robust balance between numerical accuracy and computational efficiency. Each edge of the unit cell is represented using three continuous shell elements, resulting in a total of 2,280 model elements. Each hexagonal honeycomb is defined as a distinct automatic self-contact surface. Additionally, to account for potential contact behaviour on the outer surface of the honeycomb cells during the crushing process, surface-to-surface self-contact conditions are implemented. Convergence analysis confirms that employing five integration points along the thickness direction of the cell unit suffices to ensure calculation accuracy. The loading method involves compressing the honeycomb structure with a rigid impact plate moving at a constant speed of 14 m/s. The rigid plate is applied in the
 $X_{1}$
direction, constraining all degrees of freedom at the bottom boundary of the honeycomb specimen. The left, right and upper boundaries are designated as free boundaries, allowing movement only in the in-plane direction. The rigid plate compresses the upper side along the
 $X_{1}$
direction at the specified speed. To facilitate overall contact, an interaction with a friction coefficient of 0.2 is implemented to prevent hard contact between units from penetrating one another.
Mesh convergence analysis.

To verify the accuracy of the finite element model, a numerical model was established under the same working conditions as described in Fig. 4(b). This model was used to compare the force and displacement curves of the hexagonal honeycomb at an impact speed of 14 m/s. As illustrated in Fig. 6(a), the trends of the force and displacement curves for both the verification model and the reference model are largely consistent. The initial peak force and subsequent platform stress errors are both less than 2%. Furthermore, the deformation mode is fundamentally consistent with that of the reference model, as shown in Fig. 6(b),(c), thereby confirming the validity of the finite element model presented in this article for further simulation research.
Verification of the FE model. (a) The force and displacement curves of Ref. [Reference Ruan, Lu, Wang and Yu39] and the FE results. (b) Deformation pattern in Ruan et al. [Reference Ruan, Lu, Wang and Yu39]. (c) Deformation pattern in this paper.

4.0 Result and discussion
4.1 Energy absorption and deformation mechanisms
This section discusses the results of various lattice structure configurations to identify the optimal energy-absorbing performance. EA reflects the capability to dissipate impact energy, while SEA represents the efficiency of lightweight EA. The load–displacement response is associated with load transmission to the upper structure, which is critical for structural safety and occupant protection. Additionally, the deformation patterns of each unit cell lattice structure are examined to further elucidate the underlying energy dissipation mechanisms.
Figure 7 shows the crushing deformation diagrams of the honeycomb filling structures of HEX and REH under the same conditions of impact velocity, unit cell size and cell wall thickness. Using an impact speed of
 $v = 9.45$
m/s, a unit cell size of
 $a = 3$
mm, and a cell wall thickness of
 $t = 0.2$
mm, this study analyses the deformation characteristics of HEX- and REH-filled structures. In the initial impact state of the HEX-filled structure, the honeycomb cells are arranged uniformly. During the initial contact phase of the impact, the lower part of the arc makes contact with the ground first, leading to deformation. Unlike the ‘X’-shaped belt that is crushed by a conventional honeycomb structure, the regular hexagonal honeycomb experiences both vertical compression and lateral tension due to the bottom skin of the small aircraft. This results in a localised deformation zone resembling a ‘W’-shaped belt. As the impact progresses, the HEX-filled structure absorbs energy steadily and continuously, causing the deformation zone to expand laterally from the initial ‘W’ shape. The cells compress and exert tensile forces on one another until the honeycomb is entirely crushed, marking the conclusion of EA. Upon initial contact with the impact, the stress mode of the REH-filling structure resembles that of HEX. The concave-corner honeycomb experiences not only vertical compression but also transverse tension exerted by the skin, leading to a fish-scale-like deformation zone. In this process, the central unit cell undergoes polymerisation first, while the surrounding unit cells converge toward the centre. The REH exhibits fully organised folding, resulting in a uniformly distributed deformation area. During the stable EA phase, the REH maintains a highly layered and evenly folded configuration, expanding into a larger fish-scale-like deformation zone, which significantly enhances EA efficiency.
Impact crushing deformation of HEX and REH.

Comparison of crushing deformation responses of HEX and REH. (a) Energy absorption. (b) Specific energy absorption, (c) Load-displacement response.

Figure 8(a) illustrates the EA curves and SEA curves of HEX and REH under identical working conditions. Initially, the energy growth trends of the two filled honeycombs exhibit similarities during the impact phase, as both gradually accumulate EA. However, after 3 ms, the EA growth rate of REH experiences a significant increase. Following the attainment of the EA peak, this rate gradually levels off and stabilises. In terms of total EA, REH demonstrates superior EA capabilities compared to HEX. SEA, defined as the impact energy absorbed per unit mass of the structure, serves as a critical metric for assessing lightweight EA performance. This measure circumvents the inefficient paradigm of ‘heavy structure and high EA’ and is frequently employed to evaluate cushioning structures, such as honeycombs and foams. The SEA of HEX surpasses that of REH during the initial impact stage (0∼3.5 ms) depicted in Fig. 8(b). Subsequently, post 3.5 ms, REH exhibits a more rapid increase in SEA, possibly attributed to the concave topology guiding a ‘fish-scale-like orderly folding’. This deformation facilitates the swift conversion of energy into controlled plastic deformation in the early impact phase, leading to the formation of a novel zigzag deformation zone. Nevertheless, as the folding space nears saturation in the later stage, the ensuing EA peak does not reach the same height as that of HEX, thereby establishing HEX’s superiority over REH in terms of lightweight characteristics.
As illustrated in Fig. 8(c), EA persists until both loads attain their maximum values when the collision displacement approaches approximately 35 mm. At this juncture, the load experiences a rapid increase, the deformation space of the cell becomes fully utilised, and the honeycomb structure transitions into a state of crushing saturation. Consequently, the honeycomb-filling structure shifts from ‘plastic deformation EA’ to ‘densified structure bearing’. Notably, the peak load of REH exceeds that of HEX.
Deformation patterns of HEX cells with different cell sizes (
 $a = 3$
, 4, 5, 6 mm).

4.2 Effect of unit cell size
In our analysis of the EA characteristics and crushing deformation modes of HEX and REH, we observed that EA is influenced by the deformation of the honeycomb structure and the spacing during unit cell crushing. Consequently, we performed a comparative analysis of HEX and REH across various layer configurations to develop honeycomb-filled structures with differing layers. In this section, we examine unit cell sizes of
 $a = 3$
, 4, 5 and 6 mm for the different layers. Under consistent impact conditions, we assess the impact of cell size on the performance of HEX and REH.
Figure 9 illustrates the variations in deformation modes of HEX corresponding to different cell sizes. As the cell size increases, the porosity of the overall filling material also increases, enhancing the lightweight effect. However, the deformation mode crush diagram indicates a reduction in the number of ‘W’-shaped deformation bands produced, which theoretically suggests a decrease in the energy absorbed. The deformation of small-sized cells (
 $a = 3$
mm) during the initial contact stage of impact (
 $\varepsilon = 0.2$
) is primarily localised in small areas. In the stable energy-absorbing stage (
 $\varepsilon = 0.4$
), the deformation band evolves into multiple overlapping ‘W’-shaped local deformation bands. Conversely, large-sized cells (
 $a = 6$
mm) experience extensive deformation during the initial contact stage without developing a relatively regular deformation band. In the stable energy-absorbing stage, the deformation band expands in a disordered manner. The fragmentation pattern changes markedly with increasing cell size. The structure of small-sized cells remains relatively compact during the crushing and saturation stage, with the multi-layer deformation zone retaining a degree of order. In contrast, after the crushing of large-sized cells, the level of structural dispersion increases significantly, resulting in more severe cell collapse and damage, which manifests as a more chaotic fragmentation pattern. The impact deformation of HEX is influenced by cell size in the following manner: as cell size increases, the concentration of deformation diminishes progressively, disorder escalates, and the force transmission pathway transitions from dense and controllable to sparse and dispersed. Consequently, this shift results in an increased degree of fragmentation following crushing as cell size increases.
To assess the influence of honeycomb structure unit cell size on the impact response of an aircraft’s bottom, Fig. 10 presents the EA-time curve and SEA-time curve for HEX honeycombs with varying unit cell sizes (
 $a = 3$
, 4, 5, 6 mm) under vertical impact conditions. Notably, all four model groups exhibit an approximately linear growth trend during the initial 0∼3 ms. This phase is primarily governed by the overall stiffness of the main structure and represents the energy accumulation stage in the early moments of impact. As compression deformation progresses, the interior of the honeycomb transitions into the plastic buckling and unit cell collapse stages, leading to a marked difference in EA rates, which highlights the impact of geometric configuration.
Comparison of deformation responses of HEX structures with different cell sizes. (
 $a = 3$
, 4, 5, 6 mm). (a) Energy absorption. (b) Specific energy absorption.

From the perspective of EA changes, a smaller unit cell size correlates with a greater EA capacity. HEX-3 exhibits the highest EA level throughout the process, achieving a final EA of approximately 600 J, which is markedly superior to that of other unit cell sizes. HEX-4 follows with a second-highest EA capacity of around 500 J, while HEX-5 and HEX-6 demonstrate final EAs in the range of 250–300 J. This observed trend primarily results from the increase in relative density and the greater number of buckling units that arise from reducing the unit cell size. Consequently, this configuration provides more structural units capable of participating in plastic collapse, thereby significantly enhancing the overall EA capacity. The evolution of SEA over time exhibits a distinct pattern compared to overall EA. Although HEX-3 demonstrates the highest absolute EA, its larger mass results in a lower SEA. The SEA curve indicates that HEX-4 experiences a pronounced growth peak around 4.5ms, achieving a final SEA of 12–13 kJ/kg, the highest among the four model groups. In contrast, HEX-3 attains a final SEA of approximately 11 kJ/kg, while HEX-5 and HEX-6 reach final SEAs of 8–9 and 10–11 kJ/kg, respectively. These findings suggest that HEX-4 strikes an optimal balance between structural quality and EA capacity, representing the unit cell size with the most exceptional SEA performance under the current working conditions.
In summary, the EA performance of HEX-filled structures is highly dependent on the scale of the unit cell. The small unit cell structure (3 mm) markedly enhances the absolute EA capacity, whereas the medium unit cell size (4 mm) exhibits optimal performance regarding the EA-to-mass ratio. These characteristics underscore its advantages in balancing lightweight design with EA efficiency. This principle holds significant engineering implications for optimising the bottom protection structures of small aircraft and enhancing landing buffer performance.
Figure 11 illustrates the typical evolution of deformation modes in the REH filling structure subjected to varying compressive strains (
 $\varepsilon = 0$
, 0.2, 0.4, 0.6) for unit cell sizes of 3, 4, 5, 6 mm, respectively. Overall, all four size models exhibit commendable geometric integrity during the initial stages of compression. As the compression ratio escalates, the internal unit cells progressively transition from local buckling to global collapse. Notably, the different unit cell sizes exhibit distinct buckling sequences and variations in the distribution of collapse areas.
Deformation patterns of REH cells with different cell sizes (
 $a = 3$
, 4, 5, 6 mm).

At
 $\varepsilon = 0.2$
, a localised buckling band emerges at the bottom of the REH models across all sizes. The buckling regions in the 3 mm and 4 mm unit cell sizes are relatively concentrated, resulting in a more regular, fish-scale-like deformation band. In contrast, the 5 mm and 6 mm models exhibit larger-scale unit rotation and shear distortion. This variation indicates that smaller unit cell sizes exhibit a more uniform mode of local buckling initiation, facilitating the formation of a continuous and dense micro-buckling zone. Conversely, the larger unit cell structures are more susceptible to overall compression at the unit level, leading to a more dispersed deformation and rendering their structural stability during the initial EA stage comparatively weaker. Upon reaching a compressive strain of
 $\varepsilon = 0.4$
, the disparity in unit cell sizes becomes more pronounced. The 3 mm and 4 mm configurations exhibit a characteristic layer-by-layer collapse. The buckling region demonstrates a symmetric expansion trend radially, with a uniform failure mode suggesting the maintenance of a stable stress transfer pathway under significant compression. With larger unit cell sizes, fewer fish-scale deformation bands form, leading to the development of buckling in a localised area or along one side, causing an asymmetric collapse of the internal structure. This mode of instability is typically linked to reduced platform forces and EA capacities. At the final deformation stage (
 $\varepsilon = 0.6$
), all four unit cell sizes exhibit significant densification. The 3 mm and 4 mm models demonstrate a relatively continuous collapse sequence, with the internal structure appearing densely stacked under a high compression ratio and lacking large-scale uncollapsed areas. In contrast, the 5 and 6 mm models reveal noticeable cavity residues and incomplete buckling regions within the dense area. This observation suggests that activating the plastic deformation of all units during the deep compression stage is challenging, thereby limiting the overall EA capacity. Furthermore, as the unit cell size increases, the collapsed structure exhibits a more pronounced lateral expansion trend, indicating that the geometric constraint capability of larger unit cells under substantial deformation is diminished.
Overall, REH exhibits significant variations in deformation evolution depending on the size of the unit cells. Smaller unit cells (3, 4 mm) demonstrate a more stable and uniform collapse mode throughout the compression process, which facilitates sustained and effective EA. In contrast, larger unit cells (5, 6 mm) are more susceptible to asymmetric buckling and shear failure, leading to a reduction in EA efficiency. This pattern aligns with the behaviour observed in HEX honeycombs; however, the geometry of REH results in the onset of local buckling at an earlier stage, with the buckling band propagating more rapidly in the radial direction. This suggests that REH may offer advantages during the initial EA phase, although it is prone to local incomplete collapse during the later stages of deep compression due to its unit geometry.
Figure 12 illustrates the EA-time curve and the SEA-time curve for REH honeycomb structures with varying unit cell sizes (3, 4, 5, 6 mm) under vertical impact conditions. The results indicate that the EA capacity of REH honeycombs exhibits a significant increasing trend with progressive compressive deformation, revealing distinct magnitude differences among the four size models. Consistent with HEX honeycombs, smaller unit cells demonstrate superior overall EA capabilities; however, the performance in SEA is influenced by the interplay between mass and the principles governing structural collapse.
Comparison of deformation responses of REH structures with different cell sizes. (
 $a = 3$
, 4, 5, 6 mm) (a) Energy absorption. (b) Specific energy absorption.

The EA curve indicates that REH-3 exhibits the highest performance during the compression process, with its EA peaking at approximately 800–850 J around 4ms. This value is significantly greater than that of other size unit cells. REH-4 closely follows, achieving a final EA of about 600–650 J. In contrast, the EA levels for REH-5 and REH-6 are approximately 250–300 J and 150–200 J, respectively. This gradual decline in EA with increasing unit cell size is primarily attributed to the reduction in the relative density of the honeycomb structure, a decrease in the number of effective buckling units and the overall rotational buckling mode present in the larger unit cells. Notably, during the deep compression stage, the 3 and 4 mm unit cells can activate more local buckling zones, facilitating continuous collapse and thereby effectively absorbing impact energy. The SEA curve further illustrates the EA efficiency of structures of varying sizes. The SEA exhibits a nearly linear growth trend during the initial phase of compression, followed by a rapid increase between 3 and 4 ms, ultimately stabilising at a plateau. In contrast to the EA results, REH-4 demonstrates the highest SEA, reaching approximately 11–12 kJ/kg. Although REH-3 also shows a higher SEA, it is more significantly influenced by its structural mass, achieving around 10–11 kJ/kg. The SEA values for REH-5 and REH-6 are approximately 6–7 and 4–5 kJ/kg, respectively. These findings suggest that the medium unit cell size of 4 mm provides an optimal balance between EA and structural lightweight in REH honeycombs.
The analysis of the deformation modes, as illustrated in Fig. 7, reveals that the REH honeycomb exhibits a gradual expansion of local buckling bands throughout the impact process. Smaller unit cell sizes (3, 4 mm) demonstrate a higher density of buckling units and a more uniform propagation of buckling, leading to enhanced stability in EA during the later stages of compression. Consequently, these smaller unit cells not only increase total EA but also improve SEA performance. In contrast, structures with larger unit cell sizes (5, 6 mm) are more prone to asymmetric shear collapse and the formation of local uncollapsed regions during deep compression, resulting in a marked reduction in SEA efficiency. The REH honeycomb structure exhibits notable variations in EA performance across various unit cell sizes. Specifically, the 3 mm unit cell size demonstrates the highest absolute EA capacity, whereas the 4 mm unit cell size excels in SEA. This pattern aligns with the behaviour of HEX honeycomb structures. However, the unique geometric topology of REH leads to an earlier onset and rapid radial spread of buckling bands, enhancing its efficiency during the initial EA phase. These findings offer valuable insights for establishing the optimal geometric scale of honeycomb buffer structures for aircraft underbellies.
4.3 Effect of unit cell wall thickness
After elucidating the influence of various unit cell sizes on the EA characteristics of honeycomb structures, this article proceeds to examine wall thickness parameters. A more comprehensive analysis of the mechanical properties of two exceptional filling structures, HEX-4 and REH-4, is conducted. Honeycomb wall thickness (t) serves as a critical geometric variable that governs the structure’s relative density, buckling stability and stress levels. Variations in wall thickness directly impact the plastic deformation mode of the honeycomb during the impact process, as well as its EA capacity. To systematically investigate the performance evolution resulting from variations in wall thickness, this study developed eight sets of impact models (two structures × four scales) based on the typical unit cell configurations of HEX and REH. Additionally, four sets of wall thickness parameters were established, as illustrated in Fig. 13,
 $t = 0.2$
, 0.3, 0.4, 0.5 mm. This design encompasses the thin-wall range typically employed in lightweight honeycombs and facilitates a controllable and progressive distribution of changes in the relative density for each wall thickness configuration. Specifically, these values are selected to align with standard aerospace-grade metallic sheet gauges, ensuring that the investigated configurations are representative of manufacturable, heavy-duty energy absorbers capable of providing a stable crushing plateau under high-impact energy.
HEX and REH structures with different cell wall thicknesses. (
 $t = 0.2$
, 0.3, 0.4, 0.5 mm).

The construction of the aforementioned 2 × 4 honeycomb sample set allows for a systematic evaluation of the buckling mode transformation within the honeycomb structure, the growth trend of platform load, and the variations in SEA per unit mass of the honeycomb structure within the three-dimensional design space defined by ‘topology-scale-wall thickness’. This structural family establishes a reliable foundation for subsequent in-depth analyses of the coupling effects of various design factors on impact response. Furthermore, it offers model support for the structural optimisation and quantitative performance evaluation of energy-absorbing filling materials utilised in the lower sections of small aircraft.
Figure 14 illustrates the temporal evolution of EA and SEA for two types of structures with varying wall thicknesses. For the HEX structure, the overall EA capacity exhibits a clear monotonic increase as wall thickness increases. Specifically, when the wall thickness rises from 0.2 to 0.5 mm, the final absorbed energy escalates from approximately 500 J to nearly 1000 J, indicating that increased wall thickness significantly enhances the overall deformation mode and load-bearing capacity of the structure. However, from the perspective of SEA, the increase in wall thickness, which leads to mass growth, results in SEA peaking at 0.2 and 0.3 mm (approximately 12∼13 kJ/kg), followed by a slight decline at 0.4 and 0.5 mm. In contrast, REH structures demonstrate significantly superior EA capabilities compared to HEX across all wall thicknesses. At a wall thickness of 0.5 mm, the final absorbed energy can reach approximately 1,500 J, which is about 40∼50% greater than that of HEX with the same wall thickness. As the wall thickness increases, the SEA value of REH initially rises before subsequently declining. The SEA value for a wall thickness of 0.3 mm is the highest, approximately 12∼13 kJ/kg, indicating that this thickness optimises mass utilisation efficiency while maintaining adequate EA capacity.
Comparison of deformation responses of HEX and REH with different wall thicknesses. (
 $t = 0.2$
, 0.3, 0.4, 0.5 mm). (a) Energy absorption of HEX. (b) Specific energy absorption of HEX. (c) Energy absorption of REH. (d) Specific energy absorption of REH.

Analysis of multiple indicators, including EA, SEA and structural deformation stability, indicates that the optimal wall thickness for the HEX structure is 0.3 mm. This thickness achieves a relatively balanced performance in terms of EA capacity and mass efficiency. Similarly, for the REH structure, a wall thickness of 0.3 mm provides the best balance between SEA and overall EA. Although a thickness of 0.4 mm results in a greater mass, it offers advantages in scenarios with extreme EA demands. Overall, under identical wall thickness conditions, the EA efficiency of the REH structure significantly surpasses that of the HEX structure, demonstrating superior lightweight EA potential.
5.0 Conclusion
This study focused on the bottom buffering requirements for small aircraft and helicopters during landing impact scenarios. It involved the structural design and performance evaluation of a honeycomb energy-absorbing layer tailored to the arc-shaped fuselage. By embedding honeycomb unit cells into the curved surface of the fuselage, these cells can effectively engage in the load-bearing process during the initial stages of loading. This engagement enhances both the EA efficiency and the stability of the collapse mode of the structure. The principal conclusions are as follows:
-
(1) This study introduces a configuration method for a non-traditional honeycomb energy-absorbing structure. This approach extends the application of honeycomb materials from conventional flat filling to a curved surface that adapts to body shapes, thereby achieving a geometrically integrated design of energy-absorbing materials and the overall aircraft structure.
-
(2) The paper concurrently examines two representative filling structures: standard HEX and REH. A systematic parameter design space defined by ‘topology, unit cell size and wall thickness’ was established. Through a comprehensive comparison of unit cell scales (3∼6 mm) and wall thicknesses (0.2∼0.5 mm), this study elucidates the rules governing buckling evolution and the mechanisms of energy dissipation in honeycomb structures across various geometric scales.
-
(3) Through a comprehensive analysis of the EA curves and transient deformation characteristics of honeycomb structures with varying wall thicknesses, this study identifies the optimal performance range for HEX and REH. Notably, the REH structure exhibits superior performance across all parameter combinations. Specifically, a wall thickness of 0.3 mm combined with a smaller unit cell size yields the highest SEA, while a wall thickness of 0.4 mm demonstrates the greatest ultimate EA capacity.
Acknowledgments
The authors acknowledge the financial support from the National Natural Science Foundation of China (No. 52172356) and the State Key Laboratory of Advanced Design and Manufacturing Technology for Vehicle (No. 72475015).
Competing interests
The authors declare none.



 a=3

 a=3

 a=3

 a=3

 t=0.2

 t=0.2


