1. Introduction
Structural aureoles around plutons have been geometrically defined in several places and restricted to the volume of the wall rocks affected by syn-emplacement deformation (e.g. Cruden, Reference Cruden1988; Paterson, Vernon & Fowler, Reference Paterson, Vernon, Fowler and Kerrick1991), and frequently by folding (e.g. Marko & Yoshinobu, Reference Marko and Yoshinobu2011). Analogue models and field studies, related to plutons emplaced at intermediate and upper crustal levels, argue that pre-existing structures (i.e. strata and foliation surfaces) in the country rocks adjacent to pluton sides are deformed with the generation of rim folds having hinge lines concordant with the intrusive contact (e.g. Ramberg, Reference Ramberg, Newall and Rast1970; Dixon, Reference Dixon1975; Schwerdtner, Reference Schwerdtner1990; Cruden, Sjöström & Aaro, Reference Cruden, Sjöström, Aaro, Castro, Fernandez and Vigneresse1999; Hippertt & Davis, Reference Hippertt and Davis2000; Miller & Paterson, Reference Miller and Paterson2001; Paterson & Farris, Reference Paterson and Farris2008; Marko & Yoshinobu, Reference Marko and Yoshinobu2011). It was proposed that such rim folds respond to the component of lateral expansion of the pluton or to the component of vertical movement of magma or the pluton in relation to the wall rocks. In the case of the lateral expansion of the pluton, a series of synforms and antiforms may be generated by the shortening taking place during the forceful emplacement of the magma (e.g. Lagarde, Ait Omar & Roddaz, Reference Lagarde, Omar and Roddaz1990; Schwerdtner, Reference Schwerdtner1990; Paterson, Fowler & Miller, Reference Paterson, Fowler and Miller1996; Tikoff, de Saint Blanquat & Teyssier, Reference Tikoff, de Saint Blanquat and Teyssier1999; Marko & Yoshinobu, Reference Marko and Yoshinobu2011).
A component of upward movement of the magma may be responsible for the genesis of a rim synform. This is the case for the diapiric ascent of magma (e.g. Dixon, Reference Dixon1975; Cruden, Reference Cruden1990; He, Xu & Paterson, Reference He, Xu and Paterson2009) and also for roof doming produced during the building of laccoliths (e.g. Gilbert, Reference Gilbert1877; Corry, Reference Corry1988; Jackson & Pollard, Reference Jackson and Pollard1988; de Saint Blanquat et al. Reference Saint Blanquat, Habert, Horsman, Morgan, Tikoff, Launeau and Gleizes2006). A concave-up bending is also generated in wall rocks adjacent to the top flanks of hybrid tabular plutons that grow both downwards and upwards (Cruden, Reference Cruden, Brown and Rushmer2006).
A component of downward movement of the pluton or magma may be responsible for the genesis of a rim antiform, resulting in the deflection of pre-emplacement fabrics, which steeply dip towards the pluton margins. This pattern, reflecting the host rock dragging, has been related to: (i) the sinking of the pluton due to gravity instability as a result of post-emplacement density increase during magmatic crystallization (Glazner & Miller, Reference Glazner and Miller1997); (ii) the pluton growth by the mechanism of floor depression (Cruden, Reference Cruden, Brown and Rushmer2006); and (iii) syn-emplacement gravitational roof collapse and channel flow along margins (Paterson & Farris, Reference Paterson and Farris2008).
The syn-emplacement folding of the country rocks can be accompanied by the development of cleavages and micro-scale crenulations (e.g. Paterson & Tobisch, Reference Paterson and Tobisch1992; Tikoff, de Saint Blanquat & Teyssier, Reference Tikoff, de Saint Blanquat and Teyssier1999). Analysis of these structures allowed the calculation of strain rates in the order of 10−13 s−1 or higher (Paterson & Tobisch, Reference Paterson and Tobisch1992), in accordance with estimates based on the magma feeding rate through dykes (Johnson, Albertz & Paterson, Reference Johnson, Albertz and Paterson2001).
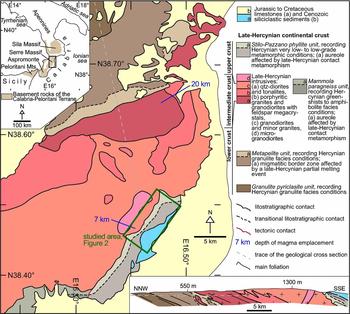
In this paper we analyse a well-exposed contact metamorphic aureole, developed on metasedimentary Palaeozoic rocks of the Hercynian upper crust in Calabria, Italy. The aureole can be followed for about 30 km rimming the southeastern margin of the Late Carboniferous Serre batholith (Fig. 1). Here, similarly to other situations (e.g. Glazner & Miller, Reference Glazner and Miller1997; Paterson & Farris, Reference Paterson and Farris2008), wall rocks show steep dips of the regional Hercynian foliation towards the intrusive contact. This pattern has been interpreted as evidence for the presence of an antiform with an axis nearly parallel to the intrusive contact for the length of the aureole (e.g. Marchetti et al. Reference Marchetti, Sargent, Bayliss, Davies, Chiarini, Gioria and Manmana1967; Fig. 1). However, the shape of this rim fold has been poorly constrained since way-up criteria in the limbs are lacking and the geometry of the hinge zone is not defined, leaving space for alternative interpretations. In addition, genetic considerations are lacking, and thus the origin of the fold and its connection to magma emplacement and pluton growth is until now unknown. For these reasons, in this paper we analyse structural and petrological features of the aureole and focus the study on rocks belonging to the Stilo-Pazzano phyllite unit (Fig. 1) that records the effects of both thermal metamorphism and deformation. Constraining the geometry of the fold adjacent to the intrusive contact, syn-emplacement deformation in the structural aureole and peak metamorphism in the thermal aureole are objectives of this paper. They are of critical importance for defining time–space relationships between structural and metamorphic aureoles and ultimately to give some hints about the mechanisms of magma emplacement in the upper crust.
Geological sketch map and cross-section of the Serre Massif (modified after Borsi et al. Reference Borsi, Merlin, Lorenzoni, Paglionico and Zanettin-Lorenzoni1976; Caggianelli, Prosser & Rottura, Reference Caggianelli, Prosser and Rottura2000; Festa et al. Reference Festa, Messina, Paglionico, Piccarreta and Rottura2004). Palaeodepths of magma emplacement are indicated according to Caggianelli, Prosser & Rottura (Reference Caggianelli, Prosser and Rottura2000) and Festa et al. (Reference Festa, Di Battista, Caggianelli and Liotta2003). The investigated area shown in detail in Figure 2 is outlined with a frame.

2. Geological setting
In the cross-section of late-Hercynian continental crust exposed in the Serre Massif (Schenk, Reference Schenk1980; Fig. 1) the intermediate level is mainly made up of calc-alkaline granitoids belonging to the Serre batholith, ranging in composition from tonalite to granite with minor mafic bodies. The crustal section is nearly completely exposed owing to Tertiary tectonics, responsible for a tilting of about 40° to the SE (Festa et al. Reference Festa, Di Battista, Caggianelli and Liotta2003). Emplacement and growth of the granitoid stack took place sometime between 290 and 300 ± 10 Ma (Schenk, Reference Schenk, Daly, Cliff and Yardley1989) at depths of between 20 and 7 km (Caggianelli, Prosser & Rottura, Reference Caggianelli, Prosser and Rottura2000; Festa et al. Reference Festa, Di Battista, Caggianelli and Liotta2003). The shallower granitoids are represented mostly by granodiorites and to a minor extent by granites (Borsi et al. Reference Borsi, Merlin, Lorenzoni, Paglionico and Zanettin-Lorenzoni1976; Fornelli et al. Reference Fornelli, Caggianelli, Del Moro, Bargossi, Paglionico, Piccarreta and Rottura1994), all characterized by a nearly isotropic magmatic fabric. Magmas intruded mainly into the low-grade Stilo-Pazzano phyllite unit and, in the southwestern sector, also into the medium-grade Mammola paragneiss unit (Colonna, Lorenzoni & Zanettin-Lorenzoni, Reference Colonna, Lorenzoni and Zanettin-Lorenzoni1973; Angì et al. Reference Angì, Cirrincione, Fazio, Fiannacca, Ortolano and Pezzino2010; Fig. 1). Hercynian tectonics was responsible for juxtaposition of these two units, subsequently affected by the emplacement of granodiorite magma (Colonna, Lorenzoni & Zanettin-Lorenzoni, Reference Colonna, Lorenzoni and Zanettin-Lorenzoni1973).
The phyllites derive from a sedimentary succession of Ordovician–Carboniferous age including pelite, siltstone, arenite, limestone and radiolarite with intercalations of mafic lavas. Magma composition shifted with time from tholeiitic to alkaline affinity. A detailed description of the Palaeozoic sedimentary succession is provided by Boullin et al. (Reference Bouillin, Majesté-Menjoulas, Baudelot, Cygan and Fournier-Vinas1987) and by Acquafredda, Lorenzoni & Zanettin-Lorenzoni (Reference Acquafredda, Lorenzoni and Zanettin-Lorenzoni1994). According to Colonna, Lorenzoni & Zanettin-Lorenzoni (Reference Colonna, Lorenzoni and Zanettin-Lorenzoni1973), a relict sedimentary layering is still recognizable in the phyllites, which were affected by two main dynamic phases during Carboniferous regional metamorphism. Later, contact metamorphism promoted blastesis of biotite, andalusite and cordierite within an aureole several hundreds of metres wide (Colonna, Lorenzoni & Zanettin-Lorenzoni, Reference Colonna, Lorenzoni and Zanettin-Lorenzoni1973; Acquafredda, et al. Reference Acquafredda, Lorenzoni, Minzoni and Zanettin-Lorenzoni1987). Wall rocks adjacent to the contact with granodiorite are hornfels to spotted schist, often injected by granitoid dykes as well as by veinlets filled by hydrothermal quartz (Colonna, Lorenzoni & Zanettin-Lorenzoni, Reference Colonna, Lorenzoni and Zanettin-Lorenzoni1973).
3. Structure of the host rock
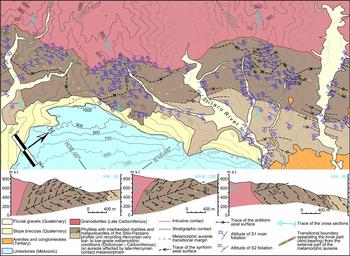
In the study area (Fig. 2), granodiorite belonging to the Serre batholith shows a clear magmatic texture with an absent or very weak preferred orientation of feldspars and biotite. The intrusive contact with the host rock, here represented by the Stilo-Pazzano phyllite unit, strikes NE–SW. The Stilaro River marks the transition between opposite dips of the contact: southwestward, it dips 45–50° to the NW; northeastward, a dip of ~ 60° to the SE is observed (Fig. 2). Decimetre- to metre-thick granodioritic and pegmatitic dykes (Fig. 3a) are diffusely present within the host rock close to the margin of the batholith, making up a typical injection zone.
Geological map of the southeastern sector of the Serre Massif and cross-sections (see Figure 1 for the location of the studied area).

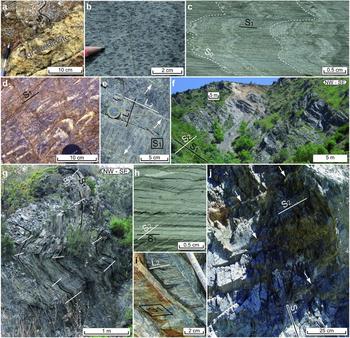
(a) Decimetre-thick granodioritic dyke within the host rock close to the margin of the batholith. Note the high angle between S1 of the host rock and the straight margin of the dyke. (b) Spotted schist. (c) S1 foliation in phyllite is parallel to axial plane of folds affecting S0 layering (scanned thin-section). (d) Isoclinal, intrafolial folds enveloped by the S1 foliation in phyllite. (e) L1 evidenced by the alignment of stretched quartz grains on the S1 surface in phyllite. The lineation (subparallel to L2 and indicated by white arrows) produced by intersection of quartz veinlets (see also part j) and S1 surfaces can be observed as well. (f) Panoramic view of a phyllite outcrop where a southeastward dip of S1 can be observed. The macroscopic aspect of the northwestward-dipping S2 foliation is also shown. (g) Outcrop-scale folds of S1 in phyllite; axial plane S2 foliation dips towards the NW. (h) S2 crenulation cleavage in phyllite (scanned thin-section). (i) Crenulation lineation L2 on the S1 surface. (j) Centimetre-thick veinlets of quartz (indicated by white arrows), nearly parallel to the S2 cleavage.

The thermal aureole is oriented roughly parallel to the intrusive contact, with a nearly constant width that reaches a maximum value of ~ 1800 m estimated on geological sections (Fig. 2). In the aureole, spotted schists are the most common rock type produced by thermal metamorphism (Fig. 3b). An increase in spot size is observed towards the intrusive contact and true hornfels locally appears in zones very close to the granodiorite.
A relict sedimentary layering (S0) is still recognizable in the phyllites and in the outer part of the contact aureole both at the outcrop scale and in thin-section (Fig. 3c). In most cases it is evidenced by millimetre-thick layers of detrital quartz and feldspar interposed in the truly pelitic layers. S0 was then affected by folding that produced isoclinal and intrafolial folds (Fig. 3c, d) together with a pronounced continuous S1 foliation and a poorly developed L1 lineation, as a result of the first deformation event (D1). In sites where L1 is visible, it is mostly evidenced by an alignment of stretched quartz grains on S1 (Fig. 3e). The S1 cleavage dips regionally southeastwards (Figs. 2, 3f). Interestingly, within a distance of 700 m from the intrusive contact of the granodiorite, the S1 cleavage dips generally towards the NW (Fig. 2). Here, granodioritic dykes of the injection zone in some cases cut the S1 at high angles (Fig. 3a).
The presence of an S2 foliation and an L2 lineation indicates a second deformation event (D2). S2 can be locally observed with a dip towards the NW (Fig. 3f, g). At the outcrop scale the orientation of S2 is subparallel to the axial plane of folds affecting the S1 foliation (Fig. 3g). At the thin-section scale, S2 is a crenulation cleavage (Fig. 3h). Hinge lines of microfolds, well developed in S1, form a L2 crenulation lineation related to the same deformation event (Fig. 3i). In the aureole, these features tend to vanish on approaching the intrusive contact and only millimetre- to centimetre-thick veinlets of quartz, nearly parallel to the S2 cleavage, occur (Fig. 3j). Accordingly, the intersection of quartz veinlets and S1 surfaces locally produces an intersection lineation, marked by the presence of quartz transecting L1 at a high angle (Fig. 3e).
From a geometrical point of view, S1 and S2 may occur with opposite or with similar dip directions. The first situation is observed when S1 dips towards the SE. This occurs both regionally (e.g. Fig. 3f) and locally, on the southeastwards dipping limbs of outcrop-scale folds (e.g. Fig. 3g). The second situation is observed when both foliations dip towards the NW. Interestingly, in this case S2 is systematically less inclined with respect to S1. This occurs in the portion of the aureole located in the neighbourhood of the granodiorite and on the northwestwards dipping limbs of outcrop-scale folds (e.g. Fig. 3g). These geometrical relationships are consistent with the presence of a major overturned synform (Fig. 2). The trace of the fold axial plane separates the inverted NW-dipping limb from the upright SE-dipping limb (Fig. 2). The interlimb angle is about 90°, as is typical of an open fold.
From the geological map and the cross-sections (Fig. 2) it can be seen that the intrusive contact crosses the fold axial plane and is adjacent to both the overturned and the upright limbs of the synform. This is particularly evident along the Stilaro River (Fig. 2), where the intrusive contact changes from a northwestward to southeastward dip.
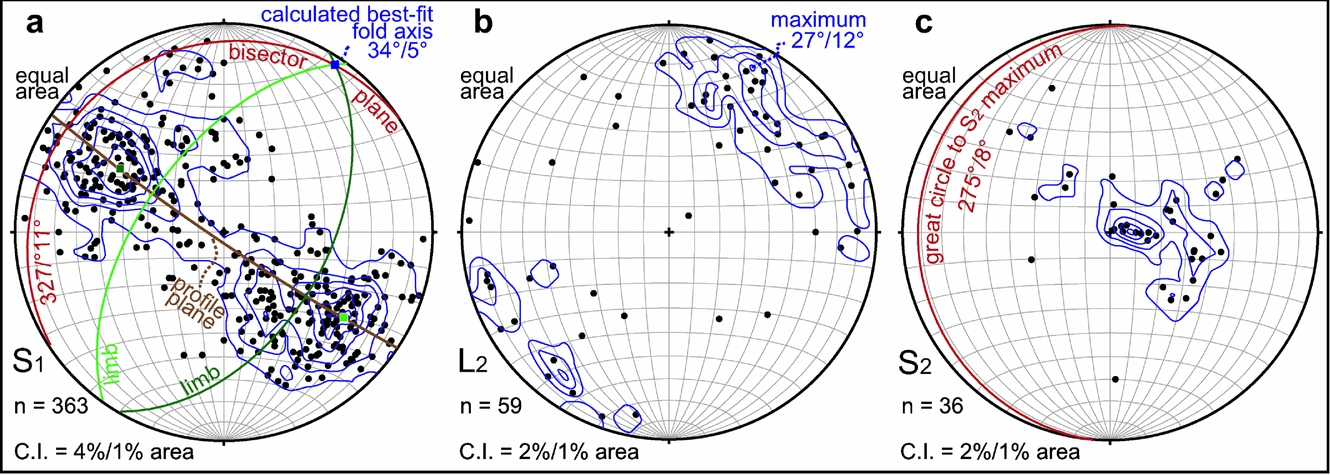
The geometry of the synform can be better constrained from the diagrams of Figure 4. The poles to the S1 cleavage show two main concentrations, with some scattering of datapoints possibly related to later deformation events (Fig. 4a). The two concentrations are consistent with the northwestwards and southeastwards dipping limbs of the synform and the related parasitic folds (e.g. Fig. 3g). The calculated best-fit fold axis of 34°/5° (dip azimuth/plunge; Fig. 4a) for this major synform shows an orientation comparable with that of the L2 lineation, having a maximum concentration at 27°/12° (Fig. 4b). Data used to construct the diagram of Figure 4b are mostly represented by crenulation hinge lines (e.g. Fig. 3i) and to a lesser amount by intersection lineations between S1 and quartz veinlets (e.g. Fig. 3e, j). Furthermore, some geometric concordance also exists between the S2 cleavage (great circle to the S2 maximum; Fig. 4c) and the calculated plane bisecting the interlimb angle of the major synform (Fig. 4a). Such a plane, having a strike nearly parallel to L2 (Fig. 4b), may be considered representative of the axial plane of the major synform (Fig. 2).
(a) Stereographic projection of poles to S1 foliation within the Stilo-Pazzano phyllite unit; the fold limbs of the large-scale synform, the bisector plane and calculated best-fit fold axis are indicated. (b) Stereographic projection of the L2 lineation. (c) Stereographic projection of the poles to the S2 cleavage; the great circle to the S2 maximum is indicated. Equal area projection, lower hemisphere. The data were processed with Stereonet 6.3.2 X by Allmendinger (Reference Allmendinger2004).

4. Relationships between mineral blastesis and deformation within the host rock
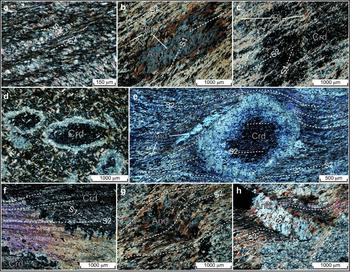
The phyllites of the host rock contain a mineral assemblage of fine-grained sericite + quartz + plagioclase ± chlorite. At the thin-section scale it is a continuous S1 cleavage, mainly defined by sericite and secondly by chlorite. S1 is still recognizable within plagioclase + quartz enriched microlithons bounded by spaced S2 cleavage domains (Fig. 5a). Blastesis of sericite and chlorite occurred during the D1 deformation event, under subgreenschist metamorphic conditions. The cleavage domains, located in the flanks of asymmetric microfolds of the earlier S1 foliation, are characterized by an enrichment of sericite, with flakes preferentially oriented along the S2 foliation (Fig. 5a). Differentiation between cleavage domains and microlithons, although not fully developed (Fig. 5a), is related to formation of crenulation and solution transfer mechanisms. Grains of quartz, and to a minor extent of plagioclase and chlorite, were dissolved from the limbs and then precipitated from solutions in the hinges of microfolds. During this D2 event the sericite flakes rotated and acquired a preferred orientation along microfold limbs under temperatures lower than those of the D1 event.
Thin-section micrographs (crossed polars) of phyllite (a) and spotted schists (b–h). (a) S1 cleavage within microlithons bounded by spaced S2 crenulation cleavage domains. (b) Post-kinematic porphyroblast of andalusite (And). Note well-aligned biotite (Bt) flakes along S1 and S2 foliations in the matrix and within andalusite. (c) Post-kinematic porphyroblast of cordierite (Crd). The aligned biotite inclusions are significantly smaller with respect to those found in the andalusite of (b). (d) Spots of cordierite with both irregular and sub-elliptical shape showing bright overgrowths. (e) Ellipsoidal spot of cordierite with bright overgrowth enclosing the S2 foliation. The deflection of the latter foliation in the matrix and the presence, in the left strain shadow, of two elongated crystals of andalusite oriented along the S2 foliation can be observed. (f) A slight difference in the orientation of S2 is visible between internal and external foliations across the margins of cordierite spots. (g) Syn-kinematic porphyroblast of andalusite overprinting the S2. A larger spacing of the internal foliation with respect to that of the external foliation can be noted. (h) Syn-kinematic porphyroblast of andalusite. A rotation of the internal S2 foliation with respect to the external S2 foliation can be observed.

Three main mineral phases, i.e. biotite, cordierite and andalusite, represent the effect of thermal metamorphism, which involved the phyllite in the contact aureole, for a maximum thickness of 1800 m.
Biotite laminae are well aligned along S1 and S2 foliations, in the matrix and as inclusions inside andalusite (Fig. 5b) and cordierite (Fig. 5c) porphyroblasts. This pattern may suggest that biotite crystallization mostly took place mimetically at the expense of sericite and chlorite, and post-tectonically with respect to both the D1 and D2 deformation events. However, we cannot exclude that biotite also crystallized during the late stages of the D2 event.
Clumps of biotite flakes form small spots only in the outer part of the contact aureole. For the rest of the aureole, spots are mostly formed by cordierite. They are characterized by irregular or sub-elliptical geometry and increase in size approaching the intrusive contact where they are about 1 cm across. In the coarser spots, overgrowths can be clearly observed, probably related to distinct episodes of cordierite formation (Fig. 5d, e). Cordierite spots overprint S1 and in most cases also S2, being essentially post-tectonic with respect to the D1 and D2 deformation events. However, some observations indicate that cordierite formation also occurred syn-tectonically during the latest stages of the D2 event. Examples in favour of this interpretation are: (i) a deflection of S2 around the ellipsoidal spots and a planar pattern of S2 inside the spots (Fig. 5e); (ii) a slight difference in orientation of S2 across the spot margins (Fig. 5f); and (iii) a reduced spacing of S2 in the matrix compared with S2 spacing within the spots (Fig. 5f).
The observations related to andalusite porphyroblasts are similar to those for cordierite spots. S1 and S2 foliations are clearly overprinted by andalusite (e.g. Fig. 5b) suggesting that this mineral grew mostly post-tectonically with respect to the D1 and D2 deformation events. However, even for andalusite there is some evidence in favour of syn-tectonic growth during the late stages of D2 deformation, such as: (i) andalusite, located in the strain shadow of cordierite, showing an elongated shape and preferentially oriented along the deflected S2 foliation (Fig. 5e); (ii) andalusite including a slightly curved S2, characterized by a different orientation with respect to the matrix (Fig. 5g); and (iii) S2 spacing within andalusite, gradually reducing out of the porphyroblast (Fig. 5g, h).
Summing up, S1 and S2 foliations developed in the phyllite during the D1 and D2 deformation events, respectively, in both cases under subgreenschist conditions. In the contact aureole, microstructural observations indicate that the main mineral phases related to thermal metamorphism appeared in the following temporal sequence: biotite, cordierite and andalusite. Although these minerals mainly grew post-tectonically with respect to the D1 and D2 deformations, some microstructural evidence suggests that they grew during the late stages of the D2 deformation event.
5. Reactions and P–T estimates in the contact aureole
Three distinctive mineral phases related to thermal metamorphism, i.e. biotite, cordierite and andalusite, appear sequentially in the contact aureole, approaching the granodiorite. The biotite zone is very narrow and not easy to discriminate from the following cordierite zone in the field. Nonetheless, we indicate the possible reactions responsible for the genesis of the three distinctive minerals (abbreviations follow Siivola & Schmid, Reference Siivola and Schmid2007).
Biotite. In pelites that lack K-feldspar, biotite may be formed through the continuous reaction (Yardley, Reference Yardley1989):
 \begin{equation}
{\rm Phg + Chl } \to {\rm Bt + Phg - poor\; Ms + Qtz + H}_{\rm 2} {\rm O}\end{equation}
Cordierite. Cordierite appears as a typical index mineral through the KFMASH divariant reaction (Pattison & Vogl, Reference Pattison and Vogl2005):
 \begin{equation}
{\rm Chl + Ms + Qtz } \to {\rm Crd + Bt + H}_{\rm 2} {\rm O}\end{equation}
This reaction is considered responsible for the production of the first cordierite spots, approaching the intrusive contact.
Andalusite. Andalusite can theoretically form through a reaction similar to (2a) in relatively Fe-rich rocks (Pattison & Vogl, Reference Pattison and Vogl2005):
 \begin{equation}
{\rm Chl + Ms + Qtz } \to {\rm And + Bt + H}_{\rm 2} {\rm O}\end{equation}
In this case, andalusite can coexist with biotite but not with cordierite, a situation not found in the studied contact aureole. Andalusite develops at low pressures in most pelite compositions as a result of the KFMASH univariant reaction (Pattison & Vogl, Reference Pattison and Vogl2005):
 \begin{equation}
{\rm Chl + Ms + Qtz } \to {\rm Crd + And + Bt + H}_{\rm 2} {\rm O}\end{equation}
This reaction represents the upper chlorite thermal limit in muscovite-quartz schists and results in its disappearance from the AFM diagram (Spear, Reference Spear1993). It can be also responsible for a second generation of cordierite at higher temperatures, as witnessed by the overgrowths around the coarser spots (Fig. 5d, e).
A further reaction responsible for andalusite growth in chlorite-free rocks is (Pattison et al. Reference Pattison, Spear, Debuhr, Cheney and Guidotti2002):
 \begin{equation}
{\rm Ms + Crd } \to {\rm And + Bt + Qtz + H}_{\rm 2} {\rm O}\end{equation}
Pattison et al. (Reference Pattison, Spear, Debuhr, Cheney and Guidotti2002) suggested detailed microstructural criteria to recognize the operation of reaction (4). Reciprocal inclusion relationships are lacking in rocks from the studied aureole; however, some observations indicate that andalusite partially formed late with respect to cordierite through reaction (4). In fact, andalusite crystals can be found with an elongated shape and preferentially oriented along the deflected S2 foliation in the strain shadow of cordierite spots (e.g. Fig. 5e). Moreover, biotite inclusions in andalusite porphyroblasts (Fig. 5b) are significantly larger than biotite flakes included in cordierite spots (Fig. 5c).
Distribution of mineral assemblages and microstructural features in the thermal aureole are thus consistent with the sequential crossing of reactions (1), (2a), (3) and (4). Rocks sampled in the proximity of the contact reached chlorite-out conditions beyond reaction (3), in the stability field of the cordierite + biotite + andalusite assemblage. Pressure–temperature (P–T) values required to form sillimanite and K-feldspar at the expense of andalusite and muscovite, respectively, were never achieved. Therefore, the upper thermal boundaries for the peak assemblage are defined by the And–Sil equilibrium and by the Ms-out reaction in the KASH system (Spear, Reference Spear1993):
 \begin{equation}
{\rm Ms + Qtz } \to {\rm And + Kfs + H}_{\rm 2} {\rm O}\end{equation}
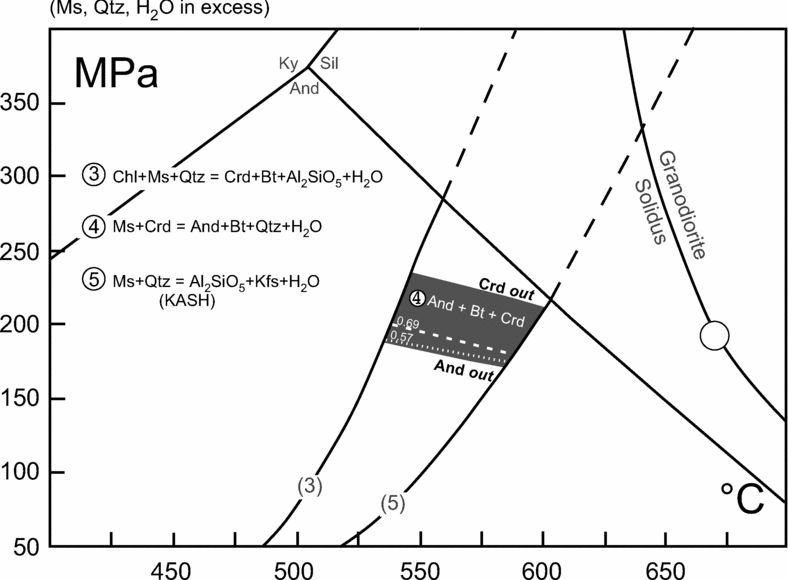
Based on these considerations, the field of peak metamorphism can be delineated in the P–T plot, once the slope and the position of reaction (4) is defined. Thermodynamic modelling of reaction (4) has been done by Pattison et al. (Reference Pattison, Spear, Debuhr, Cheney and Guidotti2002). They provided strong evidence that the divariant reaction slides in the P–T diagram with a slightly negative slope between the Chl-out (3) and Ms-out (5) reactions. Using the Gibbs software (version 2009; thermodynamic dataset by Spear et al. Reference Spear, Pattison and Cheney2000), it is possible to outline the P–T window where reaction (4) takes place for a specific bulk rock composition (Fig. 6).
Diagram showing P–T conditions for the And + Crd + Bt peak assemblage in the studied thermal aureole. The field (in grey) for the peak assemblage in the KFMASH system was defined using the Gibbs software (version 2009, dataset of Spear, Pattison & Cheney, Reference Spear, Pattison and Cheney2000) based on the Holdaway (Reference Holdaway1971) And–Sil–Ky equilibrium, for rock compositions in Table 1 (A = 0.31; XFe = 0.62). The field of the peak association is limited by the stability of cordierite (upwards) and andalusite (downwards). XFe isopleths of 0.69 and 0.57 for Bt (dashed line) and Crd (dotted line), respectively, allow the constraint of the window of P–T conditions for peak metamorphism (P = 175–200 MPa; T = 535–590°C). The granodiorite solidus is taken from Schmidt & Thompson (Reference Schmidt and Thompson1996). The circle on the solidus curve located at 190 MPa and 670°C represents the P–T value obtained by igneous thermobarometry. P–T errors related to this estimate are ± 60 MPa and ± 40°C.

Generally, the window slides to lower pressures as XFe and molecular Al content increase. For the studied case we used the average composition of the Stilo phyllites or, alternatively, a sample of hornfels, since they exhibit very similar AFM values (Table 1). On this basis, the peak assemblage may be achieved at pressures between 170 and 230 MPa.
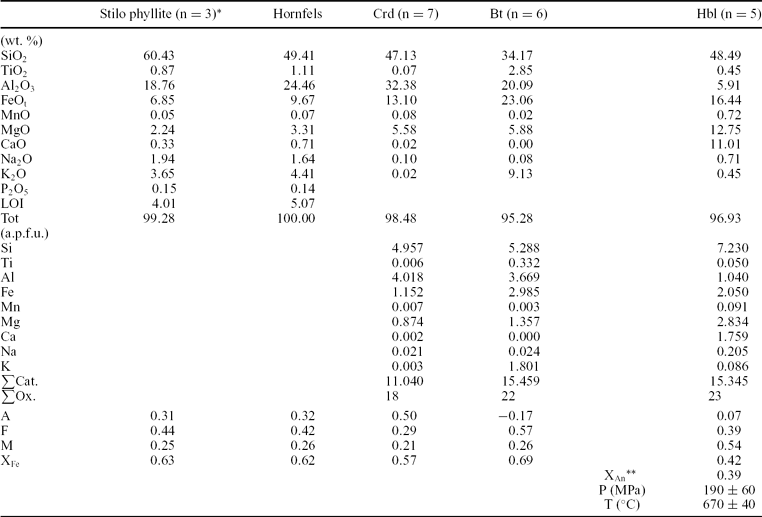
Chemical compositions of rocks and minerals used for P–T estimates

Cordierite (Crd) and biotite (Bt) compositions are from the hornfels whereas hornblende (Hbl) composition, determined uniquely in rim portions, is from granodiorite.
Analysis of the hornfels was performed by a Philips PW1480 XRF spectrometer. X-ray counts were converted to wt.% oxides by a software based on the correction of matrix effects according to the procedure described by Franzini, Leoni & Saitta (Reference Franzini, Leoni and Saitta1975).
Mineral analyses were performed by a S360 Cambridge Scanning Electron Microscope (SEM), coupled with an Oxford-Link Ge ISIS Energy Dispersive Spectrometer (EDS). Operating conditions of the SEM were: 15 kV accelerating potential, 1 nA probe current, 2500 cps as average count rate on the whole spectrum of the cobalt standard and a counting time of 100 s. X-ray intensities were converted to wt.% oxides by ZAF4/FLS quantitative analysis software support provided by Oxford-Link Analytical (UK).
*Average Stilo phyllite composition is from Acquafredda et al. (Reference Acquafredda, Fornelli, Micheletti, Piccarreta and Sassi2003).
**Anorthite content (XAn) in the rim of plagioclase from granodiorite used for the simultaneous solution of the amphibole–plagioclase thermometer by Holland & Blundy (Reference Holland and Blundy1994) and Al-in-hornblende barometer in the revision by Anderson & Smith (Reference Anderson and Smith1995).
To further constrain peak P–T conditions for the hornfels we used the compositions of biotite and cordierite in terms of XFe. Mean values are 0.69 and 0.57, respectively, and related isopleths traced with the Gibbs software are shown in Figure 6. They have a small slope, being more sensitive to pressure than to temperature, and cross the P–T window outlined before in the lower part. In particular, the cordierite isopleth indicates slightly lower pressures with respect to the biotite isopleth. Taken together, they allow us to bracket the range of peak conditions at temperatures from 535 to 590°C and pressures from 175 to 200 MPa.
The crustal level of contact metamorphism has been confirmed by estimating the depth of granodiorite emplacement through igneous thermobarometry. The Al-in-hornblende barometer revised by Anderson & Smith (Reference Anderson and Smith1995), together with the amphibole–plagioclase thermometer (edenite–tremolite) by Holland & Blundy (Reference Holland and Blundy1994), were adopted. The mineral assemblage of the granodiorite, including also biotite, sphene, ilmenite, apatite and zircon, is adequate for the application of the Al-in-hornblende barometer (Hammarstom & Zen, Reference Hammarstom and Zen1986). By this method, an average pressure of 190 MPa at a temperature of 670°C was estimated, very close to the granodiorite solidus (Schmidt & Thompson, Reference Schmidt and Thompson1996). This indicates that a depth estimate of 7.3 km can be deduced for the late stage of magmatic crystallization and therefore for the emplacement level.
6. Discussion
6.a. Connection of the rim fold to granodiorite emplacement in the upper crust
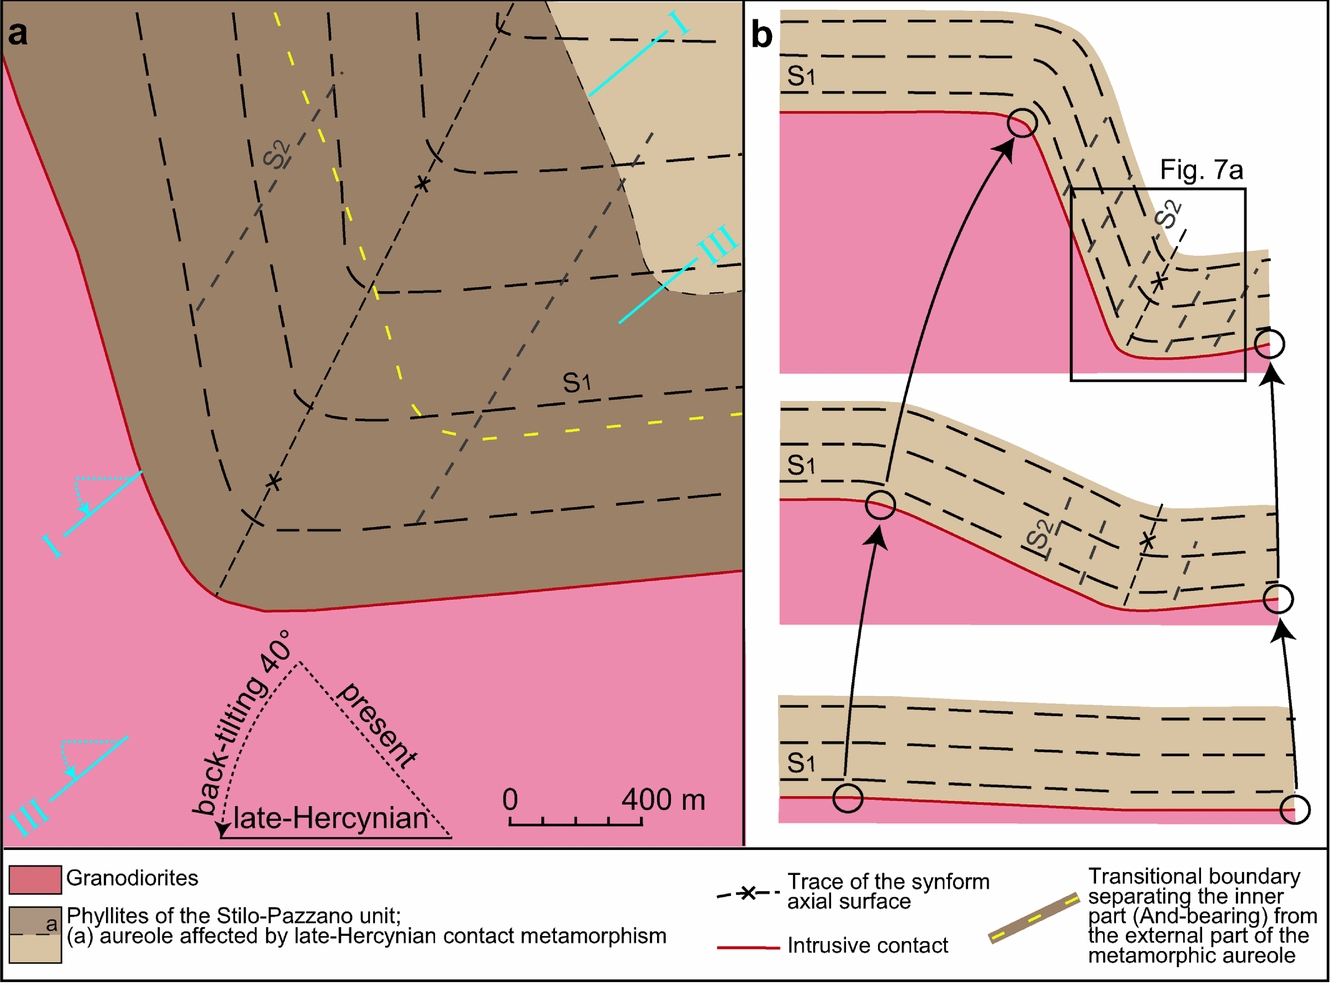
Structural analysis of the contact aureole of the Serre batholith allowed us to recognize a kilometre-scale synform rimming the intrusive contact for at least 20 km. This is in contrast with previous interpretations (e.g. Marchetti et al. Reference Marchetti, Sargent, Bayliss, Davies, Chiarini, Gioria and Manmana1967) implying the presence of an antiform. Parallelism of the fold hinge to the intrusive contact strongly suggests that the genesis of the synform is related to magma emplacement in the upper crust. In order to define the original geometry of the rimming synform, restoration of the crustal section before Tertiary tilting (Festa et al. Reference Festa, Di Battista, Caggianelli and Liotta2003) is required. In Figure 7a the restored geometry is characterized by an axial plane dipping steeply towards the intrusion. A nearly vertical fold limb flanks the pluton margin, whereas the opposite limb has an approximately horizontal attitude. Coherent with field observations, the intrusive contact is nearly concordant to the folded S1. The cartoons in Figure 7b show in three stages the possible evolution of the synform during the intrusion of the granodiorite in the upper crust. It also illustrates the development of the S2 cleavage (parallel to the axial plane of the main synform) during syn-intrusive folding.
(a) Sketch illustrating the geometry of the rimming synform after restoration of the Tertiary tilting. Reconstruction is based on geological sections I and III of Figure 2; the yellow dashed line indicates the boundary between the inner (And+Bt+Crd) and outer aureole. (b) Cartoons illustrating the possible genesis of the rimming synform shown in (a) (inset), resulting from progressive bending of the metapelite wall rocks during the intrusion of the granodiorite magma in the upper crust. Reference points (circles) are used to illustrate the possible shortening amount.

The presence of a rimming synform may be compatible with either diapiric or laccolith-like emplacement of the granodiorite. Diapiric emplacement seems unlikely, because the Serre batholith was formed by a stack of tabular intrusions (Caggianelli & Prosser, Reference Caggianelli and Prosser2002), which typically originate by means of laccolith, lopolith or hybrid modes of emplacement (Cruden, Reference Cruden1998, Reference Cruden, Brown and Rushmer2006). In addition, the restored geometry of the rimming synform is more compatible with a laccolith-like intrusion, rather than with diapiric emplacement, which is frequently characterized by the presence in the wall rocks of closed to tight folds produced by upward viscous drag and by return flow (e.g. He, Xu & Paterson, Reference He, Xu and Paterson2009).
Laccoliths are generally related to a shallow depth of intrusion (<3 km according to Corry, Reference Corry1988), but emplacement of laccolith-like bodies at a depth comparable with that of the Serre granodiorite (about 7.0–7.5 km) has already been described (6.4–9.2 km in Morgan, Law & Nyman, Reference Morgan, Law and Nyman1998). For the studied case, a relatively deep emplacement was probably conditioned by the large size of the Serre granodiorite pluton (Fig. 1). This hypothesis is supported by the positive correlation between level of intrusion and diameter of the laccolith established by Gilbert (Reference Gilbert1877) and more recently reported by Pollard & Fletcher (Reference Pollard and Fletcher2005). A laccolith-like mode of emplacement created some space at the top of the granitoid stack, favoured by the ‘effect of lithology’ (Pitcher, Reference Pitcher1993) and in particular by the presence in the upper crust of very weak phyllitic and slaty wall rocks. At the bottom of the granitoid stack (Fig. 1) other mechanisms may have created the space required for the growth of the Serre batholith. The lower crust underlying the batholith shows evidence of widespread partial melting and thinning (Festa et al. Reference Festa, Fornelli, Paglionico, Pascazio, Piccarreta and Spiess2012) that may have favoured space creation by floor depression. Therefore, for the entire Serre batholith a hybrid mode of emplacement (Cruden, Reference Cruden1998), typical of tabular plutons, may be envisaged.
6.b. Extent of the structural aureole and timing of deformation
Following the approach used by Marko & Yoshinobu (Reference Marko and Yoshinobu2011), the extent of the structural aureole corresponds to the width of the zone perturbed by large-scale folding. Instead, for the studied case, we prefer to define the structural aureole as the zone overprinted by the L2 crenulation and the S2 cleavage, which developed parallel to the hinge and axial surface of the large-scale synform, respectively. In this way it can be shown that the zone affected by deformation related to pluton emplacement has an extent of at least 3000 m from the intrusive contact. Consequently, in the Stilo-Pazzano phyllite unit the structural aureole is considerably wider than the metamorphic aureole (up to 1800 m wide).
Considerations on the relative timing of the propagation of deformation and the thermal perturbation can be made with the aid of microstructural analysis. Minerals related to contact metamorphism (i.e. biotite, cordierite and andalusite) clearly overprint the S1 fabric. Instead, in relation to the S2 fabric, spots and porphyroblasts are post- to syn-kinematic. Except for the hornfels, where the original fabric is almost completely erased, in the inner part of the aureole (And-bearing; Fig. 2) there is evidence of andalusite and cordierite growth synchronous with the late stages of D2 deformation. In the external part of the aureole, beyond 700–800 m from the intrusive contact (Fig. 2), spots are more clearly post-kinematic. This indicates that moving away from the contact, the thermal perturbation cumulated a significant time lag with respect to the tectonic perturbation.
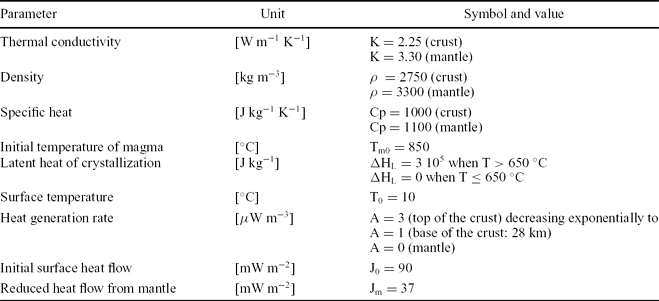
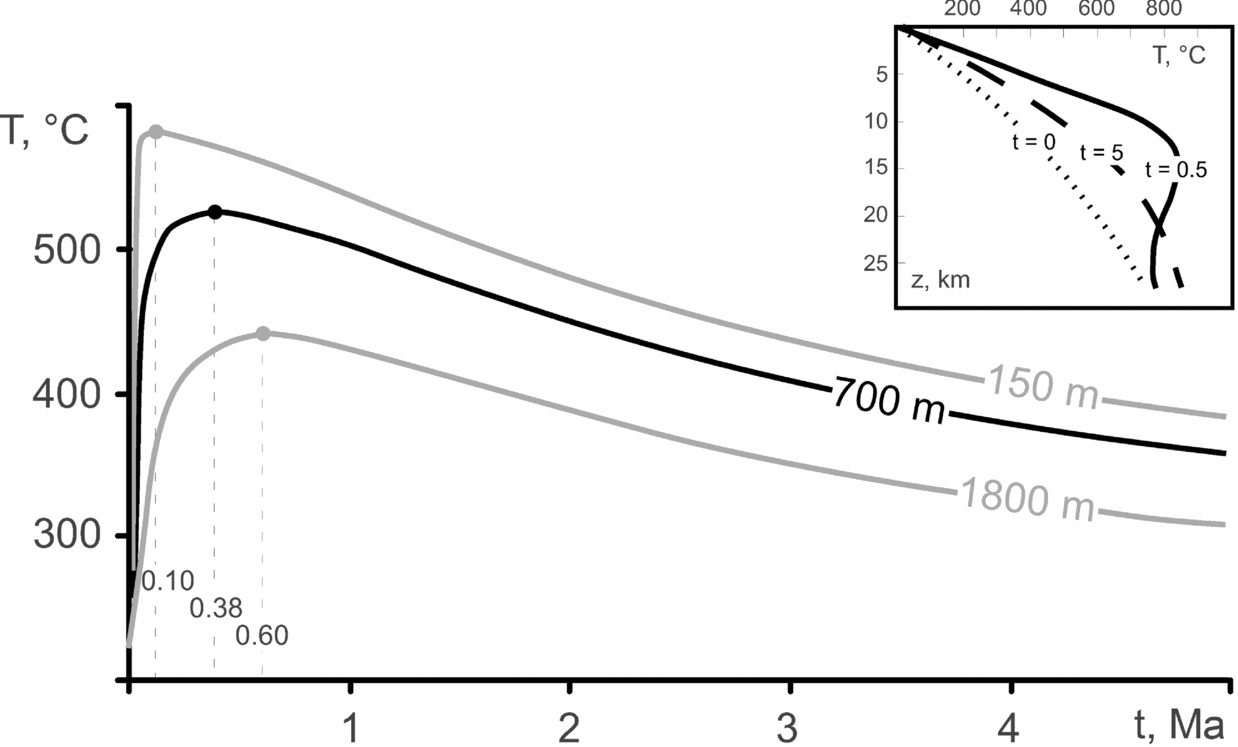
Assuming the geometry of the Serre batholith is consistent with previous work (Caggianelli & Prosser, Reference Caggianelli and Prosser2002), and taking into account the thermal parameters in Table 2 and depth of emplacement estimated in the present study, we can evaluate the time needed to reach the thermal peak close to the transition between the inner and outer aureole (about 700 m from the intrusive contact). Here, cordierite spots and andalusite porphyroblasts clearly overprint the S2 foliation. Calculations have been done with the aid of a simple one-dimensional (1D) numerical thermal model, considering vertical heat conduction in the upper crust, following the procedure described in Caggianelli & Prosser (Reference Caggianelli and Prosser2002). This is based on the Stella® code that solves the 1D heat conduction equation by the Runge-Kutta fourth order finite difference method. The model assumes that a granitoid magma with an initial temperature of 850°C instantaneously emplaced at depths ranging from 7.5 to 19.5 km in the continental crust. The latent heat of crystallization is taken into account following the approach described in Spear (Reference Spear1993). The initial geotherm results in temperatures of about 750 and 1300°C at the base of the crust (28 km) and lithosphere (80 km), respectively. The instantaneous intrusion assumption may seem unrealistic (see Annen, Reference Annen2011) for such a voluminous granitoid body, but age constraints for the total growth time of the Serre batholith are presently lacking.
A synthesis of the thermal parameters adopted in the numerical model based on heat conduction

Results of the thermal modelling (Fig. 8) indicate a time lag in the peak of the thermal wave of about 380 ka with respect to the time of granodiorite emplacement. This can be assumed to be a temporal limit to accomplish deformation in the inner aureole. A rough shortening estimate of about 50% in the inner aureole, resulting from deformation related to the synform and S2 cleavage development, provides a minimum strain rate in the order of 4 × 10⁻¹⁴ s−1. Alternatively, a time lag of about 200 ka can be obtained, corresponding to a minimum strain rate of ~ 8 × 10⁻¹⁴ s−1, assuming that the thermal perturbation is related exclusively to the granodiorite body (about 4 km thick). Both results are in line with estimates for other situations around the world and various emplacement mechanisms (e.g. Paterson & Tobisch, Reference Paterson and Tobisch1992; Johnson, Albertz & Paterson, Reference Johnson, Albertz and Paterson2001; Cruden, Reference Cruden, Brown and Rushmer2006).
Cooling curves calculated with 1D thermal modelling for points at 150, 700 and 1800 m from the intrusive contact. Initial temperatures for the selected points are 270, 230 and 220°C, respectively, since they were originally located at decreasing palaeodepths before Tertiary tilting. Diachronism of thermal peaks for the different locations can be noted. In the inset the initial geotherm (t = 0) and the transient geotherms at 0.5 Ma and 5 Ma after emplacement of granitoids are shown. In the model it is assumed that the Serre batholith is tabular and is emplaced at a depth (z) between 7.5 and 19.5 km. Parameters used in calculation are detailed in Table 2.

7. Concluding remarks
The multidisciplinary study of the structural and thermal aureoles exposed at the southeastern margin of the late-Hercynian Serre batholith allowed obtaining some relevant results that may be useful for the study of the emplacement mechanisms of tabular granitoids. We envisage that a laccolith-like mode of emplacement can be adopted for the upper part of the Serre batholith. This emplacement mechanism took place at a deeper level (7.0–7.5 km) with respect to depths typical of laccoliths well known in the literature. Therefore, roof uplift may have provided some space in the upper part of the Serre batholith, the emplacement of which was mainly driven by other mechanisms, such as floor depression.
Other important results can be summarized in the following points:
(1) Contact metamorphism in the metapelites produced a peak assemblage including biotite, cordierite and andalusite, equilibrated at conditions of P = 175–200 MPa and T = 535–590°C.
(2) The emplacement of granodiorite, making up the upper level of the Serre batholith, was responsible for the genesis of an open synform rimming the pluton for a length of at least 20 km.
(3) L2 crenulation and S2 cleavage in the structural aureole are associated with the genesis of the rim fold and are mostly overprinted by cordierite and andalusite porphyroblasts.
(4) The restored geometry of the fold, obtained by subtracting the Tertiary tilting, is compatible with the bending of wall rocks flanking a laccolith-like intrusion.
(5) The laccolith-like emplacement at the top of the Serre batholith was favoured by the very weak nature of the upper crustal wall rocks, which are mainly made up of phyllite and slate.
(6) Deformation related to pluton emplacement propagated to a distance of at least 3000 m from the intrusive contact. Therefore, the structural aureole is considerably wider than the metamorphic aureole, which has a maximum extent of 1800 m.
(7) Moving away from the contact, the thermal perturbation occurred after a significant time lag with respect to the tectonic D2 perturbation. It was calculated that at a distance of 700 m from the intrusive contact, the thermal wave peak arrived 380 ka after the time of pluton emplacement.
(8) Assuming the shortening recorded in the inner aureole is in the order of about 50%, the minimum strain rate related to pluton emplacement can be estimated in the range of 10−14 to 10−13 s−1.
Acknowledgements
We are grateful to Alexander Cruden and an anonymous referee for their comments and suggestions that helped to significantly improve the manuscript. This work was supported by ‘Fondi di Ateneo’ grants from the Università degli Studi di Bari ‘Aldo Moro’ and Università della Basilicata.