

On 14 September 1929, an ad placed in The Saturday Evening Post by Standard Statistics, a US rating agency, read: ‘Today You Need not Guess [. . .] History sometimes repeats itself – but not invariably. In 1719 there was practically no way of finding out the facts about the Mississippi venture. How different the position of the investor in 1929!’ The ad went on to explain that modern investors were fortunate be able to rely on the opinion of rating agencies such as Standard Statistics. The claim may sound hollow given the financial collapse that was to come and ironic in the light of more recent discussion. Ever since the East Asian crisis of 1997, credit rating agencies have been a lightning rod for criticism when financial markets were perceived to fail. In the midst of the financial collapse of Thailand, Indonesia and South Korea, many observers blamed rating agencies: after having been unable to predict problems, they were perceived to have amplified business fluctuations through hasty downgrades. The modern conventional wisdom among many scholars today is that rating agencies display a tendency to be reactive to financial crises rather than anticipate them (Reisen and Von Maltzan Reference Reisen and Von Maltzan1999; Ferri, Liu and Stiglitz Reference Ferri, Liu and Stiglitz1999; Reinhart Reference Reinhart, Levich, Majnoni and Reinhart2002; Partnoy Reference Partnoy, Fuchita and Litan2006; Benmelech and Dlugosz Reference Benmelech and Dlugosz2009).
Relatively little is known about the prehistory of ratings and the classic account of the development of the securities rating business is still Harold (Reference Harold1938). However, the topic has attracted considerable research interest more recently. Economic sociologists and historians have made important inroads into the study of business rating by so-called mercantile agencies, as the nineteenth-century predecessors of rating firms were known (see Carruthers and Cohen Reference Carruthers and Cohen2006; Lauer Reference Lauer2008), as well as of business ratings in other countries (Berghoff Reference Berghoff2008).Footnote 1 References also include Sylla's excellent overview of the history of security certification in the US (Sylla Reference Sylla, Levich, Majnoni and Reinhart2002), Flandreau's paper on the origins of sovereign debt rating in France in the nineteenth century (Flandreau Reference Flandreau, Flandreau, Holtfrerich and James2003), and Partnoy's work on the perverse effects of regulation on ratings and rating quality (Partnoy Reference Partnoy, Fuchita and Litan2006, Reference Partnoy2009).
This article makes a contribution to this emerging literature on the history of ratings by focusing on the assessment of foreign government debt by US rating agencies during the interwar period. There are two reasons for this focus. First, it was during the interwar period that ratings became involved in regulation. This happened as a direct response to the debt crisis: when all bond prices plummeted in the midst of the financial turmoil of the summer of 1931, the Office of the Comptroller of the Currency (OCC) – a department of the United States Treasury in charge of supervising nationally chartered banks – took an emergency decision to use credit ratings-based formulae to book the value of US national banks’ bond portfolios.Footnote 2 From that point on, ratings became the main instruments through which regulators supervised banks’ risk exposure – which suggests that they were seen then as part of the solution, not as part of the problem. Second, looking at the government debt crisis may add a useful perspective on what remains one of the most (perhaps the most) violent foreign debt disasters in financial history. Between 1931 and 1939, more than half of sovereign borrowers who had issued in New York during 1920–9 defaulted. The episode, an integral part of the catastrophic interwar financial system dislocation, has not yet been studied from this vantage point although many other aspects of the crisis have been discussed in detail.Footnote 3 In previous narratives, rating agencies are either ignored or are viewed as external and fair judges of the debacle.
At the broadest level, this article belongs to a tradition of papers that has discussed whether the public could or did foresee interwar financial problems (Dominguez, Fair and Shapiro Reference Dominguez, Fair and Shapiro1988; Klug, Landon-Lane and White Reference Klug, Landon-Lane and White2005; Favero Reference Favero2007).Footnote 4 The New York foreign government debt market is a particularly relevant venue to ask this question. It was reported to be where abuse of investors by underwriting banks was most rampant (US Senate 1932). Afterwards, one of the most vociferous critics of sovereign debt origination (which was perceived to have malfunctioned during the 1920s) was Max Winkler, former head of Moody's sovereign ratings unit until 1928.Footnote 5 In 1933, Winkler claimed that, as early as in July 1925, he had emphasized in a special report released by Moody's Investors Service that banks were ‘unethical’ and that the ‘many circulars, descriptive of foreign loans issued by prominent Banking and Financial Firms, contain[ing] statements which are either incorrect or decidedly misleading’, would later cause problems.Footnote 6 However, the precise wording he used at the time suggests that even he did not anticipate the extent of the catastrophe, for he wrote that ‘the rather small number of defaults on foreign issues [to be expected] would be even smaller if the methods employed by the bankers were less unethical’.Footnote 7
Beyond the broader question of investor foresight also lie a number of additional interesting issues. One that has received a lot of attention lately is the impact of the dynamics of competition on ratings and rating quality. The theoretical argument is that competition among providers of ratings can lead to a general deterioration of the quality of ratings known as ‘rating inflation’.Footnote 8 One can think of the intuition behind this prediction as being a variant of Gresham's law: because issuers only need to show they are good by one standard and because they pay for that, poor-quality ratings drive out the good, resulting in rating inflation (just as Gresham's law creates currency depreciation and inflation). An important conclusion to be drawn from this literature is that the effects of competition can be distorted by regulation. The regulatory licence created by the use of ratings in financial supervision can be a source of financial instability. Proposals to reform the use of rating agencies’ output are thus motivated by the view that, if rating agencies had to earn their reputation, they would be more careful and resist rating inflation. On this account the record of the interwar period is of peculiar value, since this period was before (at least until the crisis in 1931) the emergence of modern-day ratings-based financial supervision. We think it is interesting to study the agencies at a time when they had to rely on reputation alone for their business – and when, among several other institutional differences, they were charging investors and not issuers.
In this article, therefore, we describe the record of US rating agencies before and during the interwar sovereign debt crisis. To this end, we have gathered and analysed data on ratings and financial markets during the sovereign debt boom–bust cycle of the 1920s and 1930s. Focusing on foreign government securities listed on the New York Stock Exchange, we compare ratings’ reliability among different agencies and between ratings and market yields. We document a large degree of pro-cyclicality of ratings. Perhaps more surprisingly, rating agencies do not appear to have performed particularly well relative to financial markets in forecasting the approaching mess: when we compare the predictive power of agency ratings with that of synthetic ratings based on market yields, we find little that suggests strongly superior performance. Our results leave open the reasons for the emergence of ratings as regulators’ preferred instrument: for superior performance does not appear to have motivated the initial regulatory use of ratings.Footnote 9
The remainder of the article is organized in seven sections that belong to two broad parts. The first part comprises three sections that provide background information. Section 1 documents the interwar foreign debt boom and bust, Section 2 surveys the development of the rating business during that period and Section 3 explores the rating output focusing on the 1920s. The second part comprises four sections and tracks the agencies’ behaviour during the interwar debt crisis. Section 4 shows that 1931 was a turning point and Sections 5 to 7 rely on a variety of techniques to assess the agencies’ performance. We end with conclusions.
1. The interwar boom–bust cycle
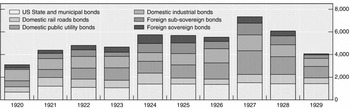
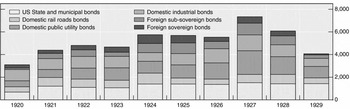
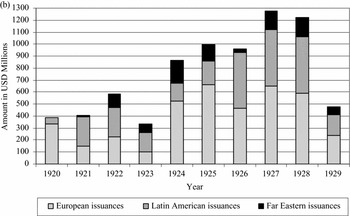
Between 1920 and the early 1930s, the New York bond market experienced a classic boom–bust debt cycle. Total bond issuance grew rapidly through much of the 1920s. Figure 1 shows the evolution for both domestic and foreign sovereign and sub-sovereign bonds. Total foreign issues peaked in 1924 when they were more than 25 per cent of domestic corporate issuance. Domestic corporate issuance reached a maximum in 1927. Bond issuance contracted dramatically after 1930, following the stock market crash and credit crunch.
Bond issuance on the NYSE, 1920–9 (in US$ millions)
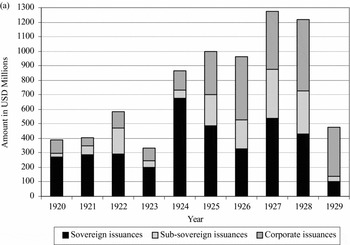
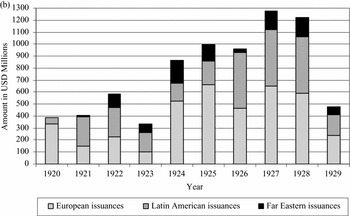
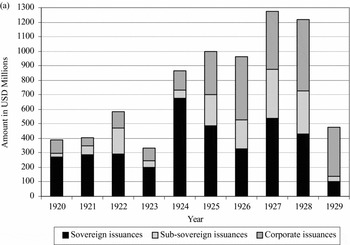
Foreign government bonds were a new line of business in New York. Prior to 1915, the US experience in sovereign lending and underwriting was limited.Footnote 10 Following the outbreak of World War I, the United States began playing a leading role through the financing of Great Britain and France, beginning with the Anglo-French war loan of 1915. Several short and long-term bonds were floated during the period 1915–17 on the NYSE.Footnote 11 The size and scope of New York issues increased after the war, and came to include sovereign, sub-sovereign, government-guaranteed and corporate securities from Latin America, Europe and the Far East (see Figure 2a and b). One of the regions most benefiting from US government support of banks’ foreign activities was Latin America.
Foreign bonds: sovereign, sub-sovereign, and corporate bonds (issues on the NYSE, 1920–9, US$ millions)
Total European, Latin American and Far Eastern bonds issued on the NYSE, 1920–9
To explain this expansion, some authors have emphasized the shifting position of the US current account from a structural deficit to a structural surplus and the accommodative monetary policy that was associated with the Gold Exchange Standard. Another explanation is the success of the Liberty Bonds issued between April 1917 and September 1918.Footnote 12 Another popular claim is that US policy makers may have helped by liberalizing issuance procedures in 1923.Footnote 13 Some authors have pointed to the deterioration of credit standards of some or most underwriting banks.Footnote 14
An often-discussed issue is the extent to which investors were able to come to terms with the difficult notion of debt sustainability. The key issue here was whether countries ‘over-borrowed’ or not. For instance, in a memorandum of 1927, S. Parker Gilbert, US Agent General for Reparation Payments in Germany, warned about ‘the accumulating evidences of overspending and over-borrowing on the part of the German public authorities’.Footnote 15 Similarly, the US Department of Commerce statistician Corliss told the US Senate Committee on Finance hearings on the sale of foreign government bonds in 1931–2 that he would have wished to provide statistical evidence to inform any discussion of over-lending.Footnote 16 Authors have emphasized the role played by ignorance (investors had little knowledge of the history of sovereign debt as there had been almost no sovereign bond defaults in the 1920s and few before), myopic behaviour (the great profitability of past foreign bonds issues was taken for granted) and miscalculations in sustaining the boom.Footnote 17
Foreign issues on the NYSE peaked in 1927, and issues stalled following the crash of 1929, as investors began questioning the creditworthiness of sovereign and sub-sovereign borrowers. In the wake of the Central European financial crisis in May 1931, foreign bond prices plummeted. The next stage was a wave of defaults, which began immediately with Bolivia, Brazil, Chile, Colombia, Dominican Republic and Peru, followed in 1932 by Argentina, Austria, Bulgaria, Costa Rica, Greece, Guatemala, Hungary, Panama, Salvador, Uruguay and Yugoslavia. In 1933 most German sovereign and sub-sovereign bonds went into default.Footnote 18 By September 1939, 39 per cent of the sovereign bonds issued on the NYSE in the 1920s had defaulted, accounting for 55 per cent of the issuance volume over that period. And more than four-fifths of the number of sovereign bonds issued in the 1920s that defaulted in the 1930s did so between 1931 and 1933.
A substantial literature has discussed reasons for the bust. Conventional interpretations try to distinguish between unwillingness and inability to pay. Citing inability to pay, researchers note unsustainable debts owing to international conditions.Footnote 19 In particular, many emphasize the contribution of sharp declines in commodity prices after 1929, which undermined the fiscal base of sovereign debtors and caused current account problems. Such problems were amplified by currency mismatch, since debt service was in dollars when revenues were in domestic currency.Footnote 20 We intend to add to this narrative a study of the record of rating agencies.
2. Sovereign ratings in business perspective
When our story begins, in the late 1910s, securities’ rating was a thriving branch of financial journalism. Corporate rating already had a long history dating back to 1857, when Bradstreet's Book of Commercial Reports was first released.Footnote 21 The expansion of corporate rating by so-called mercantile agencies was accompanied by a series of trials from which the predecessors of modern rating agencies emerged reinforced, thanks to an interpretation of the so-called principle of ‘qualified privileged’, which enabled these firms to produce and sell advice in the form of grades that summarized creditworthiness as raters perceived it.Footnote 22
At about the same time mercantile agencies became ingrained in the US corporate credit system, systematic descriptions of securities began to become popular. A variety of volumes documenting the characteristics of bonds emerged, although no ratings were yet given. These included Henry Varnum Poor's Manual of the Railroads of the United States (first published in 1868),Footnote 23 the Manual of Statistics (first published in 1879), and Moody's Manual of Industrial and Miscellaneous Securities (first published in 1900). These fairly thick volumes (the Manual of Statistics was ‘1040 pages but handy in both bulk and arrangements’ said the adsFootnote 24) were used by banks, insurance companies, industrial corporations’ treasurers and probably by some individual investors who consulted them at their bank.
Securities’ rating as we know it was started in 1909 when John Moody (after having gone bankrupt from other investments in the 1907 crisis) was forced to sell his earlier Manual.Footnote 25 He then reinvented the Manual with the Analyses of Railroad Investments and spiced-up the product by adding ratings of railroad securities. The idea of providing ratings for securities (in effect of government securities) had been toyed with in the past by Nash (Reference Nash1889) and by French bank Crédit lyonnais (Flandreau Reference Flandreau, Flandreau, Holtfrerich and James2003) but never on the scale adopted by Moody. Poor's followed suit in 1916. New entrants in the provision of ratings included Fitch and Standard Statistics both in 1922. This strongly suggests that investors valued summary assessments of outlooks.
In the interwar period, competition for supplying ratings to the public became active and the firms involved were large and profitable.Footnote 26 A general characterization of the competitive landscape could be as follows. Moody's was the incumbent, Fitch and Poor's were followers. Standard Statistics, which started as a ‘card index’ provider in 1900 (thus tracking information in firms for its customers) expanded aggressively and became second to Moody's in terms of the numbers of ratings issued (it would later merge with Poor's which experienced financial difficulties during the 1930s).Footnote 27
Thus, while it is not quite the case that ratings were an ‘American financial innovation’ (Sylla Reference Sylla, Levich, Majnoni and Reinhart2002), it is true that it is in America that the innovation took hold. The provision of ratings can be thought of as one aspect of the increased commercialization of investment advice, which the newly created statistical agencies were providing. After 1900, providers of financial information increasingly became ‘advisory agencies’ and included investment recommendations.Footnote 28 As a result, the key dimensions in which rating firms competed were coverage and timeliness.
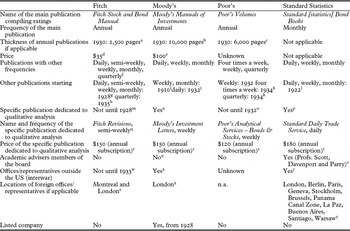
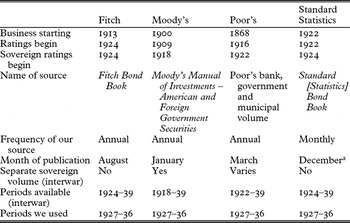
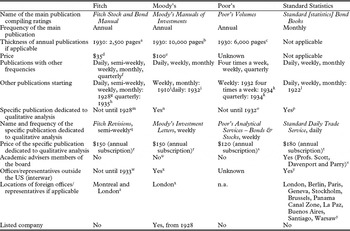
Table 1 provides a summary of what the agencies did in the interwar period, when, and for what price, with a particular focus on 1930.Footnote 29 Rating agencies covered securities through a variety of tools. On the one hand there was the reference instrument, which in the case of Fitch, Moody's and Poor's was the manual. For Standard Statistics, the reference tool was a card system, although some manual-like instruments were later produced, apparently as a way to attract customers to Standard Statistics. Comparison of the number of pages in the volumes for the three agencies with manuals reveals Moody's to have had the most. Its thicker books were also more expensive. Moody's also had distinct manuals for Municipal & Government, Banks and Finance Companies, Industrials, Public Utilities and Railroads, while competitors had more aggregated products.
Products offered by the agencies
a Fitch Stock and Bond Manual 1930.
b Aggregation of Moody's Railroad Manual 1930, Moody's Industrial Manual 1930, Moody's Public Utility Manual 1930 and Moody's Government and Municipal Manual 1930.
c Estimation based on the consultation of various Poor's Volumes in 1929, 1930 and 1931.
d Fitch Stock and Bond Manual 1930 price.
e Total sum of Moody's Railroad Manual 1930, Moody's Industrial Manual 1930, Moody's Public Utility Manual 1930 and Moody's Government and Municipal Manual 1930 prices.
f Fitch Bond Books introductions indicate ‘daily, semi-weekly, weekly, monthly, quarterly’ publications, although we could not find these sources.
g First indication found in Fitch Bond Book 1928.
h First indication found in Fitch Bond Book 1935.
i Babson (Reference Babson1910).
j Based on the description of Moody's Manuals released in 1932.
k First indication in Poor's Industry Service – News, Facts, Forecasts 1934.
l First indication found in Standard Daily Trade Service, February 1922.
m Based on the description of Fitch Revisions services found in Fitch Bond Book 1928.
n Based on the consultation of Moody's Manuals and Moody's Investment Letters released from 1918.
o Based on the consultation of Poor's Volumes published from 1922 and Poor's Analytical Services – Bonds & Stocks released from 1932.
p Based on the consultation of Standard Daily Trade Service released from 1922.
q Based on the description of Fitch Revisions services found in Fitch Bond Book 1929.
r Subscription prices in 1929.
s Subscription prices in 1923 (Wall Street Journal, 6 July 1923).
t Subscription prices in 1931.
u Moody's Manuals and Moody's Investment Letters published between 1922 and 1927 mention Max Winkler, PhD, but he is an employee of the agency.
v See Standard Daily Trade Service publications released in 1922.
w Found in Fitch Bond Book 1933.
x Based on the consultation of Moody's Manuals and Investment Letters released from 1918.
y Based on the consultation of Standard Daily Trade Service released from 1922.
z Found in Fitch Bond Book 1933 and Fitch Bond Book 1938.
Coverage by publications of Moody's, Poor's and Standard Statistics was close to exhaustive (missing securities would usually be covered in the next volume), though Moody's tended to be the most comprehensive. For instance, the number of sovereign securities listed on the NYSE at the peak of the interwar foreign debt boom in 1929 was 116: Moody's covered 115 of them, Standard Statistics 114, Poor's 113 and Fitch only about 105 (or about 90 per cent).
Frequency of updates was an instrument for marginal differentiation. To this end, Moody's developed its Investment Letter, a formula that was later adopted by Fitch and Poor's. Standard Statistics then started its daily updates in 1922.Footnote 30 From our perusal of sources and advertisements, we observe a gradual increase in the frequency of updates over time: weekly, then semi-weekly, then daily products were launched. Prices for these services were similar across agencies during the interwar period suggesting competition.Footnote 31
Competition also led agencies to offer new products to meet the increasing scope of investors’ interests. For instance, Moody's started reviewing sovereign and sub-sovereign entities in the annual Governments and Municipals handbook in 1918 at a time when the New York market for such securities was still in its infancy. The move was followed by other rating agencies: Poor's began sovereign ratings in 1922, Fitch and Standard Statistics in 1924. Other markets of greater or lesser importance to US investors could also be covered by rating agencies. One prominent example is the London market where a lot of non-dollar international sovereign bonds were traded which Moody's covered, though not the other agencies. Moody's also rated a higher number of domestic currency local bonds not listed in either New York or London than the other agencies.Footnote 32
Firms also attempted to differentiate through prestige. Standard Statistics posted names of professors from famous universities as part of their board of ‘contributing editors’.Footnote 33 Moody's employed Max Winkler and boasted his PhD in economics. While Standard Statistics was an established competitor in the business of selling statistical information, it was new to the game of selling ratings. The signal of hiring academic economists may have been meant to compensate for its lack of reputation or perhaps to position it as a provider of cutting-edge ‘scientific’ research.Footnote 34 Standard Statistics also advertised a large network of branches signalling a strong global presence, while Moody's established its international reach very early on with a branch in London. Fitch's international expansion came later.
3. Rating foreign governments debt in the 1920s
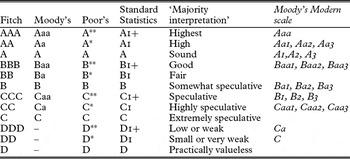
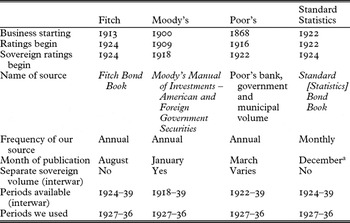
This section first surveys ratings symbology, and then moves on to discuss the agencies’ rating of foreign government debt during the 1920s. Collecting historical ratings today is not an easy task. In general, for want of convenient access to the agencies’ higher-frequency publications, which we found to lack comprehensiveness or be difficult to use, we settled for annual data collected from the more widely available manuals (see Table 2 for details).Footnote 35 Comparing ratings across agencies raises methodological issues. Unlike today's readily comparable scales, rating symbols were not supposed to match one another, and the firms insisted this was so. The A, B, C and [D] ranking was common to all four agencies, but different firms used different keys for granularity. For instance, to decompose the top A category, Fitch used AAA, AA, A, Moody's Aaa, Aa, A, Poor's A**, A*, A, and Standard Statistics A1+, A1, A. Complications included Moody's lack of a letter D and Poor's initial use of a ‘super-rating’ category above A** that was ‘practically inapplicable’ to most securities and discontinued in 1939 (Harold Reference Harold1938, p. 74).
Ratings: data source
Source: Authors.
aStandard Statistics did not have an annual volume properly speaking. The choice of December from Standard Statistics monthly sources to compile annual data was arbitrary.
Harold (Reference Harold1938) gives product differentiation as one likely reason why agencies did not initially seek consistency. Differentiation could enable agencies to interpret own forecast errors as owing to the different ‘meaning’ of their symbols.Footnote 36 That said, the use of ratings in regulation in the 1930s implied at some level that the ratings could be compared, and indeed, there appears to have been a consensus on this. The 1931 ruling by the Office of the Comptroller of the Currency made an official reference to the top four rating categories as being the safest ones, which thus implied there was a correspondence across the agencies.Footnote 37 This usage may then have provided incentives for agencies to make their ratings categories more consistent with each other.Footnote 38 In any case, Harold (Reference Harold1938) draws on the language used by agencies to establish what he calls a ‘majority interpretation’ of the correspondence across the individual agency ratings: At the top, for instance, Fitch described AAA securities as ‘highest’, Moody's Aaa were ‘highest’, Poor's A** ‘very high’ and Standard Statistics’ A1+ ‘highest class’. At the bottom, the D letter meant ‘slight or nil’ to Fitch, ‘practically valueless’ to Poor's and ‘doubtful value’ to Standard.Footnote 39 We reproduce the ratings scales in Table 3 and have accordingly added one column showing correspondence with modern keys (which have a finer granularity). Harold's majority interpretation is the criterion we used for aligning the ratings scales.Footnote 40
Correspondence across ratings
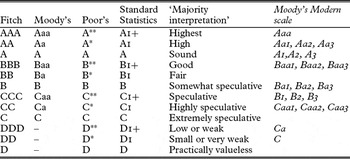
Source: Harold (Reference Harold1938, p. 75) and authors’ computations.
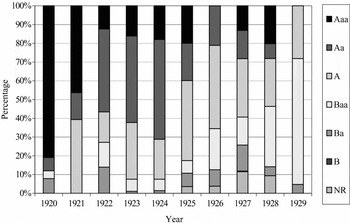
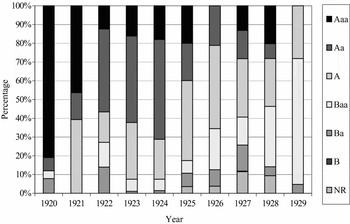
Having collected ratings for each agency, we are able to track the evolution of the grades they gave. Figure 3 begins with the record of the 1920s. It shows the breakdown of new foreign government securities brought to the NYSE during the 1920s. Results for this figure are shown using Moody's, as it was the agency with the longest and most exhaustive coverage and was thus ‘most representative’ (the other agencies had a similar behaviour). The figure shows a deteriorating quality of the portfolio of newly issued sovereign bonds in New York before 1929. The proportion of new securities rated Baa and below rises steadily across time to more than 70 per cent in 1929. To be sure, securities rated Baa or their equivalent were still described as ‘good’ and, later on, this category belonged to the top four notches that came to be known, owing to the privileges it received from regulators in 1931, as the ‘investment grade’ category. On the other hand, investment handbooks and the agencies themselves emphasized that below the A-rated group of securities, risks were significantly higher (motivating the change of letter). This is an important result as it suggests that rating agencies saw the decline in the quality of the bonds they were rating but did not anticipate that these risks would morph into a disaster of such a global scale.Footnote 41
Ratings assigned by Moody's to bonds in sample by year of issuance
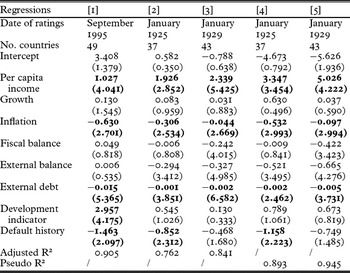
A useful way to get a sense of the economic indicators that were relevant to rating agencies when they gave grades is to take a closer look at the ratings of Moody's, which has left more abundant material. Just like today, rating agencies were rather cautious in sharing information on how grades were given, but Moody's Investment Letter (1919) and Moody's Investors Service (1924) provide details on the variables it deemed important. In 1919, when foreign government rating was still a very new business, the list heavily reflected post-war concerns: it included ‘national income’, ‘population changes caused by the war’ and the evolution of the ‘earning power of peoples’. By 1924, the list had not only become more exhaustive, but at the same time it had acquired a definite ‘modern’ ring. There were 25 criteria that could be grouped into seven broad categories. A first group of indicators captured the country's degree of industrialization; a second reflected institutional, political and geopolitical stability; a third was for the track record (debt repayment in the past etc.); a fourth reflected monetary stability; a fifth foreign trade; a sixth fiscal balance; and a seventh stood for the debt burden (relative to wealth or revenue).Footnote 42 These categories also parallel to a considerable extent research for the modern period (Cantor and Packer Reference Cantor and Packer1996), which found that five variables explain most of Moody's and S&P's sovereign ratings issued in September 1995: per capita income, inflation, external debt, level of economic development and default history.Footnote 43
We seek to identify the main determinants of the grades given during the 1920s, i.e. the factors in the minds of Moody's analysts (and, by extension, the analysts of other agencies) when they delivered the ratings.Footnote 44 Poring through the data in Moody's manuals, we extracted a number of indicators reflecting the quality of foreign government debt that enabled us to replicate the exercise in Cantor and Packer (Reference Cantor and Packer1996). We dropped some variables that the Moody's 1920s avatar defined more loosely or which are harder to measure, and focused on those variables for which there is a clear statistical definition.Footnote 45 These variables are used to estimate what weights were given to each indicator when producing ratings for outstanding debts at two benchmark dates, viz. 1925 and 1929 (the middle and the peak of the foreign debt boom).
The explained variable is the rating a country received at the benchmark date (1925 or 1929).Footnote 46 The explanatory variables are the variables Cantor and Packer (Reference Cantor and Packer1996) constructed for the 1920s sample: per capita income (measured as the wealth per capita in 1921 and 1925); growth rates (measured as the average annual GDP growth on a year-to-year basis for 1921–3 and 1925–7, in percentage); inflation (the average annual consumer price rate for 1921–3 and 1925–7, in percentage), fiscal balance (measured as the average annual central government budget surplus relative to gross wealth for 1921–3 and 1925–7, in percentage); external balance (measured as the average annual trade surplus relative to gross wealth for 1921–3 and 1925–7, in percentage); external debt (measured as the foreign currency debt relative to exports in 1923 and 1927, in percentage); a development indicator (Moody's classification as a ‘manufacturing country’ in 1925 and 1929) and default history (the default on foreign currency debt since 1900 and since 1904 respectively).Footnote 47 For ease of interpreting the coefficients, ratings were quantified in such a way that so-called good variables such as wealth should be associated with better ratings, and thus positive coefficients in the regression, and bad variables such as debt burdens should be associated with worse ratings, and have negative coefficients.
We use two regression techniques. The first rests on the conventional transformation of grades into numbers enabling implementation of straight OLS regressions (see Cantor and Packer Reference Cantor and Packer1996). We also consider alternative estimating procedures relying on the so-called Ordered Probit technique. Ordered Probit is a latent variable technique enabling researchers to model rank-ordered data. It relies on Maximum Likelihood techniques. Results are presented in Table 4: the first column gives results from Cantor and Packer (Reference Cantor and Packer1996), while the other columns report results for 1925 and 1929 using the two techniques mentioned above.
The determinants of Moody's ratings – regression results
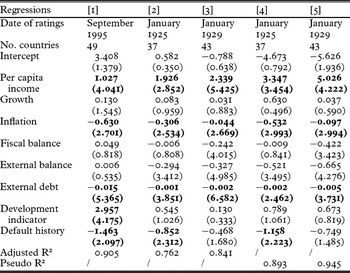
Notes: Absolute t-statistics are in parentheses. Coefficients with the expected sign and significant t-statistics (at the 5% level) are in bold. Regression [1] is Cantor and Packer's results for 1995 Moody's ratings. Regressions [2] and [3] are the authors’ OLS results. Regressions [4] and [5] are the authors’ ordered probit results.
The results yield coefficients on the variables that generally have the expected signs. Income per head and a good track record are systematically associated with higher ratings, while inflation and external debt are associated with lower grades. Interestingly, inflation and the track record are no longer significant in the second cross-section (1929), which could be interpreted as suggesting a degree of complacency by the rating agencies. The growth and the development indicator seem to have had negligible effects (perhaps owing to multicollinearity). Lastly, we find that fiscal and external balance were either non-significant or (especially in the 1929 cross-section) had the wrong sign. This suggests that the rating agencies did not place trade or fiscal imbalances at the top of their list of risk factors; they may have thought of these variables as endogenous, e.g. only ‘safer’ countries were able to build up large trade or fiscal deficits. Finally, the table is strongly suggestive of the stability of the determinants of ratings over the very long run. Of the five variables that are significant in the modern period (income per head, inflation, external debt, the development indicator and default history) four are significant with the correct sign in most of the historical regressions.Footnote 48
Three main conclusions emerge from this section. First, one did not need to wait for the work of later economists such as Mintz (Reference Mintz1951) to identify the deteriorating the quality of foreign governments’ securities issued in the NYSE during the 1920s. Rating agencies did report on this, although the reports they gave were hardly a reason to panic as most grades remained above the investment grade line (Baa/BBB). Second, we found that, broadly speaking, the determinants of ratings during the 1920s were not that different from those more recently estimated.Footnote 49 Last, the decline in the significance of inflation and track record between 1925 and 1929, as well as the lack of significance (or wrong sign) found for short-term fiscal or trade imbalances, suggests that rating agencies might have lowered their guard a bit ahead of the crisis, weighting some fundamental risk factors less than before.
4. The 1931 crisis and the era of downgrades
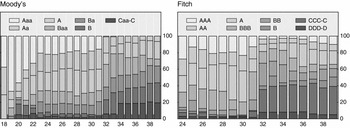
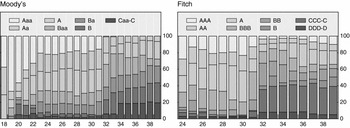
When the debt crisis struck in 1931, rating agencies, in line with the general collapse of market sentiment, revised their grades massively downwards. This is captured in Figure 4, which shows the evolution of ratings for the population of outstanding securities for two agencies (Moody's and Fitch).Footnote 50 Since new issues of foreign government securities were essentially discontinued after 1930, the sharp deterioration in rating composition reflected a net increase in downgrades of outstanding bonds. For Moody's, while only about one-fifth of the issues were rated Ba and below (i.e. ‘speculative grade’) in its January 1930 manual, that fraction had risen to 50 per cent by January 1933. The case of Fitch shows an even more dramatic change: while on average less than 10 per cent of their August 1930 ratings were BB and below, by August 1933 more than 60 per cent were in that category.
Composition of sovereign bonds rated in Moody's and Fitch manuals, 1918–37 (percentage)
Working with Moody's higher-frequency publications (the weekly Investment Letter), we were able to track the precise date when Moody's own downgrades accelerated. After a summer in which Moody's started downgrading some securities as sovereign defaults were beginning to emerge, massive downgrades across the board were announced by Moody's in just one week. This was on 28 September 1931. On that date, Moody's downgraded 46 of the 81 securities for which we have complete information – i.e. 57 per cent of outstanding securities. The downgrades were themselves occurring in a market in complete retreat. Constructing an event window around 28 September 1931, and using bond quotations from the Wall Street Journal, we find that between 25 September and 2 October, the yields on bonds Moody's downgraded increased on average by 102 bps. Securities that were not downgraded held their ground (an average decrease of 22 bps, suggesting a flight to quality). The large number of events that occurred during the period makes it impossible to identify causation – let alone to measure the effect Moody's downgrades might have had on the market. But we note that Moody's downgrades occurred in the week that followed the sterling crisis (Wigmore Reference Wigmore1985). In any case, the speed with which the change of mood occurred is mesmerizing: while ratings had held up after the 1929 crash and then deteriorated slowly during the first eight months of 1931, subsequent revisions came with a bang in an atmosphere of contagious panic.
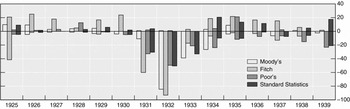
Moody's change of mind was not isolated – but since it is the only agency for which we can provide high-frequency analysis, comparisons must be made carefully. The annual data we have do show that various agencies reacted in somewhat varying ways within a common broad pattern. Figure 5 tracks upgrades and downgrades for the four agencies. Because of the different publication dates of the various agencies’ volumes (see Table 2), downgrades associated with the September 1931 crisis would show up as 1932 for Fitch and Poor's and as 1931 for Standard Statistics.Footnote 51 The chart shows that between January 1931 and January 1932, Moody's downgraded 80 per cent of the outstanding securities, compared to the 57 per cent it downgraded in just one fateful week. Fitch's manual, which was released in August, had the highest number of pre-crisis downgrades. On the other hand, Fitch's downgrades were to be even higher (90 per cent) during the later period, which covered the September 1931 crisis. Poor's (the ratings of which came out in March) had also already begun to revise its ratings in advance of the crisis (see 1931 in Figure 5, i.e. March 1930 to March 1931) but then again the peak came between March 1931 and March 1932, when about 50 per cent of securities were downgraded. Standard Statistics seems to have been the least reactive to the crisis – although it would be interesting to know its behaviour during September 1931 in greater detail: it downgraded 30 per cent of the securities between December 1930 and December 1931, and again 50 per cent between December 1931 and December 1932.
Upgrades and downgrades as fraction of outstanding ratingsa(percentage)
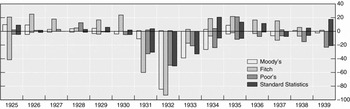
Of course, the need for these downgrades was in part a function of pre-crisis ratings. For instance, we see that Fitch was the agency that made the largest number of upgrades during the 1920s: its subsequent revisions represented reversals of its earlier opinions. Standard Statistics may have been more confident in the grades it had given earlier, and thus held its ground somewhat more consistently. However, we see that the foreign debt crisis eventually shifted the views of all the agencies and the number of downgrades increased from 1931 to 1934. Clearly, with the crisis of 1931, the rating agencies awoke to a new, more frightening, world and responded.
To the extent that the agencies remained relatively upbeat during the 1920s, with upgrades usually outnumbering downgrades, only to revise their perceptions drastically after the crisis struck, questions about the stability of ratings through the cycle may be raised. Strikingly, we find that the pro-cyclicality of ratings often emphasized in modern times is also a characteristic feature of their early experience, at a time when the agencies’ business model (how they charged, how they were regulated and how US regulators used them) was quite different from what it is now.Footnote 52 One interpretation is that the bond market collapse of 1931 was simply unpredictable. Although the agencies identified to some extent modestly increased risks in the second half of the 1920s, they were unable to forecast something of the magnitude of the global bond debacle of the 1930s. When it occurred, they ran for cover. Whether, in so doing, they simply reacted to the deterioration of financial conditions, or, as some commentators of modern episodes have suggested in different contexts, amplified the deterioration, is a matter for future research.
5. The performance of ratings during the interwar period: methodologies
The previous section offered analysis of the reaction of rating agencies to the 1931 debt crisis. In the sections to follow, we take a closer look at the performance, or ratings accuracy, of the agencies. Accuracy is not the only criterion of performance rating agencies care about, but it is definitely a major one. In the early 1930s, rating agencies found themselves under attack for their forecasting record. This was sufficiently serious to lead Standard Statistics to circulate globally a booklet meant to refute such allegations.Footnote 53 In this small pamphlet, Standard Statistics argued that it ‘did not grow to be the world largest statistical and investment advisory organization by giving inaccurate information and unsound advice. Rather, its growth may be attributed to the fact that it has conscientiously – and successfully – endeavoured to furnish reliable information and advice which, while by no means devoid of error, is right far more often than it is wrong.’Footnote 54
We assess performance via two principal methods.Footnote 55 The first focuses on default rates at different rating categories. Rating agencies indicate that relative rating accuracy is their primary objective. To be useful, ratings at a minimum should be able to provide a good ordering of risks among different credits. (This ability can be assessed either by comparing ex post default rates or recovery rates.) Since relative creditworthiness does not change dramatically over time, producing consistent rankings allows agencies to maintain ratings stability through the business cycle.Footnote 56
Thus, one indicator of the ability of rating agencies to order relative risks is the degree to which default rates tend to increase as ratings decline. The seminal work in the area is that of Hickman (Reference Hickman1958, Reference Hickman1960), who examines the performance of American corporate bonds in 1900–43, and the related work by Atkinson (Reference Atkinson1967) and Altman (Reference Altman1989).Footnote 57 In general, research has documented a consistently negative association between default rates and credit-rating categories (the lower the grade, the higher the default rate). Almost all post-war academic studies on the topic show this. In Section 6, we examine whether indeed ratings sorted relative risks during the interwar era as well. We also examine whether ratings levels subsequently labelled by regulators as investment-grade provided a significant degree of protection, in the form of much lower default rates.
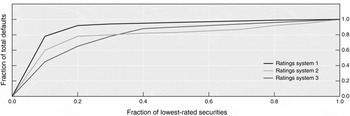
However, documenting the simple existence of a negative relation between ratings and default rates is probably unsurprising and a fairly weak test of ratings reliability. Further, it does little to distinguish between the discriminatory power of one rating system versus another. A more precise assessment of a rating system is provided by the so-called cumulative accuracy profile (CAP), and the use of a statistic based on the CAP is the second method we pursue here. Like default rates, CAPs can be calculated for any cohort of securities at a single point in time for any given time horizon. As shown in the generic examples of Figure 6, the CAP curve indicates the share of total defaults among the borrowers as a function of the share of the lowest-rated borrowers in the sample: in some sense, they are a distant cousin of Lorenz curves that measure inequality in a given society. Namely, for any given share of the lowest-rated borrowers in the sample (e.g. the lowest 10 per cent of the sample), the CAP curve charts what percentage of defaults in the sample they account for (e.g. 50 per cent). The more the CAP curve veers towards the upper-left-hand corner close to the vertical and horizontal axes, the greater the proportion of defaults that occurs in the lowest rating categories.
Cumulative accuracy profiles: three cases
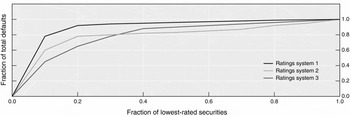
This representation of ratings performance is independent of the particular scales used by agencies as well as the absolute level of default rates. Comparison then only requires using identical cohorts of securities across identical time periods. It is made by graphing different rating systems on the same chart and looking for the one that always provides a higher proportion of defaults for ratings in ascending order. While the concavity of Lorenz curves is bad news for a society's equality, the concavity of the CAP is good news for the ‘sorting capacities’ of the rating system it measures: rating systems that produce ‘more concave’ CAP curves are deemed superior to others. This is the case for rating system 1 in Figure 6, which dominates both rating systems 2 and 3. Of course, it can be the case that different curves provide ambiguous signals about their relative accuracy. This is when different parts of the curve lie closer to the upper-left-hand corner, depending upon the portion of the rating scale that is examined. This is the situation for rating systems 2 and 3, which cannot be compared to one another.
It is possible to distil the information of any cumulative accuracy profile into a single statistic, the accuracy ratio (AR). This is the ratio of the area between the CAP curve and the 45 degree line, and the maximum possible area between the 45 degree line and a perfectly accurate rating system. (The means of calculation are discussed in the Appendix.) The accuracy ratio has a number of attractive properties: (a) it is always larger for any curve that lies above another; (b) it effectively varies between -1 and 1, much like a correlation measure, where 1 represents maximum accuracy when all defaulters are assigned the lowest ratings; and (c) it is invariant to changes to the aggregate default rate that do not also change the ratings distribution of the share of defaults.Footnote 58 In Section 6, we compare the accuracy ratios of different rating systems.
6. Rating categories and default rates
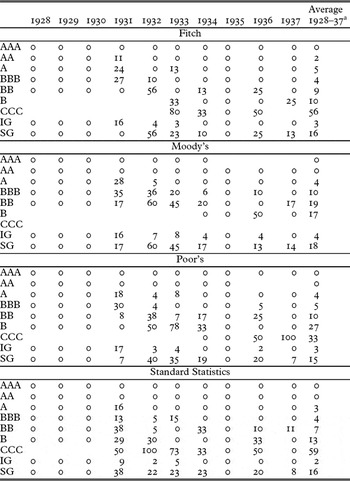
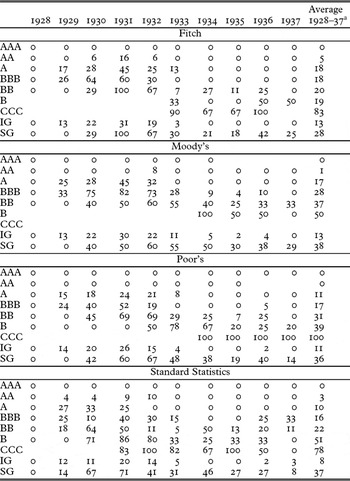
In this study, we assess accuracy by concentrating on defaults and default rates. Data for ratings are as described earlier.Footnote 59 Data for defaults come from Moody's manuals, completed with information from the Annual Reports of the Foreign Bondholders Protective Council (FBPC).Footnote 60 A natural starting point to the discussion of ratings reliability is the relevance of the letter-grade cut-off between investment grade (IG) and speculative grade (SG), although this cut-off did not yet exist (although it was already implied in the language used).Footnote 61 Nonetheless, if we go by this rule, a broad consistency does emerge. We estimate that sovereign securities rated IG by Moody's exhibited a 4 per cent average one-year default rate during 1928–37, compared to 18 per cent for bonds in SG.Footnote 62 Results for other agencies are not dissimilar, and this points to a broad correspondence between rating categories and a tendency to default similar to that found for corporate bonds (Hickman Reference Hickman1958).
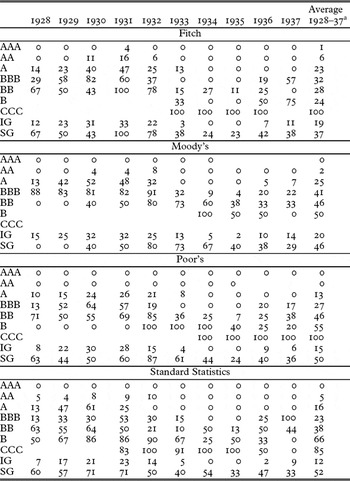
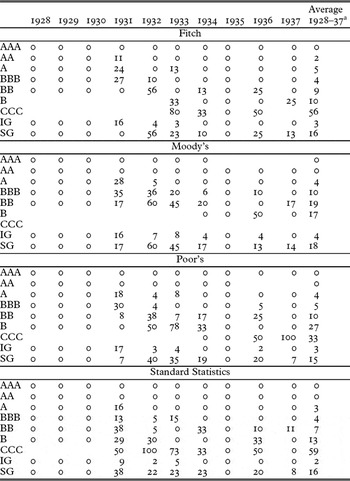
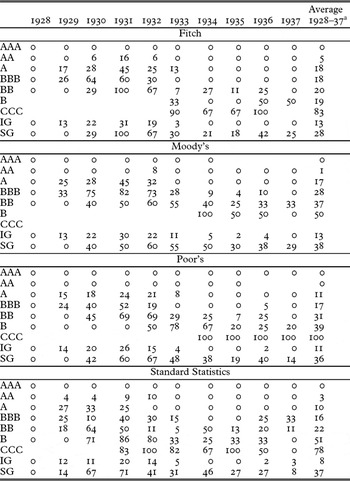
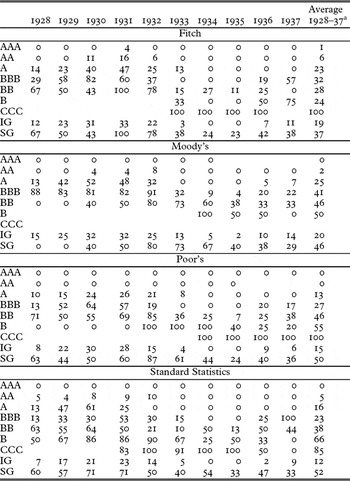
To delve further into the matter, Tables 5–7 provide a decomposition of default rates across time and agencies for three time horizons (one, three and five years). By and large, these tables are all consistent with default rates rising as ratings decline for most years before and during the financial crisis. Beyond this, however, the interwar experience stands out as exceptional in several respects.Footnote 63
One-year default rates, 1928–37
aWeighted by the number of issues.
Source: Authors’ computations
Note: For Tables 5–7, rating-based cohorts for each year are formed on the basis on the last observed rating the previous year. The reported rates for Tables 5–7 are the percentage of securities in each cohort that defaulted over that year (Table 5), that year and the next two years (Table 6), and that year and the next four years (Table 7).
Three-year default rates, 1928–37
a Weighted by the number of issues.
Source: Authors’ computations.
Five-year default rates, 1928–37
a Weighted by the number of issues.
Source: Authors’ computations.
First, considerable variability is present in default rates at various time horizons: for example, the one-year high-grade default rate for Fitch, which averages 3 per cent in the years 1928–37, ranges between 0 and 16 per cent for individual years; at the longer horizon of five years, the high-grade default rate for Moody's ranges between 2 and 32 per cent. Some variability is consistent with more recent evidence (Cantor and Packer Reference Cantor and Packer1994). However, the numbers involved are much greater than that documented more recently, most likely indicative of the degree to which the foreign government debt crisis and Great Depression were unanticipated and certainly beyond cyclical norms.Footnote 64
Second, the numbers show high rates of casualties even for high-grade credits, nearly an order of magnitude difference at all horizons relative to recent experience. For instance, the average high-grade one-year default rate (for the years 1928–37) of between 2 and 4 per cent for the four rating agencies (Table 5) dwarfs Moody's worst single-year default rate for investment-grade credit during 1983–2001 of 0.5 per cent. Similarly high-grade default rates at the three-year horizon (for the years 1928–37) that average between 8 and 13 per cent for the four rating agencies (Table 6) are to be compared to a worst year of 2 per cent in the recent Moody's rated sample cited above.Footnote 65
Third, it is worth noting that rating agencies differ quite a bit among themselves in the interwar era. Moody's average one-year default rate for BBB (Baa) issues of 10 per cent corresponds to default rates for Fitch, Poor's and Standard Statistics of 4, 5 and 4 per cent, respectively. For average three-year BBB (Baa) default rates, Moody's 28 per cent compares to 18, 17 and 16 per cent of Fitch, Poor's and Standard Statistics.Footnote 66 The differential may capture different levels of performance; but it could also be indicative of the fact that before the correspondence of ratings implied by regulation was well established, the default rates could well have been expected to differ in seemingly similar rating categories. For instance, Moody's may have thought at that time of their Baa rating as corresponding to a higher default rate than the other ratings agencies thought of their BBB-equivalent.Footnote 67 Another example is provided by Standard Statistics’ higher-grade rating default rates, which were consistently lower than those of the other three agencies at all time horizons, suggestive of either a different cut-off for Standard Statistics than the other three agencies for high-grade credits (in conflict with what external observers perceived) or of a more pessimistic outlook than other agencies.Footnote 68
Fourth, these differences are nowhere more perceptible than in the default rates at the onset of the debt crisis. If we go by the IG/SG cut-off, we see that several rating agencies had initially high casualty rates in the investment grade category. Fitch is a good illustration, with a 16 per cent default rate (for one-year-ahead horizon) in 1931. This may have accounted for its particularly aggressive downgrades during that same year and the following one, suggesting that the crisis may have contributed to greater homogeneity in rating agencies’ scales. In any case, this reinforces the notion that the extent of the crisis was generally not anticipated by the agencies.
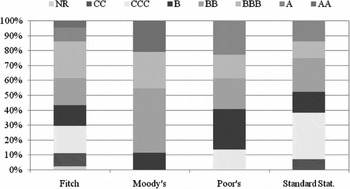
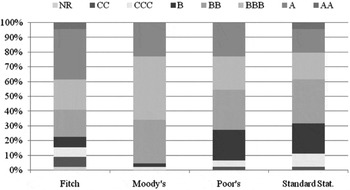
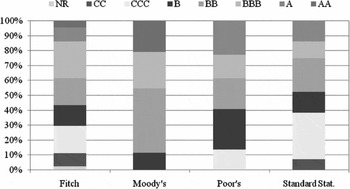
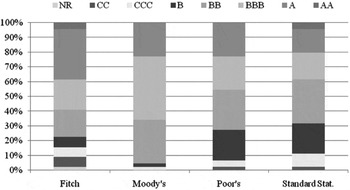
Figures 7 and 8 provide further insights. Figure 7 shows the composition of the (last observed) ratings for the four rating agencies at the time of default for the 44 defaults of the sample.Footnote 69 Defaults surged across many rating classes. So-called ‘high-grade’ ratings appear to have provided little guarantee against default during the financial crisis. More than one-half of all defaulted bonds are observed to have a high-grade rating (the equivalent of Moody's Baa or higher) from at least one agency. In the case of Fitch and Poor's, 39 per cent of the last observed ratings of the defaulting issues are high-grade. In the case of Moody's, fully 45 per cent were rated high-grade. Standard Statistics has ‘only’ 25 per cent of the defaulting issues rated high-grade.Footnote 70 The incidence of high-grade defaults at the time was not merely due to bonds at the fourth highest letter grade level. A good chunk of the high-grade defaults occurred with observed ratings even higher than the fourth highest letter grade level: defaults of A grade (or equivalent) or higher accounted for up to 23 per cent (Poor's) of the high-grade defaults.Footnote 71 Even starker results obtain when we move a bit further back in time, and check the last observed ratings of defaulted issues one year ahead of default (Figure 8). Between 39 (Standard Statistics) and 66 per cent (Moody's) of the defaulting bonds are observed to have a high-grade rating one year ahead of default.Footnote 72 Again, there are many future defaulters in our sample rated A grade (or equivalent) or above one year ahead of time (more than half the high-grade defaulters).
Ratings composition at the time of default (1920–39, 44 defaulted issues)
Ratings composition one year before the default (1920–39, 44 defaulted issues)
The results may be interpreted as supporting the view that, although rating agency observers by and large were able to rank relative risks, they missed out on the extent of the interwar debt crisis. This may tell us something about the agencies’ predictive capacity, about the nature of the crisis, or both.
7. Performance and accuracy ratios
We suggested that the use of absolute scales or the IG/SG cut-off, which only developed during the 1930s, may be anachronistic. In what follows, we compare the performance of the four agencies’ separate ratings, an average of their ratings, using the accuracy ratios discussed above. As already indicated, these ratios have the attractive property of focusing solely on relative grades and thus permit us to avoid any assumption regarding the correspondence of ratings scales across agencies.
7.1. The relative performance of agencies
The need to obtain credit ratings as well as matching market yields across the four agencies produces a set of more than 100 bonds, though only a subset of these are used for any single cohort since not all bonds are rated by the same agencies, and they enter in and exit the sample due to new issuance, redemption, default and so forth (for instance, there were 89 bonds used to assess Moody's accuracy ratios in 1931). As before, we consider three horizons (one year, three years and five years). To capture the performance over the wave of interwar defaults and downgrades we examine the one-year-ahead predictive performance of the various ratings between 1931 and 1936 (since there were no defaults in 1935, one-year accuracy ratios cannot be calculated for that year). We look at the three-years-ahead performance for the (non-overlapping) cohorts of 1929, 1932 and 1935. And finally the five-years-ahead performance is examined for the non-overlapping cohorts of 1929 and 1934.
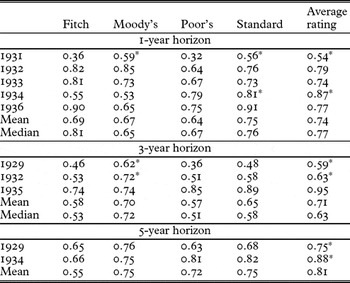
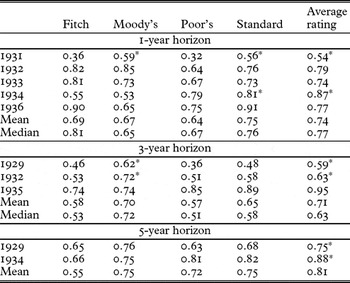
Results (in Table 8) suggest that, quite apart from the issues discussed above of the respective scales used by agencies, there were on occasion differences in accuracy in the ranking of relative credits. These differences come into clearest relief when we differentiate between the performance of ratings over the short-term one-year horizon, and those over the longer three to five-year horizons.
The accuracy ratios for agency ratings and average rating
Source: Authors’ computations.
Note: The rating category for each year's securities is determined as in Tables 5–7. An accuracy ratio has an asterisk next to it if it is greater than at least one of the accuracy ratios of the other agencies (for the same yearly cohort) at the 95% level of statistical significance (test statistic from Hanley and McNeil Reference Hanley and McNeil1983).
Over the one-year horizon, Fitch, Moody's and Standard Statistics each belong to two cohorts in which they have the highest accuracy ratio, while Poor's has the lowest average mean and median ratios over the period. Though Fitch's AR was low in the first year, with the poorest forecast of 1931 defaults, it improved considerably in the years that followed, most likely reflective of the many rather rapid rating changes it made subsequently. Tests of statistical significance of these differences lend some credit to Moody's dominance.Footnote 73
Over the longer-term three- and five-year horizons, Moody's or Standard Statistics have the highest accuracy ratios among the four agencies in 60 and 40 per cent of the cohorts examined, respectively, and the two agencies have the highest mean and median accuracy ratios at these time horizons as well.Footnote 74 The clear differentiation in longer-term performance is interesting per se and may be related to the evidence presented above that Moody's was the market leader in ratings, while Standard Statistics was actively raising its profile. Current supporters of the view that competition among agencies may promote the accuracy of their ratings can find comfort in this result.Footnote 75
In an indication that the individual rating agencies might be getting separate, valuable, signals about the creditworthiness of sovereign borrowers, the accuracy ratios of the consolidated ratings (average rating) were often superior to those of each of the single agencies at longer horizons. The average rating scored higher on average than all of the individual agency ratings at the three- and five-year horizons, with a mean accuracy ratio higher than each of the single agencies.Footnote 76 In six of the ten cohorts, the accuracy ratio of the average ratio was significantly higher (at the 95 per cent level of statistical significance) than at least one of the rating agencies.
7.2. Agencies vs the ‘market’
Finally, we compare the agencies with a measure of ‘market’ ratings. To compute market ratings, we used a method detailed in Breger et al. (Reference Breger, Goldberg and Cheyette2003) to transform yield spreads (collected using prices in the Wall Street Journal)Footnote 77 into ratings. Of course, to the extent that ratings influence markets (and perhaps conversely, too) the information in ratings may not be different from that in yield-implied ratings. Yet this is precisely what we seek to discuss: we found in the previous section that rating agencies were quite able to get relative risks right but missed the risks of an aggregate shock. One question that remains to be addressed is whether this particular failure reflected a worse, similar, or even better performance than that of the market. Since this was the time when rating agencies started being relied upon by regulatory authorities in the US, there is a possibility that the agencies had somehow outsmarted the market – if only by a modest margin.
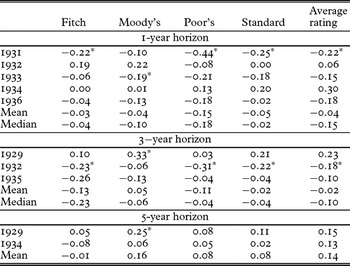
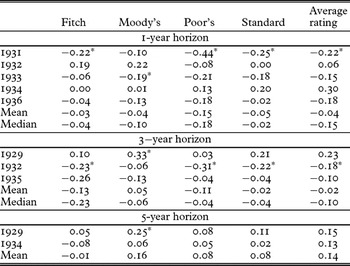
Table 9 reports the difference between the accuracy ratios of the agency ratings and synthetic ratings derived from market prices for the same cohorts. Therefore, a negative number in any cell indicates that the agency ratings had lower accuracy ratios than the yield-based metrics and thus were not as effective in sorting risks. The results suggest that market-based ratings modestly outperform observed agency ratings at the one- and three-year horizons, having a higher AR in about 16 of the 25 cases (four agency ratings plus average rating over five separate years) at the one-year horizon, and a higher AR in two-thirds of the cases at the three-year horizon. At the longer five-year horizon, actual agency ratings appear to outperform the yield-implied ratings (YIRs), though only modestly.Footnote 78
Difference between the accuracy ratios for agency ratings and for yield-implied ratings
Source: Authors’ computations.
Note: The rating category for each year's securities is determined as in Tables 4–6. The market yields upon which the yield implied ratings were calculated is taken to be the yield of the security at the beginning of the year. A number has an asterisk next to it if it is significantly different from zero at the 95% level of statistical significance (test statistic from Hanley and McNeil Reference Hanley and McNeil1983), i.e. the accuracy ratio of the rating agency was significantly higher (or lower) than that of the yield-implied rating.
That said, the difference in the accuracy ratios between observed ratings and yield-implied ratings at all maturities, while large for specific years and agencies, is relatively small when the mean is taken across all the cohort years. In addition, tests of statistical significance are unable to reject the null hypothesis of no difference between agency and market-based ratings in 15 out of 25 cases.Footnote 79 In sum, there does not seem to be anything specific or exceptional about the performance of rating agencies in assessing borrowing governments’ relative credit risk over the interwar period compared to what could have been inferred from market prices, except at longer time horizons.Footnote 80 This, we reckon, is certainly consistent with the fact that, even if they do not face alleged conflict of interests, rating agencies should not be expected to stand far outside the forecasts of the market. And if the market at large missed the crisis, why should rating agencies have been any different?
Conclusions
The interwar period offers a rich environment in which to examine the record of rating agencies. While many aspects of ratings could be considered, this article has focused on the ratings of foreign debt issued on the NYSE. Our main empirical finding is that the performance of rating agencies during the interwar era was not exceptional. Ratings seem to have reacted to indicators similar to those they react to in modern studies. Ratings above subsequent regulatory cut-offs provided little guarantee against default during the financial crisis. Rating agencies generally did not exhibit forecasting capacities superior to those embedded in available market prices. While this probably means that the agencies, like many other players in the financial industry, did not see the interwar debacle coming, it is also consistent with the view that their forecasting capacities at the time were not particularly outstanding.
At the same time, we also reported some evidence of rating agency insights into the crisis. The decline in the quality of securities issued in the 1920s, for instance, did not go unnoticed, although its extent was vastly underestimated ex post. Similarly, we found that market discipline may have operated in the shape of reputational brand concerns and this may explain the greater coverage and marginally superior forecasts by certain rating agencies such as Moody's and Standard Statistics, the two market leaders.Footnote 81
These findings have relevance for students of the Great Depression. They suggest that, despite what representatives of the rating industry such as Max Winkler later claimed, the agencies were not really the Cassandra of the international debt crisis. Claims that the ‘unethical’ behaviour of bankers could have been reined in if the rating agencies had been given a bigger say would be oversold. The conclusion may well be that, as some earlier characterizations of the crisis emphasized, the key drivers of the crisis were largely unpredicted movements such as the decline in commodity prices that did undermine the fiscal base of many borrowers and trigger an extraordinary crop of failures.
This conclusion provides food for thought. Given the fact that the performance of agency ratings did not shine at the onset of the sovereign debt crisis, it is somewhat strange that it was precisely at this time that regulators started relying on them. The initial decision by the OCC to rely on ratings appears to have been taken in the late summer of 1931 when defaults were still few (ironically, a few weeks before Moody's massive downgrades), but it was sustained over the next few years at a time when it should have been clear that reliance on ratings would have provided limited protection against the crisis. While the behaviour of rating agencies during the foreign debt crisis of the interwar period was typical of other market monitors (i.e. delay in recognising the severity of the crisis, then massive downgrades), the reaction of policy makers was nonetheless to reach out and enshrine their credit ratings in the new regulatory frameworks they were creating. This reaction was exactly contrary to the one many scholars now advocate. Future research will have to explain why this happened.
Acknowledgements
Part of this article was written while Marc Flandreau was visiting scholar with the BIS, whose hospitality is warmly acknowledged. Norbert Gaillard acknowledges financial support from the Caisse des Dépôts et Consignations. We are grateful to Magdalena Erdem for her invaluable assistance in preparing the article. We also thank Laura Rosner for assistance with additional sources located in New York. We thank Richard Cantor, Marcello de Cecco, Jean Helwege, Claudio Borio, Jacob Gyntelberg, Michael King, Patrick McGuire, Robert McCauley, Larry Neal, Patrick O'Brien, Mary O'Sullivan, Albrecht Ritschl, Tom Sargent, Richard Sylla, Augustin Villar, Eugene White, Mira Wilkins and seminar participants at the Bank for International Settlements, Bundesbank, London School of Economics, the Banca d'Italia conference on regulatory response to crises and New York University for their comments on a previous draft, circulated as CEPR DP 7328. We also thank the editors of the European Review of Economic History and their referees for valuable comments.
Caveat: The views expressed here are those of the authors and do not reflect those of the Bank for International Settlements. We also emphasize that, since the archives of rating agencies are not opened, some of the material discussed here comes from second-hand accounts and is bound to be corrected and improved as research progresses.
Appendix
1. Example of Moody's ratings (Dominican Republic, 1927, p. 444 of the Manual):

2. Formula for the accuracy ratio (AR)
This formula is computed using the difference between the cumulative distribution of realizations and the cumulative distribution of ratings or:

where D = total number of defaults N = total number of issuers D R i = is an index of R, which is an index of D N R i = total number of issuers rated R i and less D 0, N 0=0 R i = R 1, . . ., R max - ratings of a given agency
3. Formula for the yield-implied ratings
The goal is to compute the vector of brackets that minimize loss function P(b). In the following formula the (x)+ operator takes value zero when the result within brackets is negative.

where i(j) = agency rating index of issue j sj = spread of issue j over US bonds (for simplicity, since our computations are annual, and one average US yield is considered, we have performed computations over yields rather than spreads, without loss of generality) b +i(j)=upperthresholdforratingjbyagencyi b −i(j)=lowerthresholdforratingjbyagencyi wj=ratechosenijtoleveloffthecontributionofeachratingbucket